The decomposition identifies the contribution of each industry to inequality in GVA per worker across regions. It first expresses total GVA per worker as the sum of additive industry components, so for each region i and industry f:
, , with the region-industry components adding up to total GVA per worker: .
The coefficient of variation (CV) of GVA per worker is the ratio of the standard deviation of GVA per worker over the mean of GVA per worker, so the CV for total GVA per worker and per industry are:
, , with
The total coefficient of variation can be expressed as the sum of the contributions of each industry:
Where: , with equal to the correlation between industry and total GDP per capita: . With interpreted as the share of industry f in the sum of regional GVA contributions (so as an unweighted average-region share1), .
The sectors initially considered are grouped as: construction (ISIC F), manufacturing (C), consumer and personal services (trade, transport, accommodation (G-I) and arts, recreation and other services (R-U)), and knowledge-intensive business services (J, K, M-N). To focus on the comparison between KIBS and manufacturing two sectors are excluded: construction and primary industries. The contribution of construction is small across all 32 countries. The contributions from primary industries are low in almost all countries, except Australia and Canada, where they contribute the most, and Colombia, where it fluctuates between a medium and high contribution.
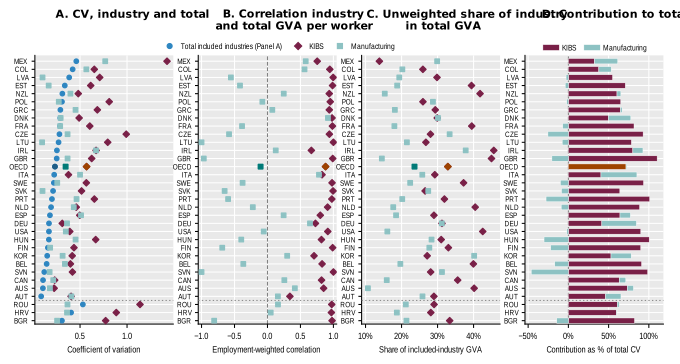
To show the effect of each component more clearly, Figure C.1 focuses on KIBS and manufacturing and shows for each sector the CV (Panel A), the correlation with total GVA per worker (Panel B), the (unweighted) shares in GVA (Panel C) and the resulting contributions (Panel D). The combination of a negative correlation with other components may result in negative contributions from an industry. However, additivity ensures that these negative contributions will be compensated by other industries.
A sector's contribution to regional inequality is large when three elements reinforce each other: (1) high regional dispersion of sector productivity (Panel A), (2) a strong positive correlation between sector productivity and total regional productivity (Panel B), and (3) a large sector share in GVA (Panel C). Thus, a sector can have a very high CV but still make only a moderate contribution if its economic weight is small; similarly, a large sector contributes little if its regional productivity pattern is weakly related to the overall pattern. A negative correlation is particularly important: it can generate a negative contribution, meaning that the sector offsets rather than reinforces overall regional inequality. The level of total CV then provides the context: the same 80% contribution can represent a dominant source of a relatively small total disparity or of a much larger one.