Productivity is a key dividing line between regions that catch up and those that fall behind, particularly as demographic pressures constrain employment-led growth.
Regional growth patterns differed sharply across the world between 2018 and 2024. Over this period, 22% of large regions, home to 15% of the population in 34 OECD countries, grew at a rate at least one standard deviation below the national GDP per capita growth rate, while 14% of regions home to 15% of the population grew at least one standard deviation faster (Figure 1.4 and Figure 1.5). A smaller share of people lived in regions underperforming in Europe (11.2%), Latin America (6.9%) and Oceania (0.4%) while a larger share did in Korea (85.3%) and, to a lesser extent, the United States (21.6%) and Türkiye (21.3%). Across accession countries, this share was highest for those in Europe (19.2%).
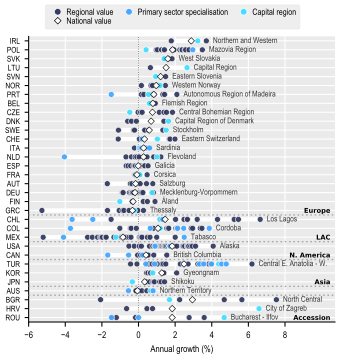
Between 2018 and 2024, productivity growth followed different regional paths, with capital-city regions generally pulling ahead while primary-sector regions sat at both ends of the distribution. On average across 33 OECD Member and accession countries, the highest-performing region in each country recorded annual productivity growth 3.4 percentage points faster than the lowest performing region, with the gap exceeding 7 percentage points in Bulgaria, Chile and Mexico (Figure 1.1). OECD countries in Latin America, Türkiye and accession countries displayed wider inter-regional differences in productivity growth than other countries. Regions specialised in primary-sector activities recorded some of the highest and lowest productivity growth rates. The median capital-city region recorded annual productivity growth of 0.86%, compared with 0.54% in other regions.
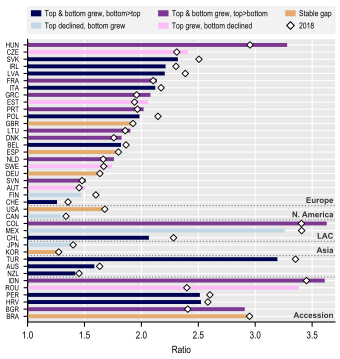
Uneven regional growth contributed to both widening and narrowing economic disparities across OECD countries. In 2024, GDP per capita in top regions was at least twice that of bottom regions in 14 out of 33 OECD countries with available data (Figure 1.2). The ratio was highest in Latin America (3.04), where it slightly narrowed between 2018 and 2024, followed by Asia (2.80), where it slightly increased in the same period. In 13 out of 17 OECD Member and accession countries where the gap narrowed, it did because bottom regions caught up to top regions through faster growth rates. In 11 out of 16 countries where top-to-bottom disparities grew, it did because bottom regions lagged top regions in terms of growth.
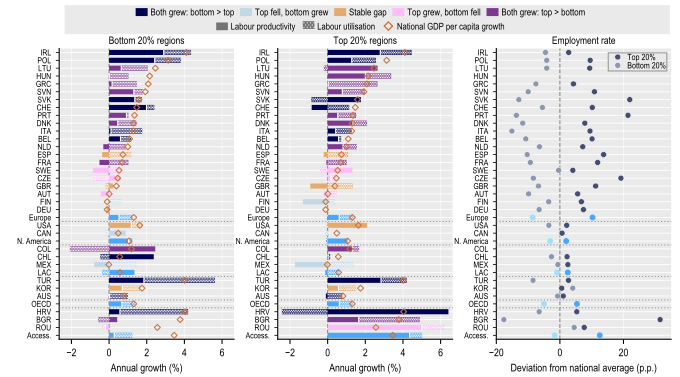
Having more scope to bring people into work does not mean that employment will necessarily drive convergence. Across the OECD, top and bottom regions grew at broadly similar rates between 2018 and 2024 (1.33% and 1.37% per year, respectively), with productivity accounting for around half of growth on average (Figure 1.3). Productivity accounted for the larger share of the growth differential between top and bottom regions in 13 of 27 countries with available employment data, including 6 of 13 countries where gaps narrowed and 7 of 14 where they widened. In 2024, bottom regions generally had employment rates below their national averages (5 p.p. on average), suggesting scope to raise GDP per capita by bringing more people into work. However, among bottom regions with below-average employment rates, productivity contributed more than labour utilisation to growth in 12 of 27 cases. For example, in Portugal, bottom-region employment rates were 14 p.p. below the national average, yet growth was driven predominantly by productivity.