Housing pressures are greatest in large urban agglomerations, where homes are less affordable, fewer dwellings are unoccupied, and housing supply struggles to keep pace with population growth.
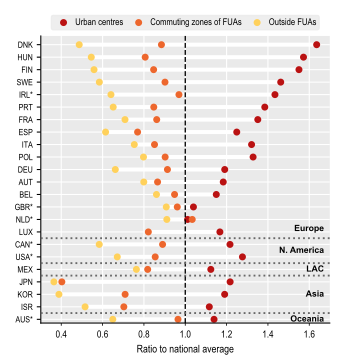
Housing prices are highest in urban centres and lowest in rural areas across OECD countries. Compared to the national average, housing is 27% more expensive in urban centres; 15% cheaper in FUA commuting zones; and 34% cheaper in areas outside FUAs (Figure 3.1). These differences reflect tighter housing markets in urban centres, where many people move to work or study and where construction is often constrained by limited land, regulation and local opposition to development. Price differences between area types are particularly large in Hungary and the Nordic countries, and relatively small in Belgium, the Netherlands, Luxembourg and the United Kingdom.
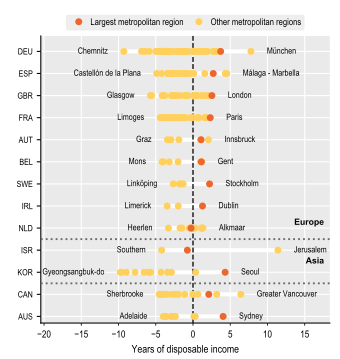
People in larger metropolitan regions tend to need substantially more years of disposable income to buy a home than people elsewhere, as much higher housing prices often outweigh their generally higher incomes. The largest metropolitan region has an above-average price-to-income ratio in 11 out of 13 countries with available data and is the least affordable in six of them (Figure 3.2). The gap between the least and the most affordable metropolitan region is largest in Germany, where people living in München need around 17 more years of annual disposable income than in Chemnitz, followed by Israel (15.6 more years in Jerusalem than in Southern).
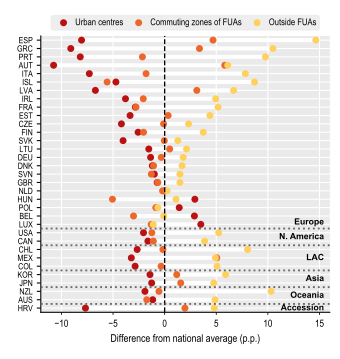
Tighter housing markets also tend to have fewer empty homes, while unoccupied housing often concentrates where demand is weakest. Compared to the national average, unoccupancy rates are 2.9 percentage points (p.p.) lower in urban centres; 0.2 p.p. lower in FUA commuting zones; and 4.6 p.p. higher outside FUAs (Figure 3.3). The average unoccupancy rate across countries is 11% in urban centres, 14% in FUA commuting zones and 19% outside FUAs. While some unoccupied housing is expected as residents move between dwellings, this spatial mismatch limits the extent to which bringing unoccupied dwellings back onto the market can ease pressures in urban centres.
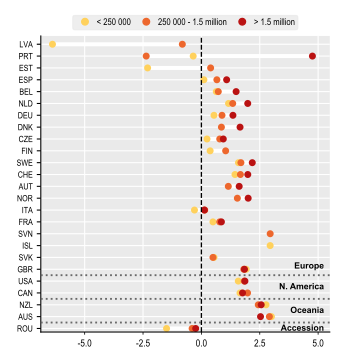
Additional housing supply could help ease price pressures in high-demand areas. However, since 2011, housing supply in large FUAs has expanded least relative to population (Figure 3.4), despite their typically higher initial price levels. Large FUAs accommodated a median of 1.8 additional inhabitants per additional housing unit, compared with 1.2 in mid-sized FUAs and 0.6 in small FUAs. This pattern is consistent across countries: in 17 countries, the largest FUA category has the highest ratio of additional inhabitants per additional housing unit, while Australia is the only country where the largest FUA category has the lowest ratio. The imbalance is particularly pronounced in cities which have seen strong price growth in recent years, including Lisbon and Madrid. At the same time, one quarter of FUAs expanded their housing stock despite population decline, a trend especially visible in several Eastern European countries.