This Annex presents the recommended values for policy analysis derived from the surveys in 2023 USD PPP and 2023 local currency, and also reports their confidence intervals. While confidence intervals are provided for information purposes, the central values presented below are the recommended values for policy analysis.
Economic Valuation of Chemicals‑Related Health Effects
Annex A. Recommended values for policy analysis from the surveys and their confidence intervals
Copy link to Annex A. Recommended values for policy analysis from the surveys and their confidence intervalsTable A.1. Values of a statistical case of hypertension by country (USD and local currency)
Copy link to Table A.1. Values of a statistical case of hypertension by country (USD and local currency)Values are expressed in 2023 USD PPP and 2023 local currency
|
Country |
2023 USD PPP |
2023 Local currency |
|---|---|---|
|
Austria |
45 000 |
EUR 33 000 |
|
Belgium |
35 000 |
EUR 26 000 |
|
Canada |
56 000 |
CAD 66 000 |
|
Finland |
44 000 |
EUR 35 000 |
|
Greece |
85 000 |
EUR 45 000 |
|
Japan |
29 000 |
JPY 2 720 000 |
|
Portugal |
74 000 |
EUR 40 000 |
|
Slovenia |
48 000 |
EUR 27 000 |
|
United Kingdom |
40 000 |
GBP 28 000 |
|
United States |
74 000 |
USD 74 000 |
Source: (Hunt et al., 2026[1])
Table A.2. Values of a statistical case of hypertension with their confidence intervals (USD)
Copy link to Table A.2. Values of a statistical case of hypertension with their confidence intervals (USD)Values are expressed in 2023 USD PPP
|
Country |
Lower |
Mean |
Upper |
|---|---|---|---|
|
Austria |
44 593 |
45 055 |
45 516 |
|
Belgium |
34 525 |
34 811 |
35 096 |
|
Canada |
55 686 |
56 092 |
56 498 |
|
Finland |
43 726 |
44 144 |
44 563 |
|
Greece |
84 706 |
85 447 |
86 188 |
|
Japan |
28 538 |
28 931 |
29 325 |
|
Portugal |
73 864 |
74 421 |
74 978 |
|
Slovenia |
47 659 |
48 053 |
48 447 |
|
United Kingdom |
39 327 |
39 641 |
39 955 |
|
United States |
73 587 |
74 191 |
74 796 |
Note: Confidence intervals were computed using the following formula: , with being the t-critical value for a 95% confidence interval, is the standard deviation of the VSC in the sample, and the number of respondents in the analysis.
Source: (Hunt et al., 2026[1])
Table A.3. Values of a statistical case of infertility by country (USD and local currency)
Copy link to Table A.3. Values of a statistical case of infertility by country (USD and local currency)Values are expressed in 2023 USD PPP and 2023 local currency
|
Country |
2023 USD PPP |
2023 Local currency |
|---|---|---|
|
Australia |
100 000 |
AUD 143 000 |
|
Canada |
102 000 |
CAD 120 000 |
|
Chile |
107 000 |
CLP 45 296 000 |
|
Germany |
89 000 |
EUR 60 000 |
|
Japan |
72 000 |
JPY 6 803 000 |
|
Poland |
85 000 |
PLN 153 000 |
|
Portugal |
122 000 |
EUR 65 000 |
|
Sweden |
102 000 |
SEK 888 000 |
|
United Kingdom |
80 000 |
GBP 57 000 |
|
United States |
105 000 |
USD 105 000 |
Note: values have been updated and converted to 2023 USD PPP and 2023 local currency.
Source: (Dussaux et al., 2023[2])
Table A.4. Values of a statistical case of infertility with their confidence intervals (USD)
Copy link to Table A.4. Values of a statistical case of infertility with their confidence intervals (USD)Values are expressed in 2023 USD PPP
|
Country |
Lower |
Mean |
Upper |
|---|---|---|---|
|
Australia |
99 087 |
100 435 |
101 715 |
|
Canada |
100 377 |
101 867 |
103 246 |
|
Chile |
105 469 |
106 911 |
108 435 |
|
Germany |
87 539 |
88 576 |
89 579 |
|
Japan |
71 448 |
72 352 |
73 225 |
|
Poland |
84 157 |
85 251 |
86 301 |
|
Portugal |
120 230 |
121 839 |
123 532 |
|
Sweden |
100 978 |
102 299 |
103 568 |
|
United Kingdom |
78 735 |
79 669 |
80 630 |
|
United States |
103 480 |
104 930 |
106 300 |
Note: Confidence intervals were computed using the following formula: , with being the t-critical value for a 95% confidence interval, is the standard deviation of the VSC in the sample, and the number of respondents in the analysis.
Source: (Dussaux et al., 2023[2])
Table A.5. Values of a statistical case of underactive thyroid by country (USD and local currency)
Copy link to Table A.5. Values of a statistical case of underactive thyroid by country (USD and local currency)Values are expressed in 2023 USD PPP and in 2023 local currency
|
Country |
USD 2023 PPP |
2023 Local currency |
|---|---|---|
|
Austria |
212 000 |
EUR 156 000 |
|
Canada |
149 000 |
CAD 175 000 |
|
Denmark |
135 000 |
DKK 897 000 |
|
Estonia |
313 000 |
EUR 183 000 |
|
Finland |
191 000 |
EUR 152 000 |
|
Greece |
236 000 |
EUR 124 000 |
|
Japan |
76 000 |
JPY 7 146 000 |
|
Netherlands |
212 000 |
EUR 161 000 |
|
Poland |
209 000 |
PLN 375 000 |
|
Portugal |
276 000 |
EUR 147 000 |
|
United Kingdom |
141 000 |
GBP 101 000 |
|
United States |
159 000 |
USD 159 000 |
Source: (Ahtiainen et al., 2026[3])
Table A.6. Values of a statistical case of underactive thyroid with their confidence intervals (USD)
Copy link to Table A.6. Values of a statistical case of underactive thyroid with their confidence intervals (USD)Values are expressed in 2023 USD PPP
|
Country |
Lower |
Mean |
Upper |
|---|---|---|---|
|
Austria |
195 000 |
212 000 |
228 000 |
|
Canada |
136 000 |
149 000 |
161 000 |
|
Denmark |
123 000 |
135 000 |
147 000 |
|
Estonia |
293 000 |
313 000 |
333 000 |
|
Finland |
176 000 |
191 000 |
205 000 |
|
Greece |
218 000 |
236 000 |
255 000 |
|
Japan |
68 000 |
76 000 |
84 000 |
|
Netherlands |
197 000 |
212 000 |
228 000 |
|
Poland |
194 000 |
209 000 |
226 000 |
|
Portugal |
257 000 |
276 000 |
294 000 |
|
United Kingdom |
129 000 |
141 000 |
154 000 |
|
United States |
146 000 |
159 000 |
173 000 |
Note: Confidence intervals were computed using a bootstrap procedure
Source: (Ahtiainen et al., 2026[3])
Table A.7. Values of a statistical case of asthma by country (USD and local currency)
Copy link to Table A.7. Values of a statistical case of asthma by country (USD and local currency)Values are expressed in 2023 USD PPP and in 2023 local currency
|
Country |
Adult asthma |
Childhood asthma |
||
|---|---|---|---|---|
|
2023 USD PPP |
2023 Local currency |
2023 USD PPP |
2023 Local currency |
|
|
Canada |
265 000 |
CAD 311 000 |
349 000 |
CAD 409 000 |
|
France |
300 000 |
EUR 200 000 |
407 000 |
EUR 271 000 |
|
Poland |
381 000 |
PLN 683 000 |
482 000 |
PLN 865 000 |
|
Sweden |
276 000 |
SEK 2 395 000 |
435 000 |
SEK 3 779 000 |
|
United Kingdom |
195 000 |
GBP 140 000 |
375 000 |
GBP 269 000 |
|
United States |
301 000 |
USD 301 000 |
548 000 |
USD 548 000 |
Note: values have been discounted, updated and converted to 2023 USD PPP and 2023 local currency.
Source: (Appéré et al., 2023[4])
Table A.8. Values of a statistical case of asthma with their confidence intervals (USD)
Copy link to Table A.8. Values of a statistical case of asthma with their confidence intervals (USD)Values are expressed in 2023 USD PPP
|
Country |
Adult asthma |
Childhood asthma |
||||
|---|---|---|---|---|---|---|
|
Lower |
Mean |
Upper |
Lower |
Mean |
Upper |
|
|
Canada |
234 272 |
265 353 |
296 433 |
243 123 |
348 803 |
454 483 |
|
France |
261 838 |
299 632 |
337 427 |
311 925 |
406 827 |
501 729 |
|
Poland |
342 364 |
380 895 |
419 427 |
382 978 |
481 816 |
580 654 |
|
Sweden |
244 034 |
275 969 |
307 903 |
333 960 |
435 486 |
537 012 |
|
United Kingdom |
170 822 |
195 251 |
219 681 |
277 122 |
375 220 |
473 317 |
|
United States |
265 413 |
300 586 |
335 759 |
340 630 |
548 485 |
756 341 |
Note: values have been discounted, updated and converted to 2023 USD PPP. Confidence intervals were computed using the following formula: , with being the t-critical value for a 95% confidence interval, is the standard deviation of the VSC in the sample, and the number of respondents in the analysis.
Source: (Appéré et al., 2023[4])
Table A.9. Willingness-to-pay values over one year for one step reduction in asthma by country (USD and local currency)
Copy link to Table A.9. Willingness-to-pay values over one year for one step reduction in asthma by country (USD and local currency)|
Country |
Adult asthma |
Childhood asthma |
||
|---|---|---|---|---|
|
2023 USD PPP |
2023 Local currency |
2023 USD PPP |
2023 Local currency |
|
|
Canada |
500 |
CAD 580 |
970 |
CAD 1 140 |
|
Czechia |
870 |
CZK 10 750 |
1 370 |
CZK 16 950 |
|
France |
570 |
EUR 380 |
1 020 |
EUR 680 |
|
Poland |
750 |
PLN 1 340 |
1 330 |
PLN 2 390 |
|
Sweden |
560 |
SEK 4 900 |
910 |
SEK 7 860 |
|
United Kingdom |
520 |
GBP 370 |
860 |
GBP 620 |
|
United States |
610 |
USD 610 |
1 370 |
USD 1 370 |
Note: values have been updated and converted to 2023 USD PPP and 2023 local currency.
Source: (Appéré et al., 2023[4])
Table A.10. Willingness-to-pay values over one year for one step reduction in asthma with their confidence intervals (USD)
Copy link to Table A.10. Willingness-to-pay values over one year for one step reduction in asthma with their confidence intervals (USD)Values are expressed in 2023 USD PPP
|
Country |
Adult asthma |
Childhood asthma |
||||
|---|---|---|---|---|---|---|
|
Lower |
Mean |
Upper |
Lower |
Mean |
Upper |
|
|
Canada |
478 |
496 |
515 |
928 |
973 |
1 017 |
|
Czechia |
847 |
870 |
893 |
1 325 |
1 372 |
1 419 |
|
France |
554 |
575 |
596 |
957 |
1 018 |
1 079 |
|
Poland |
723 |
746 |
770 |
1 289 |
1 334 |
1 378 |
|
Sweden |
547 |
564 |
581 |
850 |
906 |
962 |
|
United Kingdom |
499 |
517 |
535 |
827 |
863 |
900 |
|
United States |
593 |
611 |
630 |
1 335 |
1 372 |
1 408 |
Note: values have been converted to 2023 USD PPP. Confidence intervals were computed using the following formula: , with being the t-critical value for a 95% confidence interval, is the standard deviation of the WTP in the sample, and the number of respondents in the analysis.
Source: (Appéré et al., 2023[4])
Table A.11. Values of a statistical case of miscarriage by country (USD and local currency)
Copy link to Table A.11. Values of a statistical case of miscarriage by country (USD and local currency)Values are expressed in 2023 USD PPP and in 2023 local currency
|
Country |
2023 USD PPP |
Local currency |
|---|---|---|
|
Belgium |
310 000 |
EUR 229 000 |
|
Canada |
439 000 |
CAD 514 000 |
|
Denmark |
507 000 |
DKK 3 370 000 |
|
France |
325 000 |
EUR 217 000 |
|
Italy |
579 000 |
EUR 358 000 |
|
Korea |
630 000 |
KRW 539 531 000 |
|
Netherlands |
319 000 |
EUR 242 000 |
|
United Kingdom |
426 000 |
GBP 305 000 |
|
United States |
569 000 |
USD 569 000 |
Note: Values for a statistical case of miscarriage come from a pooled econometric model for all countries except the Netherlands and Korea, where a country‑specific model performed better. Please refer to the working paper for further details.
Source: (Dockins et al., 2026[5])
Table A.12. Values of a statistical case of miscarriage with their confidence intervals (USD)
Copy link to Table A.12. Values of a statistical case of miscarriage with their confidence intervals (USD)Values are expressed in 2023 USD PPP
|
Country |
Lower |
Mean |
Upper |
|---|---|---|---|
|
Belgium |
303 952 |
310 366 |
316 780 |
|
Canada |
430 344 |
438 747 |
447 150 |
|
Denmark |
497 254 |
507 395 |
517 535 |
|
France |
318 965 |
325 235 |
331 505 |
|
Italy |
567 140 |
579 055 |
590 971 |
|
Korea |
620 982 |
630 246 |
639 510 |
|
Netherlands |
313 983 |
318 876 |
323 768 |
|
United Kingdom |
418 002 |
426 036 |
434 070 |
|
United States |
558 510 |
569 018 |
579 526 |
Note: Values for a statistical case of miscarriage come from a pooled econometric model for all countries except the Netherlands and Korea, where a country‑specific model performed better. Please refer to the working paper for further details. Confidence intervals were computed using the following formula: , with being the t-critical value for a 95% confidence interval, is the standard deviation of the VSC in the sample, and the number of respondents in the analysis.
Source: (Dockins et al., 2026[5])
Table A.13. Values of a statistical case of chronic kidney disease by country (USD and local currency)
Copy link to Table A.13. Values of a statistical case of chronic kidney disease by country (USD and local currency)Values are expressed in 2023 USD PPP and in 2023 local currency
|
Country |
2023 USD PPP |
Local currency |
|---|---|---|
|
Canada |
819 000 |
CAD 960 000 |
|
Chile |
1 180 000 |
CLP 499 919 000 |
|
Denmark |
869 000 |
DKK 5 769 000 |
|
Germany |
895 000 |
EUR 611 000 |
|
Italy |
1 316 000 |
EUR 813 000 |
|
Norway |
917 000 |
NOK 8 815 000 |
|
Türkiye |
940 000 |
TRY 5 721 000 |
|
United Kingdom |
671 000 |
GBP 448 000 |
|
United States |
737 000 |
USD 737 000 |
Note: values have been converted to 2023 USD PPP and to 2023 local currency.
Source: (Dockins et al., 2023[6])
Table A.14. Values of a statistical case of chronic kidney disease with their confidence intervals (USD)
Copy link to Table A.14. Values of a statistical case of chronic kidney disease with their confidence intervals (USD)Values are expressed in 2023 USD PPP
|
Country |
Lower |
Mean |
Upper |
|---|---|---|---|
|
Canada |
809 781 |
818 828 |
827 754 |
|
Chile |
1 165 682 |
1 179 956 |
1 194 131 |
|
Denmark |
859 069 |
868 768 |
878 819 |
|
Germany |
886 267 |
895 455 |
904 806 |
|
Italy |
1 300 692 |
1 316 343 |
1 332 005 |
|
Norway |
907 125 |
916 605 |
926 195 |
|
Türkiye |
922 506 |
939 943 |
958 936 |
|
United Kingdom |
664 386 |
671 106 |
677 844 |
|
United States |
728 980 |
737 096 |
745 086 |
Note: values have been converted to 2023 USD PPP.
Source: (Dockins et al., 2023[6])
Table A.15. Values of a statistical case of non-fatal cancer by country (USD and local currency)
Copy link to Table A.15. Values of a statistical case of non-fatal cancer by country (USD and local currency)Values are expressed in 2023 USD PPP and in 2023 local currency
|
Country |
2023 USD PPP |
2023 Local currency |
|---|---|---|
|
Canada |
1 212 000 |
CAD 1 421 000 |
|
Denmark |
870 000 |
DKK 5 778 000 |
|
Estonia |
577 000 |
EUR 338 000 |
|
Japan |
754 000 |
JPY 70 886 000 |
|
Mexico |
559 000 |
MXN 5 212 000 |
|
Norway |
697 000 |
NOK 6 698 000 |
|
Slovenia |
699 000 |
EUR 394 000 |
|
Spain |
1 049 000 |
EUR 615 000 |
|
United Kingdom |
1 146 000 |
GBP 820 000 |
|
United States |
1 266 000 |
USD 1 266 000 |
Note: values have been converted to 2023 USD PPP and 2023 local currency.
Source: (Herrera-Araujo et al., 2026[7])
Table A.16. Values of a statistical case of non-fatal cancer by country and their confidence intervals (USD)
Copy link to Table A.16. Values of a statistical case of non-fatal cancer by country and their confidence intervals (USD)Values are expressed in 2023 USD PPP
|
Country |
Lower |
Mean |
Upper |
|---|---|---|---|
|
Canada |
979 789 |
1 212 041 |
1 444 293 |
|
Denmark |
674 943 |
870 047 |
1 065 151 |
|
Estonia |
433 118 |
576 796 |
720 474 |
|
Japan |
510 615 |
753 873 |
997 131 |
|
Mexico |
349 129 |
559 074 |
769 019 |
|
Norway |
539 070 |
696 515 |
853 960 |
|
Slovenia |
519 211 |
698 625 |
878 039 |
|
Spain |
772 102 |
1 049 005 |
1 325 908 |
|
United Kingdom |
932 241 |
1 146 153 |
1 360 065 |
|
United States |
1 030 488 |
1 266 496 |
1 502 504 |
Note: Confidence intervals were computed using the following formula: , with being the t-critical value for a 95% confidence interval, is the standard deviation of the VSC in the sample, and the number of respondents in the analysis.
Source: (Herrera-Araujo et al., 2026[7])
Table A.17. Values of a statistical case of very low birth weight by country (USD and local currency)
Copy link to Table A.17. Values of a statistical case of very low birth weight by country (USD and local currency)Values are expressed in 2023 USD PPP and in 2023 local currency
|
Country |
2023 USD PPP |
Local currency |
|---|---|---|
|
Canada |
990 000 |
CAD 1 161 000 |
|
Czechia |
1 212 000 |
CZK 14 973 000 |
|
Italy |
2 086 000 |
EUR 1 289 000 |
|
Mexico |
1 635 000 |
MXN 15 247 000 |
|
Netherlands |
1 136 000 |
EUR 864 000 |
|
Switzerland |
1 342 000 |
CHF 1 496 000 |
|
Türkiye |
572 000 |
TRY 3 481 000 |
|
United Kingdom |
898 000 |
GBP 642 000 |
|
United States |
1 447 000 |
USD 1 447 000 |
Table A.18. Values of a statistical case of very low birth weight with their confidence intervals (USD)
Copy link to Table A.18. Values of a statistical case of very low birth weight with their confidence intervals (USD)Values are expressed in 2023 USD PPP
|
Country |
Lower |
Mean |
Upper |
|---|---|---|---|
|
Canada |
984 174 |
989 655 |
995 136 |
|
Czechia |
1 205 027 |
1 211 708 |
1 218 389 |
|
Italy |
2 073 972 |
2 085 819 |
2 097 667 |
|
Mexico |
1 625 704 |
1 635 326 |
1 644 948 |
|
Netherlands |
1 129 749 |
1 136 345 |
1 142 941 |
|
Switzerland |
1 334 443 |
1 342 056 |
1 349 669 |
|
Türkiye |
568 226 |
571 868 |
575 511 |
|
United Kingdom |
892 681 |
897 586 |
902 490 |
|
United States |
1 438 281 |
1 446 768 |
1 455 256 |
Note: Confidence intervals were computed using the following formula: , with being the t-critical value for a 95% confidence interval, is the standard deviation of the VSC in the sample, and the number of respondents in the analysis.
Table A.19. Willingness-to-pay values over one year to avoid 1 IQ point loss by country (USD and local currency)
Copy link to Table A.19. Willingness-to-pay values over one year to avoid 1 IQ point loss by country (USD and local currency)Values are expressed in 2023 USD PPP and in 2023 local currency
|
Country |
2023 USD PPP |
Local currency |
|---|---|---|
|
Australia |
419 |
AUD 598 |
|
Canada |
1 010 |
CAD 1 184 |
|
Denmark |
619 |
DKK 4 112 |
|
Korea |
830 |
KRW 710 678 |
|
Netherlands |
749 |
EUR 569 |
|
Poland |
988 |
PLN 1 773 |
|
Portugal |
595 |
EUR 317 |
|
South Africa |
383 |
ZAR 2 800 |
|
Sweden |
684 |
SEK 5 938 |
|
United Kingdom |
365 |
GBP 261 |
|
United States |
686 |
USD 686 |
Note: values have been converted to 2023 USD PPP and to 2023 local currency.
Source: (Mourato et al., 2023[9])
Table A.20. Willingness-to-pay values over one year to avoid 1 IQ point loss with their confidence intervals (USD)
Copy link to Table A.20. Willingness-to-pay values over one year to avoid 1 IQ point loss with their confidence intervals (USD)Values are expressed in 2023 USD PPP
|
Country |
Lower |
Mean |
Upper |
|---|---|---|---|
|
Australia |
411 |
419 |
427 |
|
Canada |
991 |
1 010 |
1 029 |
|
Denmark |
608 |
619 |
630 |
|
Korea |
817 |
830 |
844 |
|
Netherlands |
736 |
749 |
761 |
|
Poland |
972 |
988 |
1 004 |
|
Portugal |
585 |
595 |
606 |
|
South Africa |
376 |
383 |
390 |
|
Sweden |
672 |
684 |
697 |
|
United Kingdom |
359 |
365 |
372 |
|
United States |
675 |
686 |
698 |
Note: Confidence intervals were computed using the following formula: , with being the t-critical value for a 95% confidence interval, is the standard deviation of the WTP in the sample, and the number of respondents in the analysis.
Source: (Mourato et al., 2023[9])
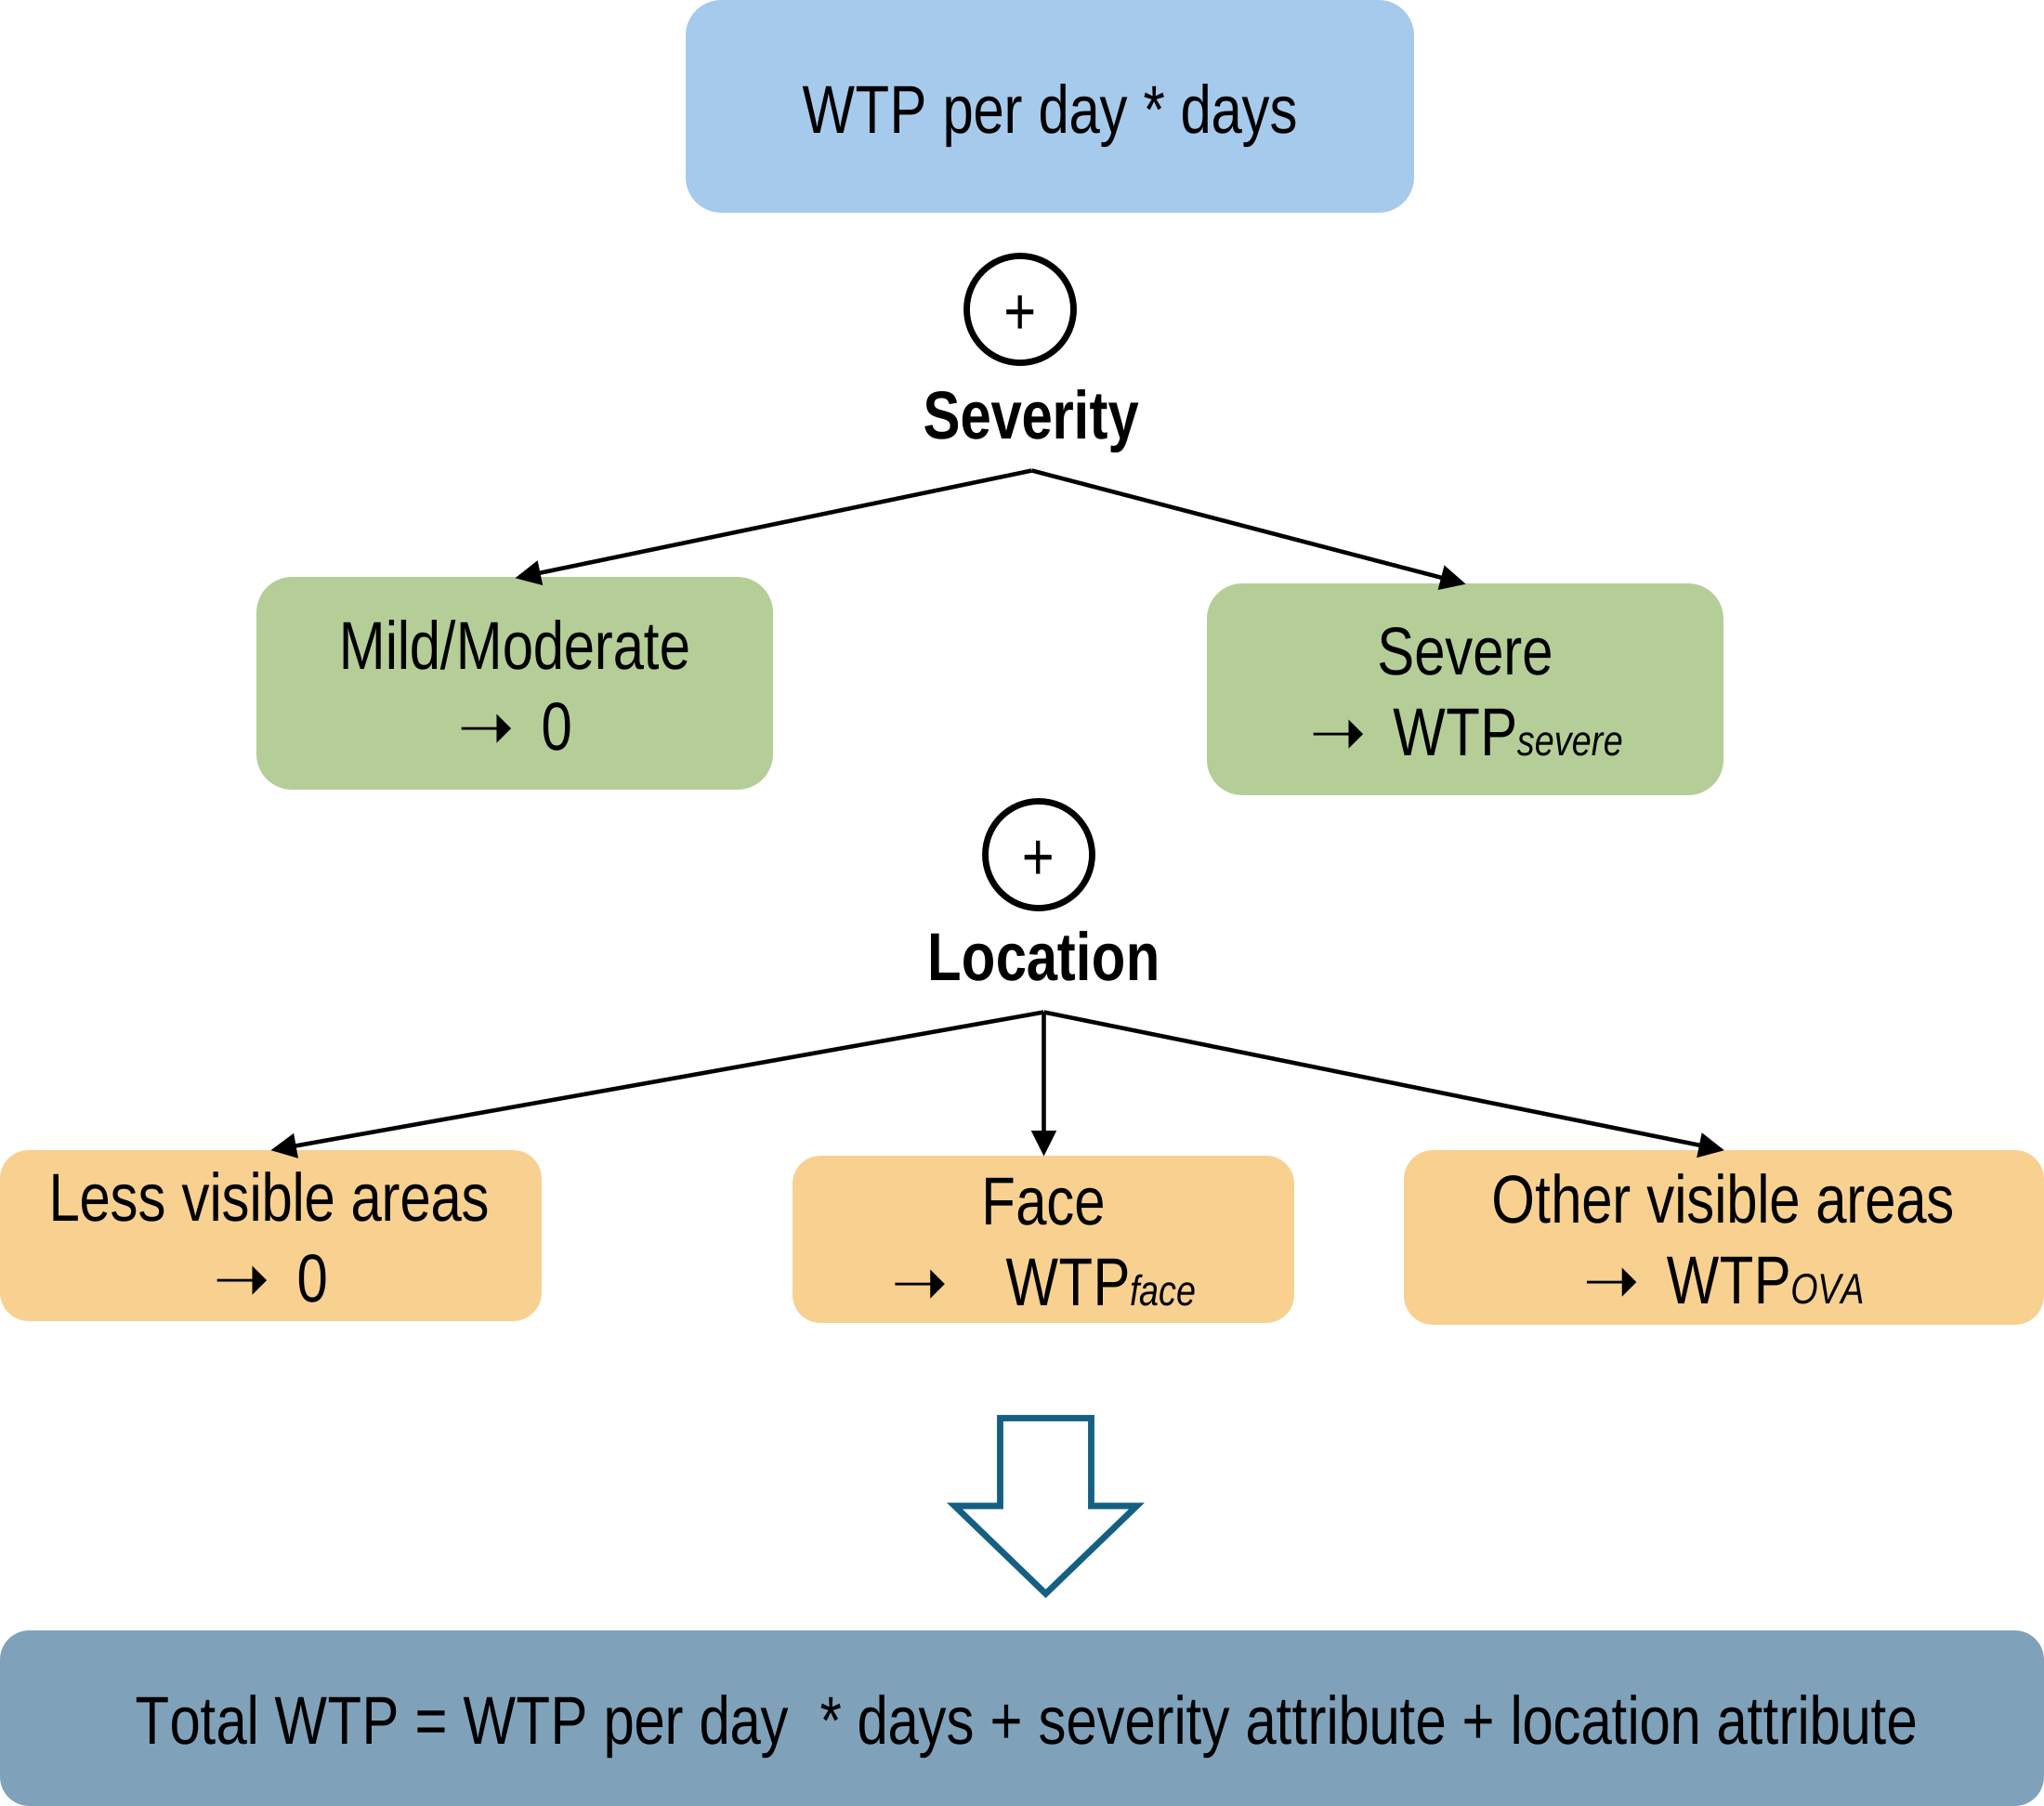
Figure A.1. Scenario-specific estimates for skin sensitisation
Copy link to Figure A.1. Scenario-specific estimates for skin sensitisationNote: Scenario-specific estimates are constructed by aggregating attribute-level WTP/VSC estimates. For the sensitised sample, WTP estimates should be used, whereas for the non-sensitised sample, VSC estimates should be applied. The WTP/VSC to avoid one additional day of flare-up is multiplied by the total number of days considered. The severity and location attributes are added once per scenario. For scenarios with mild or moderate severity, no additional WTP/VSC is applied. Likewise, no additional WTP/VSC is added when the affected areas are less visible. The attribute-level WTP/VSC estimates – including the WTP/VSC to avoid one additional day of flare-up, the WTP/VSC to avoid a severe case, the WTP/VSC to avoid a case visible on the face, and the WTP/VSC to avoid a case affecting other visible areas – are reported below for the sensitised and non-sensitised samples across the nine surveyed countries.
Source: Authors’ own elaboration based on (Contu et al., 2026[10])
Table A.21. Willingness to pay estimates over one year to avoid skin sensitisation attribute among the sensitised sample by country (USD and local currency)
Copy link to Table A.21. Willingness to pay estimates over one year to avoid skin sensitisation attribute among the sensitised sample by country (USD and local currency)Values are expressed in 2023 USD PPP and in 2023 local currency
|
Country |
WTP to avoid one extra day of flare-up |
Severity attribute |
Visible on the face attribute |
Visible in other areas attribute |
||||
|---|---|---|---|---|---|---|---|---|
|
USD PPP |
Local currency |
USD PPP |
Local currency |
USD PPP |
Local currency |
USD PPP |
Local currency |
|
|
Canada |
1.4 |
1.6 |
0 |
0 |
66.3 |
77.8 |
16.6 |
19.4 |
|
Denmark |
1.3 |
8.8 |
0 |
0 |
65.1 |
432.5 |
16.6 |
110.1 |
|
Japan |
1.6 |
150.1 |
40.1 |
3768.1 |
69.5 |
6538.9 |
16.4 |
1545.3 |
|
Netherlands |
1.3 |
1 |
24.0 |
18.2 |
67.1 |
51.0 |
16.5 |
12.6 |
|
Poland |
1.2 |
2.2 |
19.0 |
34.0 |
64.6 |
115.9 |
16.6 |
29.7 |
|
Spain |
1.3 |
0.7 |
23.2 |
13.6 |
64.3 |
37.7 |
16.7 |
9.8 |
|
Switzerland |
1.2 |
1.4 |
28.8 |
32.1 |
67.5 |
75.2 |
16.6 |
18.5 |
|
United Kingdom |
1.3 |
0.9 |
20.4 |
14.6 |
66.3 |
47.4 |
16.6 |
11.9 |
|
United States |
1.3 |
1.3 |
20.5 |
20.5 |
69.3 |
69.3 |
16.5 |
16.5 |
Source: (Contu et al., 2026[10])
Table A.22. Willingness to pay estimates over one year to avoid skin sensitisation attribute among the sensitised sample by country with their confidence intervals (USD)
Copy link to Table A.22. Willingness to pay estimates over one year to avoid skin sensitisation attribute among the sensitised sample by country with their confidence intervals (USD)Values are expressed in 2023 USD PPP
|
Country |
WTP to avoid one extra day of flare-up |
Severity attribute |
Visible on the face attribute |
Visible in other areas attribute |
||||||||
|---|---|---|---|---|---|---|---|---|---|---|---|---|
|
Lower |
Mean |
Upper |
Lower |
Mean |
Upper |
Lower |
Mean |
Upper |
Lower |
Mean |
Upper |
|
|
Canada |
1.0 |
1.4 |
1.7 |
0 |
0 |
0 |
61.7 |
66.3 |
71.0 |
16.5 |
16.6 |
16.7 |
|
Denmark |
1.0 |
1.3 |
1.6 |
0 |
0 |
0 |
60.5 |
65.1 |
69.7 |
16.5 |
16.6 |
16.7 |
|
Japan |
1.3 |
1.6 |
1.9 |
26.8 |
40.1 |
53.4 |
64.5 |
69.5 |
74.6 |
16.3 |
16.4 |
16.5 |
|
Netherlands |
1.1 |
1.3 |
1.6 |
15.2 |
24.0 |
32.8 |
62.8 |
67.1 |
71.5 |
16.4 |
16.5 |
16.6 |
|
Poland |
0.9 |
1.2 |
1.6 |
8.0 |
19.0 |
29.9 |
59.7 |
64.6 |
69.5 |
16.5 |
16.6 |
16.7 |
|
Spain |
1.0 |
1.3 |
1.6 |
12.2 |
23.2 |
34.3 |
59.5 |
64.3 |
69.2 |
16.6 |
16.7 |
16.8 |
|
Switzerland |
0.9 |
1.2 |
1.5 |
17.3 |
28.8 |
40.2 |
63.4 |
67.5 |
71.7 |
16.5 |
16.6 |
16.7 |
|
United Kingdom |
1.0 |
1.3 |
1.7 |
9.2 |
20.4 |
31.7 |
61.2 |
66.3 |
71.4 |
16.5 |
16.6 |
16.7 |
|
United States |
1.0 |
1.3 |
1.6 |
7.8 |
20.5 |
33.2 |
64.7 |
69.3 |
74.0 |
16.4 |
16.5 |
16.6 |
Note: Confidence intervals were computed using the following formula: , with being the t-critical value for a 95% confidence interval, is the standard deviation of the WTP in the sample, and the number of respondents in the analysis.
Source: (Contu et al., 2026[10])
Table A.23. Values of a statistical case of skin sensitisation attribute among the non-sensitised sample by country (USD and local currency)
Copy link to Table A.23. Values of a statistical case of skin sensitisation attribute among the non-sensitised sample by country (USD and local currency)Values are expressed in 2023 USD PPP and in 2023 local currency
|
Country |
VSC to avoid one extra day of flare-up |
Severity attribute |
Visible on the face attribute |
Visible in other areas attribute |
||||
|---|---|---|---|---|---|---|---|---|
|
USD PPP |
Local currency |
USD PPP |
Local currency |
USD PPP |
Local currency |
USD PPP |
Local currency |
|
|
Canada |
89 |
105 |
729 |
855 |
2 832 |
3 321 |
1 604 |
1 881 |
|
Denmark |
89 |
589 |
847 |
5 625 |
2 430 |
16 140 |
1 599 |
10 621 |
|
Japan |
86 |
8 092 |
774 |
72 798 |
2 736 |
257 244 |
1 615 |
151 811 |
|
Netherlands |
101 |
77 |
920 |
699 |
2 789 |
2 120 |
1 629 |
1 238 |
|
Poland |
82 |
147 |
577 |
1 035 |
2 700 |
4 844 |
1 587 |
2 848 |
|
Spain |
91 |
53 |
928 |
544 |
2 536 |
1 486 |
1 552 |
909 |
|
Switzerland |
89 |
99 |
815 |
908 |
2 725 |
3 037 |
1 547 |
1 725 |
|
United Kingdom |
91 |
65 |
859 |
615 |
2 784 |
1 992 |
1 660 |
1 188 |
|
United States |
88 |
88 |
686 |
686 |
2 529 |
2 529 |
1 646 |
1 646 |
Source: (Contu et al., 2026[10])
Table A.24. Values of a statistical case of skin sensitisation attribute among the non-sensitised sample by country with their confidence intervals (USD)
Copy link to Table A.24. Values of a statistical case of skin sensitisation attribute among the non-sensitised sample by country with their confidence intervals (USD)Values are expressed in 2023 USD PPP
|
Country |
VSC to avoid one extra day of flare-up |
Severity attribute |
Visible on the face attribute |
Visible in other areas attribute |
||||||||
|---|---|---|---|---|---|---|---|---|---|---|---|---|
|
Lower |
Mean |
Upper |
Lower |
Mean |
Upper |
Lower |
Mean |
Upper |
Lower |
Mean |
Upper |
|
|
Canada |
84 |
89 |
95 |
538 |
729 |
919 |
2 638 |
2 832 |
3 026 |
1 524 |
1 604 |
1 684 |
|
Denmark |
82 |
89 |
95 |
640 |
847 |
1 054 |
2 186 |
2 430 |
2 675 |
1 507 |
1 599 |
1 692 |
|
Japan |
80 |
86 |
92 |
556 |
774 |
993 |
2 520 |
2 736 |
2 952 |
1 533 |
1 615 |
1 696 |
|
Netherlands |
96 |
101 |
106 |
726 |
920 |
1 113 |
2 591 |
2 789 |
2 988 |
1 549 |
1 629 |
1 708 |
|
Poland |
75 |
82 |
88 |
369 |
577 |
785 |
2 504 |
2 700 |
2 896 |
1 511 |
1 587 |
1 664 |
|
Spain |
84 |
91 |
98 |
694 |
928 |
1 162 |
2 301 |
2 536 |
2 770 |
1 454 |
1 552 |
1 649 |
|
Switzerland |
82 |
89 |
96 |
589 |
815 |
1 040 |
2 488 |
2 725 |
2 961 |
1 458 |
1 547 |
1 637 |
|
United Kingdom |
85 |
91 |
97 |
646 |
859 |
1 071 |
2 557 |
2 784 |
3 010 |
1 579 |
1 660 |
1 742 |
|
United States |
81 |
88 |
94 |
454 |
686 |
918 |
2 305 |
2 529 |
2 753 |
1 556 |
1 646 |
1 736 |
Note: Confidence intervals were computed using the following formula: , with being the t-critical value for a 95% confidence interval, is the standard deviation of the VSC in the sample, and the number of respondents in the analysis.
Source: (Contu et al., 2026[10])
References
[3] Ahtiainen, H. et al. (2026), “Valuing a reduction in the risk of an underactive thyroid: A large-scale multi-country stated preference approach”, OECD Environment Working Papers, No. 272, OECD Publishing, Paris, https://doi.org/10.1787/4af8f3aa-en.
[4] Appéré, G. et al. (2023), “Valuing a reduction in the risk and severity of asthma: A large scale multi-country stated preference approach”, OECD Environment Working Papers, No. 218, OECD Publishing, Paris, https://doi.org/10.1787/f289d29e-en.
[10] Contu, D. et al. (2026), “Valuing a reduction in the risk of skin sensitisation: A large-scale multi-country stated preference approach”, OECD Environment Working Papers, No. 277, OECD Publishing, Paris, https://doi.org/10.1787/fc305de9-en.
[5] Dockins, C. et al. (2026), “Valuing a reduction in the risk of miscarriage: A large-scale multi-country stated preference approach”, OECD Environment Working Papers, No. 271, OECD Publishing, Paris, https://doi.org/10.1787/23bb6643-en.
[6] Dockins, C. et al. (2023), “Valuing a reduction in the risk of chronic kidney disease: A large scale multi-country stated preference approach”, OECD Environment Working Papers, No. 216, OECD Publishing, Paris, https://doi.org/10.1787/9c93138f-en.
[2] Dussaux, D. et al. (2023), “Valuing a reduction in the risk of infertility: A large scale multi-country stated preference approach”, OECD Environment Working Papers, No. 215, OECD Publishing, Paris, https://doi.org/10.1787/7242509f-en.
[7] Herrera-Araujo, D. et al. (2026), “Valuing a reduction in the risk of non-fatal cancer: A large-scale multi-country stated preference approach”, OECD Environment Working Papers, No. 274, OECD Publishing, Paris, https://doi.org/10.1787/0345660e-en.
[1] Hunt, A. et al. (2026), “Valuing a reduction in the risk of hypertension: A large-scale multi-country stated preference approach”, OECD Environment Working Papers, No. 270, OECD Publishing, Paris, https://doi.org/10.1787/9da8057a-en.
[9] Mourato, S. et al. (2023), “Valuing the avoidance of IQ losses in children: A large scale multi-country stated preference approach”, OECD Environment Working Papers, No. 219, OECD Publishing, Paris, https://doi.org/10.1787/71574eb4-en.
[8] Ščasný, M., I. Zvěřinová and D. Dussaux (2023), “Valuing a reduction in the risk of very low birth weight: A large scale multi-country stated preference approach”, OECD Environment Working Papers, No. 217, OECD Publishing, Paris, https://doi.org/10.1787/dfd159a1-en.