The SWACHE values were derived from surveys focusing on chemicals-related health effects implemented in several study countries. While these values are primarily intended for use in the surveyed countries and in the context of chemicals exposure, they can also be applied to other countries and contexts. This chapter presents the results of a benefit transfer analysis that applies the SWACHE values outside of the surveyed countries. The chapter also discusses the applicability of the study results to other conditions that yield the same effects on human health.
Economic Valuation of Chemicals‑Related Health Effects
A Practical Guide to Quantifying Morbidity Effects in Environmental Cost-Benefit Analysis

Abstract
5.1.1. Results of the benefit transfer analysis
The Surveys on Willingness-to-pay to Avoid negative Chemicals-related Health Effects (SWACHE) project, with its harmonised approaches and coverage of numerous countries and health endpoints, offers a unique basis for applying benefit transfer methodologies to provide willingness-to-pay (WTP) and value of a statistical case (VSC) estimates for non-surveyed countries.
Benefit transfer (BT) approaches are often used when benefit estimates are needed for decision-making, but time or budget constraints prevent conducting primary valuation studies. Like primary estimates, transferred values can be integrated into cost-benefit analyses (CBAs) and other economic assessments. However, while BT saves resources, its accuracy is generally lower than that of primary valuation studies.
This section displays the results of a BT analysis which used SWACHE values to estimate the benefits to reduce or avoid the risk of morbidity of ten different health effects. Depending on available data, WTP and VSC values can be transferred using different approaches, ranging from a simple unadjusted unit value transfer (i.e. using a surveyed country value directly in a non-surveyed country) to complex function-based approaches. For eight endpoints covered in the first two rounds of SWACHE, a benefit transfer function was applied to derive values for non-surveyed countries. The exceptions are skin sensitisation and asthma risk, for which an income-adjusted direct transfer of benefits was used (OECD, 2026[1]).
A benefit function transfer involves transferring the VSC/WTP estimates from one or several surveyed countries to a non-surveyed country, based on demographic information from the surveys and from official national statistics.1 As illustrated in Figure 5.1, the selected transfer function for the SWACHE project incorporates respondent characteristics on how the WTP is impacted by gender, age, household income, and level of education and then uses the estimated equations together with population level information of the same characteristics to estimate a transferred benefit for countries not included in the original surveys. Therefore, the benefit transfer function accounts for the socio-demographic characteristics of non-surveyed countries when transferring WTP estimates.
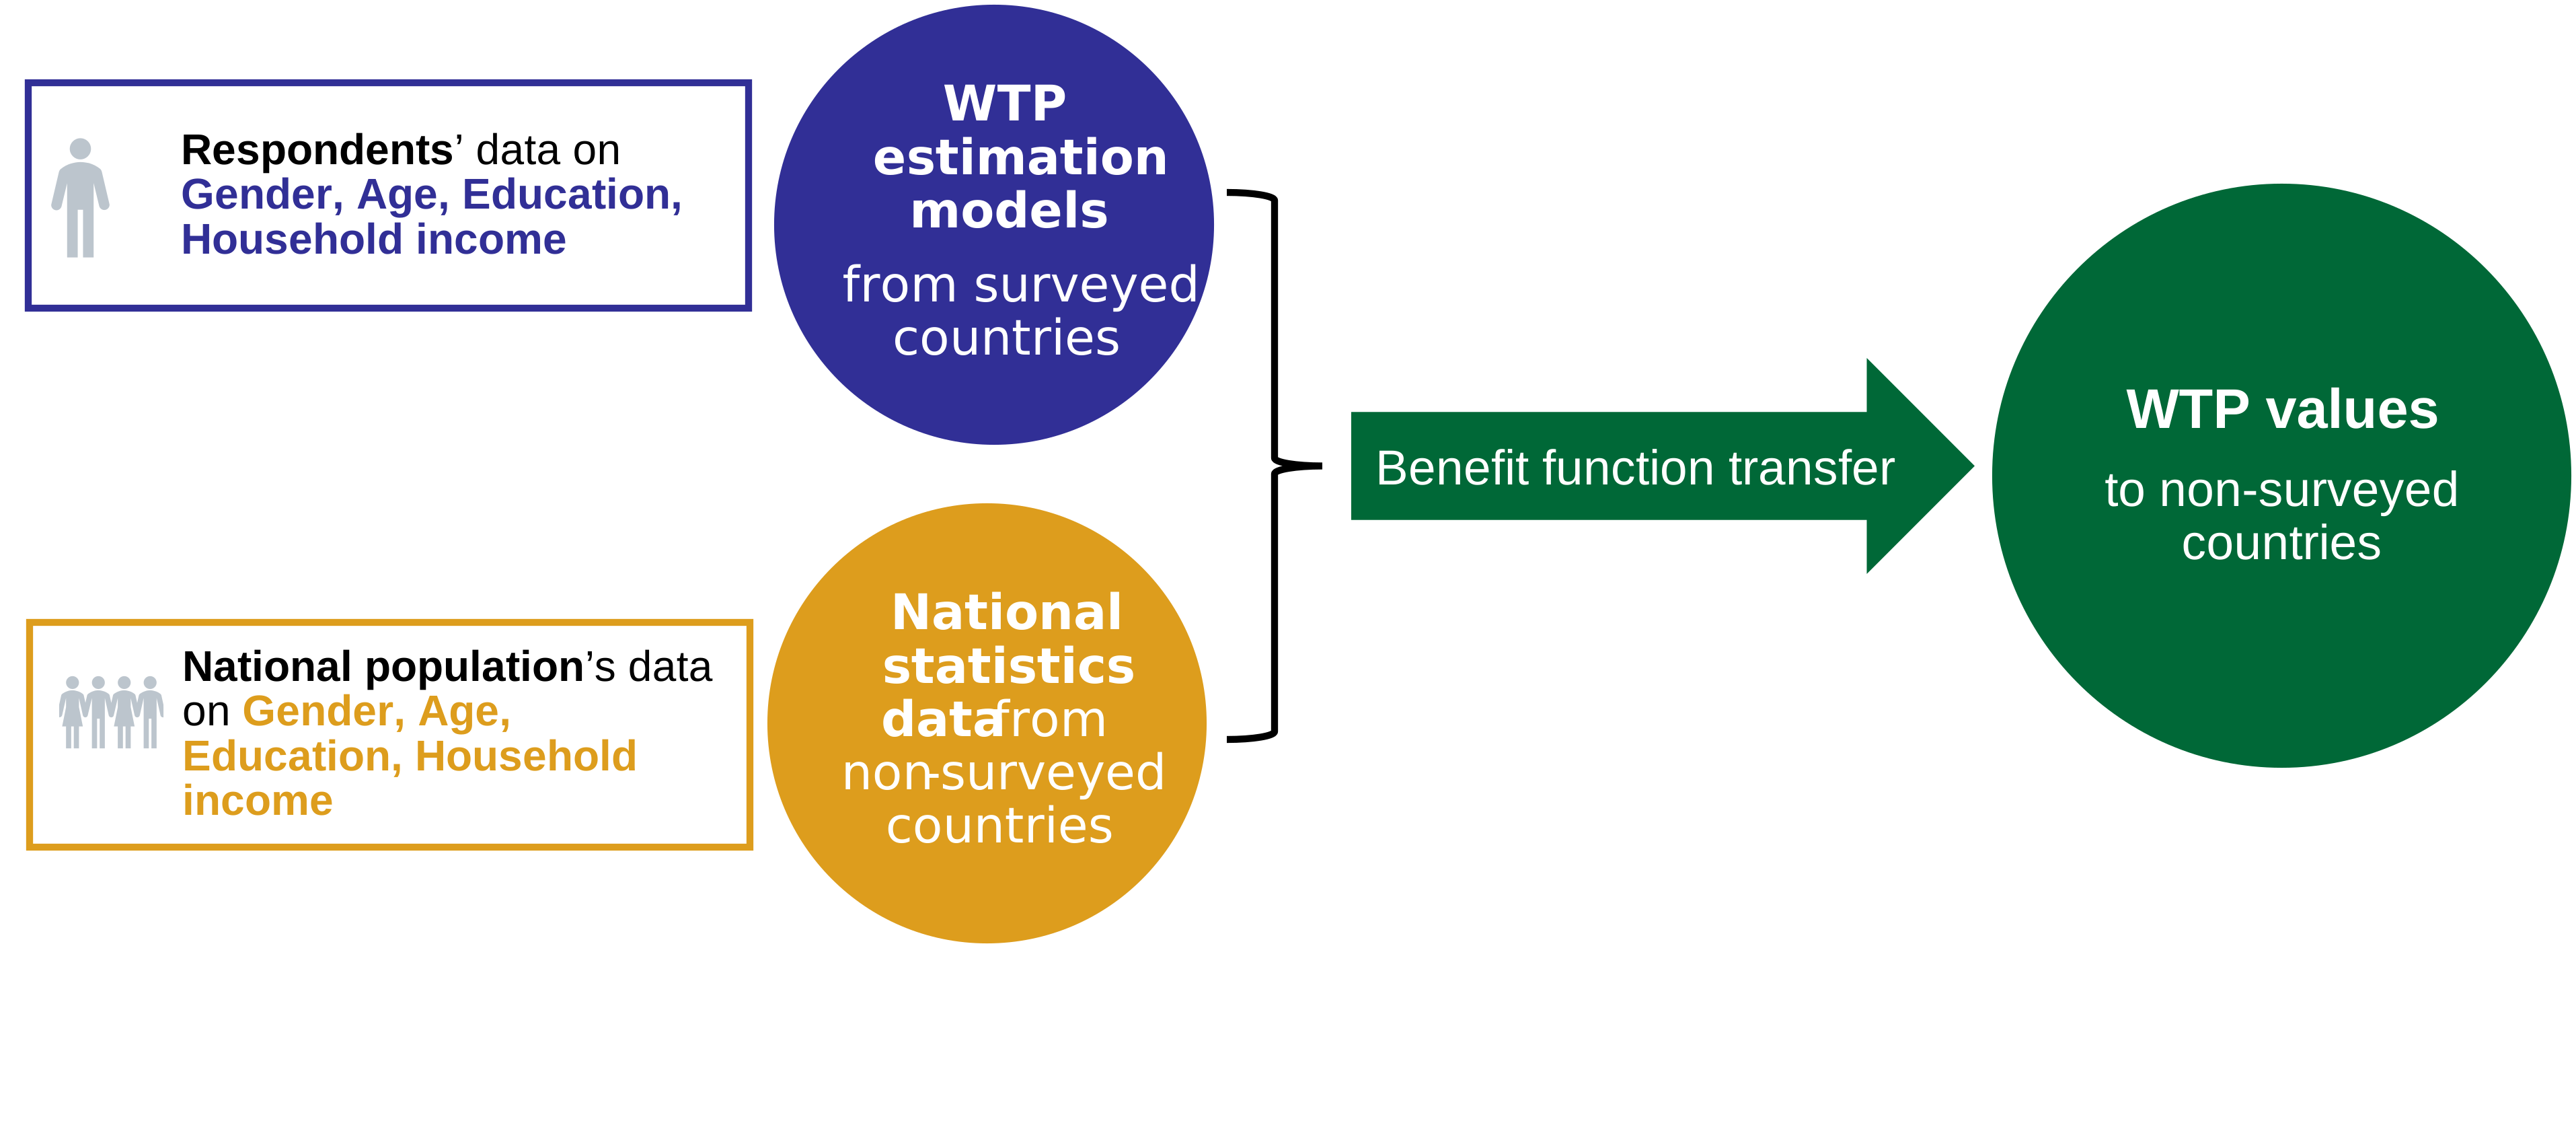
Source: Authors’ own elaboration.
Population statistics for countries to which the values were transferred were carefully curated to match the relevant survey samples as closely as possible. Table 5.1 summarises the targeted populations in the surveyed countries for each health endpoint, along with the corresponding transferred populations in the non-surveyed countries.
Note: See working papers for more details about sampling strategies (Appéré et al., 2023[2]; Contu et al., 2026[3]; Dockins et al., 2023[4]; Dussaux et al., 2023[5]; Herrera-Araujo et al., 2026[6]; Hunt et al., 2026[7]; Mourato et al., 2023[8]; Ščasný, Zvěřinová and Dussaux, 2023[9]; Ahtiainen et al., 2026[10]; Dockins et al., 2026[11]).
1. This adjustment relies on two strong assumptions. First, it assumes that the surveyed sample – of e.g. individuals with asthma – is representative of the targeted population within each surveyed country, an assumption that cannot be verified due to a lack of available data. Second, it assumes that the adjustment factor derived from surveyed countries is also applicable to non-surveyed countries, which may not hold if countries differ significantly. Ideally, external data on the socio-demographic characteristics of the targeted population would be used directly to obtain benefit transfer WTP tailored to each non-surveyed country. However, in the absence of such data for the target population in each country, the adjustment factor provides an approximation.
For the IQ loss, hypertension, and underactive thyroid studies, the targeted sample in the surveyed countries is the total population, which matches the population for which values are being transferred in non-surveyed countries. Figure 5.1, Figure 5.2, Figure 5.3, and Figure 5.4 present, for each of these health effects, the values for the 38 OECD Member countries and South Africa. In these figures, the orange bars indicate that a country was not surveyed and therefore display values derived from the BT analysis. The blue bars indicate that the country was surveyed and refer to the WTP/VSC estimates derived from the survey collection and analysis, which were already presented in Chapter 2. These values represent mean WTP/VSC estimates. The corresponding medians can be found in (OECD, 2026[1]), which also includes a detailed discussion and testing of alternative methods for the benefit transfer of SWACHE values from surveyed to non-surveyed countries. All values have been converted from working papers and are expressed in 2023 USD PPP.
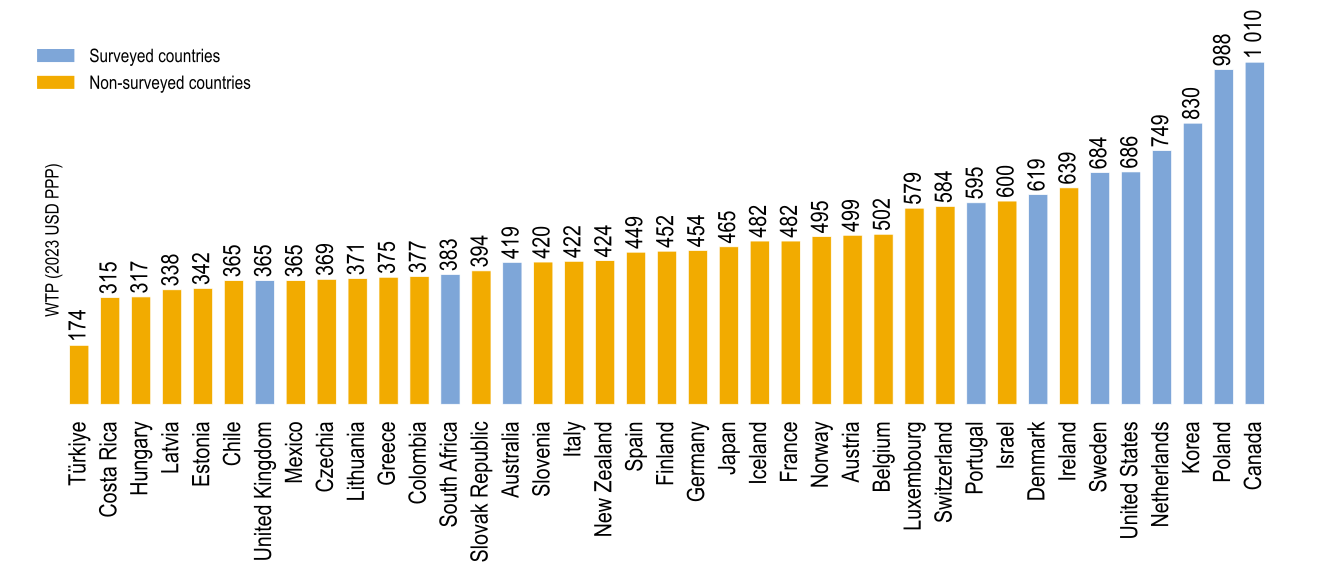
Note: WTP per year over five years. The values for the countries shown in orange were estimated through a benefit transfer function, controlling for countries’ socio‑demographic composition (age, gender, education, and household income). The values for the countries shown in blue are taken from the IQ loss in children working paper, converted in this report to USD 2023 PPP, and presented in Figure 2.11 of Chapter 2.
Source: (Mourato et al., 2023[8]; OECD, 2026[1]).
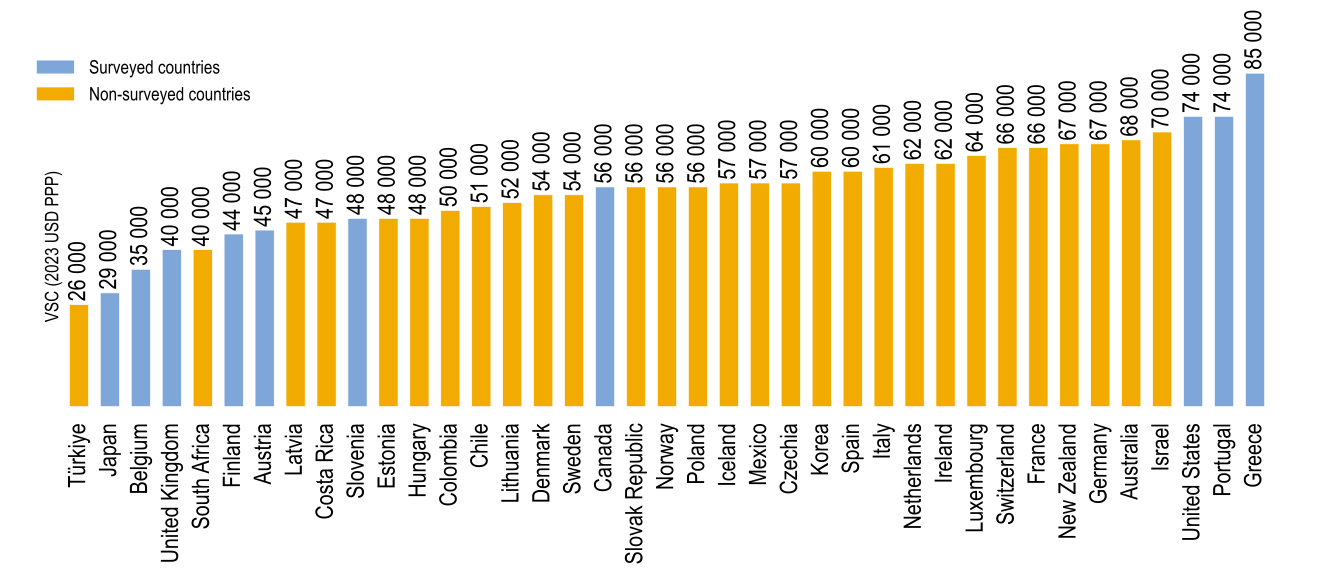
Note: The values for the countries shown in orange were estimated through a benefit transfer function, controlling for countries’ socio‑demographic composition (age, gender, education, and household income). The values for the countries shown in blue are taken from the hypertension working paper, discounted and converted in this report to USD 2023 PPP, and presented in Figure 2.2 of Chapter 2.
Source: (Hunt et al., 2026[7]; OECD, 2026[1]).
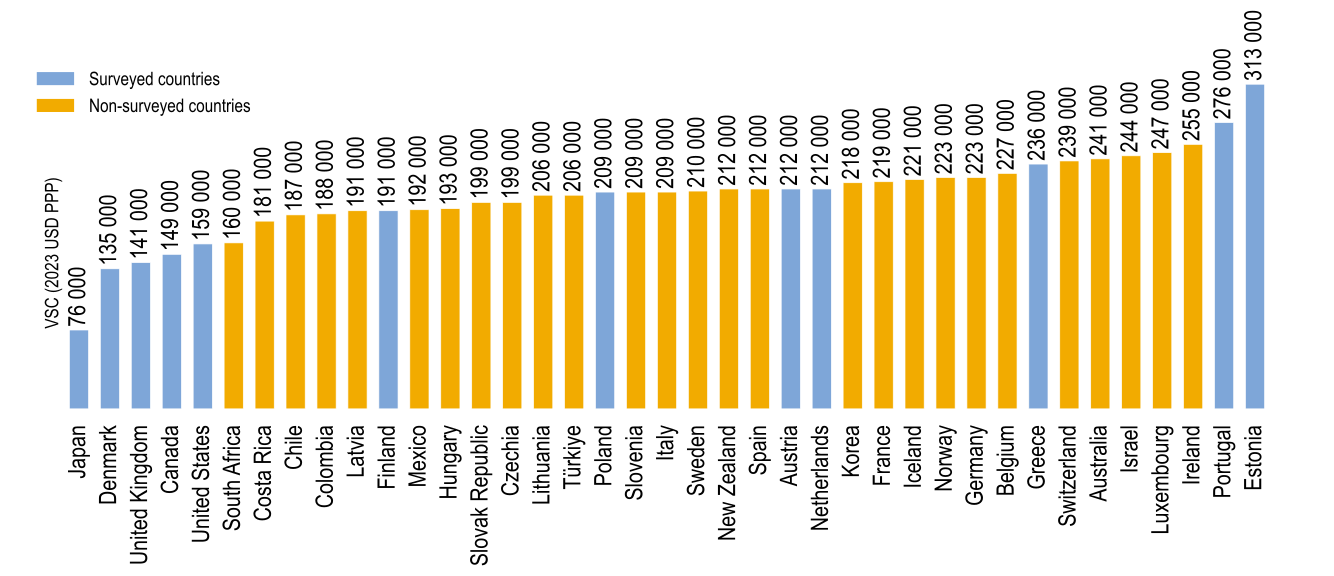
Note: the values for the countries shown in orange were estimated through a benefit transfer function, controlling for countries’ socio‑demographic composition (age, gender, education, and household income). The values for the countries shown in blue are taken from the underactive working paper and presented in Figure 2.4 of Chapter 2.
For the other health endpoints, the population for which values are being transferred in the non‑surveyed countries did not exactly match the survey samples but were aligned as closely as possible. Figure 5.5, Figure 5.6, Figure 5.7, Figure 5.8, Figure 5.9, Figure 5.10 and Figure 5.11, present respectively the recommended values for non‑fatal cancer, chronic kidney disease, asthma severity in adults and children, infertility, very low birth weight and miscarriage endpoints.
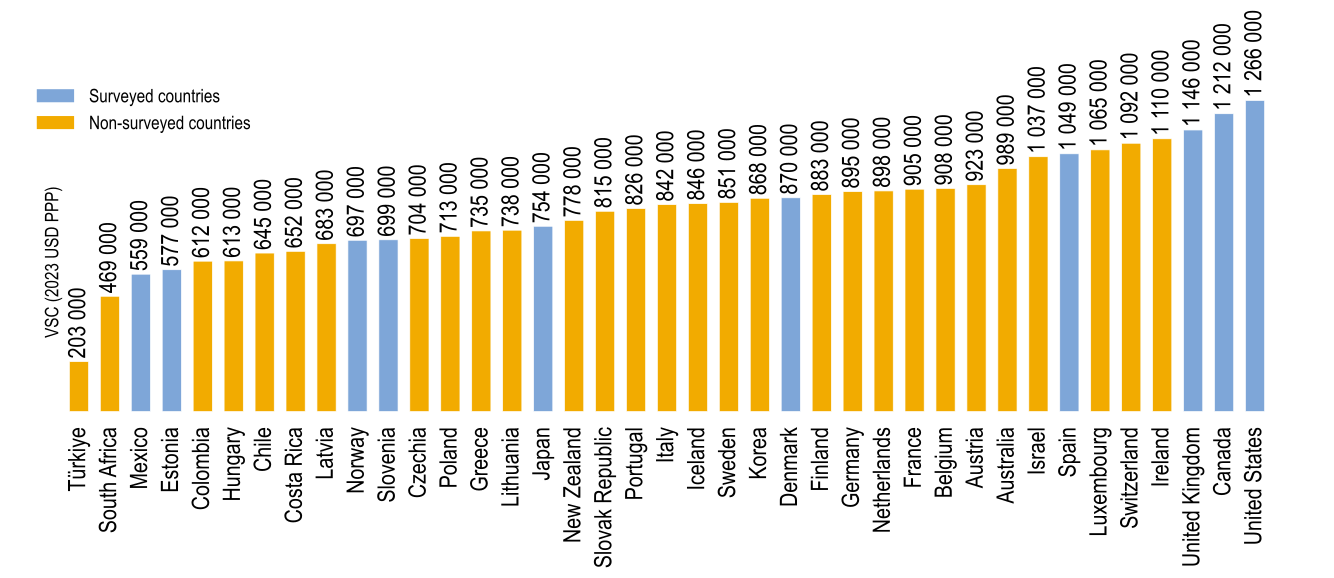
Note: the values for the countries shown in orange were estimated through a benefit transfer function, controlling for countries’ socio‑demographic composition (age, gender, education, and household income). The values for the countries shown in blue are taken from the non-fatal cancer working paper presented in Figure 2.8 of Chapter 2.
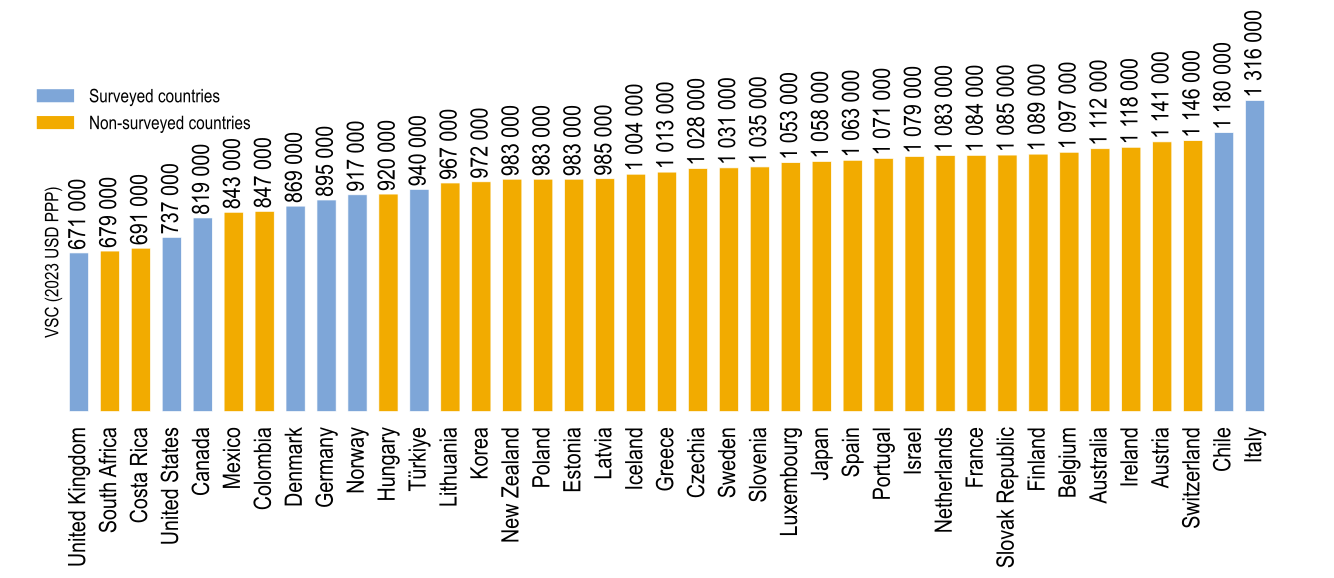
Note: The values for the countries shown in orange were estimated through a benefit transfer function, controlling for countries’ socio‑demographic composition (age, gender, education, and household income). The values for the countries shown in blue are taken from the chronic kidney disease working paper, converted in this report to USD 2023 PPP, and presented in Figure 2.9 of Chapter 2.
Source: (Dockins et al., 2023[4]; OECD, 2026[1]).
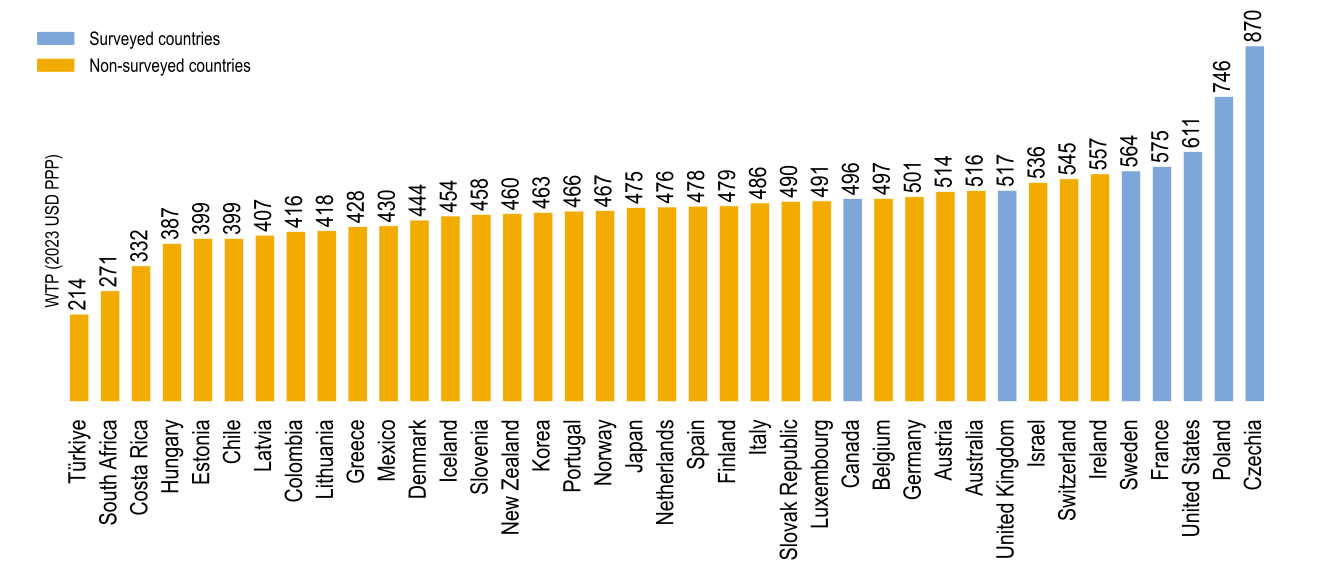
Note: WTP per year over ten years. The values for the countries shown in orange were estimated through a benefit transfer function, controlling for countries’ socio‑demographic composition (age, gender, education, and household income). The values for the countries shown in blue are taken from the asthma working paper, converted in this report to USD 2023 PPP, and presented in Figure 2.6 of Chapter 2.
Source: (Appéré et al., 2023[2]; OECD, 2026[1]).
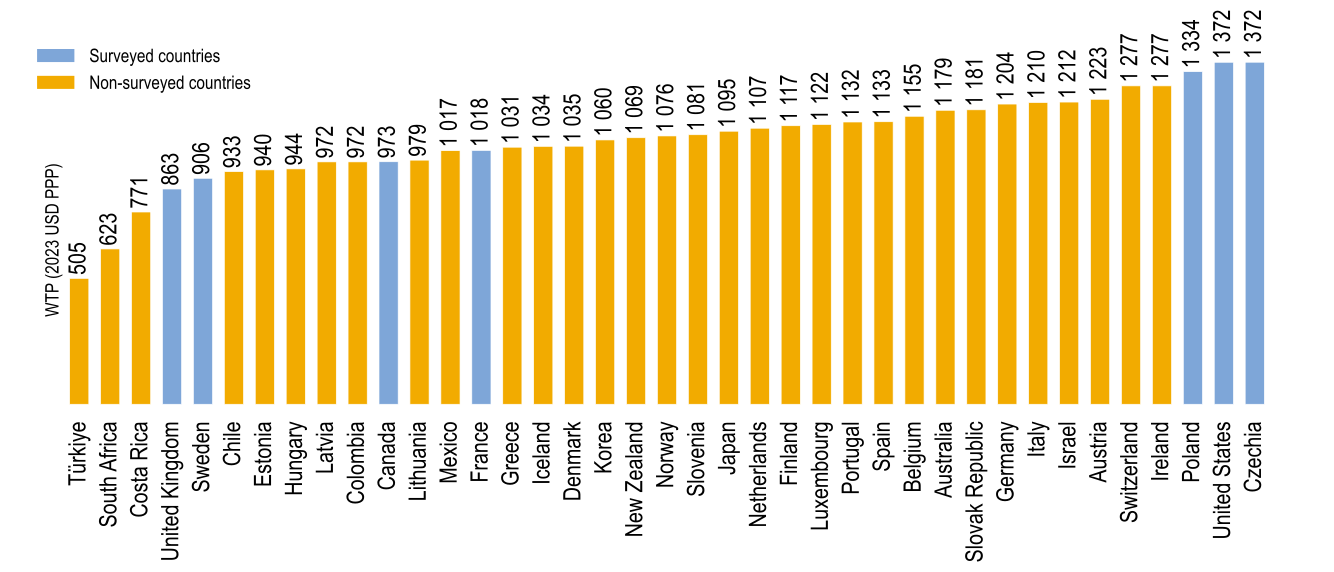
Note: WTP per year over ten years. The values for the countries shown in orange were estimated through a benefit transfer function, controlling for countries’ socio‑demographic composition (age, gender, education, and household income). The values for the countries shown in blue are taken from the asthma working paper, converted in this report to USD 2023 PPP, and presented in Figure 2.6 of Chapter 2.
Source: (Appéré et al., 2023[2]; OECD, 2026[1]).
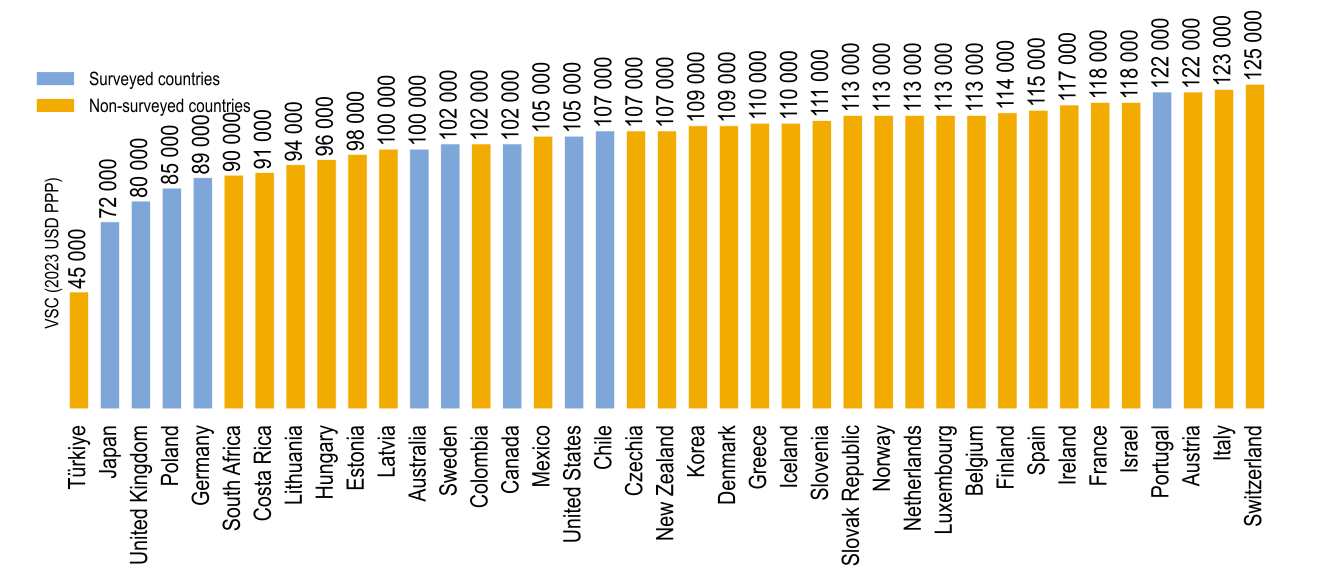
Note: The values for the countries shown in orange were estimated through a benefit transfer function, controlling for countries’ socio‑demographic composition (age, gender, education, and household income). The values for the countries shown in blue are taken from the infertility working paper, converted in this report to USD 2023 PPP, and presented in Figure 2.3 of Chapter 2.
Source: (Dussaux et al., 2023[5]; OECD, 2026[1]).
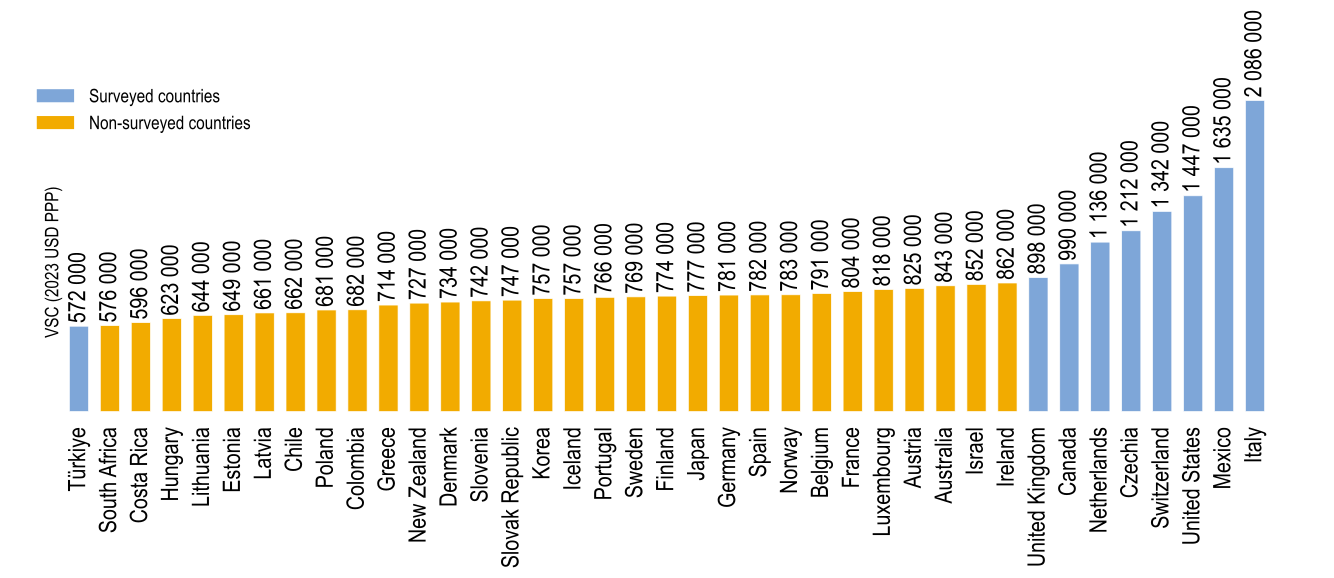
Note: The values for the countries shown in orange were estimated through a benefit transfer function, controlling for countries’ socio‑demographic composition (age, gender, education, and household income). The values for the countries shown in blue are taken from the very low birth weight working paper, converted in this report to USD 2023 PPP, and presented in Figure 2.10 of Chapter 2.
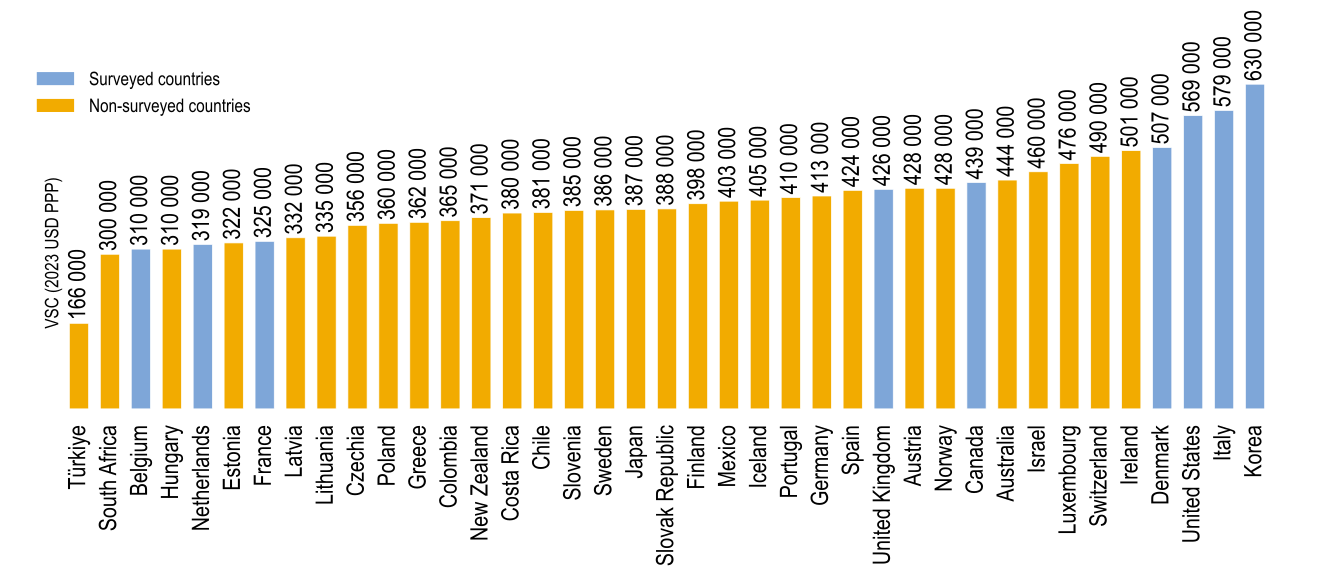
Note: The values for the countries shown in orange were estimated through a benefit transfer function, controlling for countries’ socio‑demographic composition (age, gender, education, and household income). The values for the countries shown in blue are taken from the miscarriage working paper, converted in this report to USD 2023 PPP, and presented in Figure 2.7 of Chapter 2.
Source: (Dockins et al., 2026[11]; OECD, 2026[1]).
For skin sensitisation and asthma risk, values for the non-surveyed countries are derived using an income adjustment. Figure 5.12, Figure 5.13, Figure 5.14, and Figure 5.15 display the recommended values.
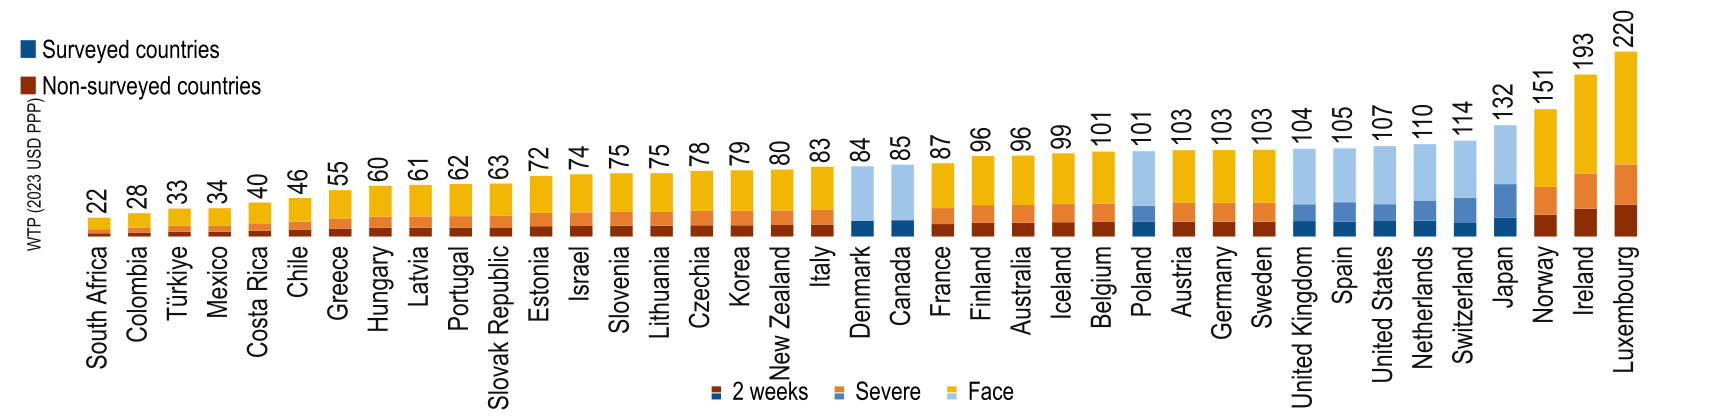
Note: the values for the countries shown in orange were estimated through an income-adjusted transfer from the Netherlands. The values for the countries shown in blue are taken from the skin sensitisation working paper and presented in Figure 2.12 of Chapter 2 and in Annex A.
Source: (Contu et al., 2026[3]; OECD, 2026[1]).
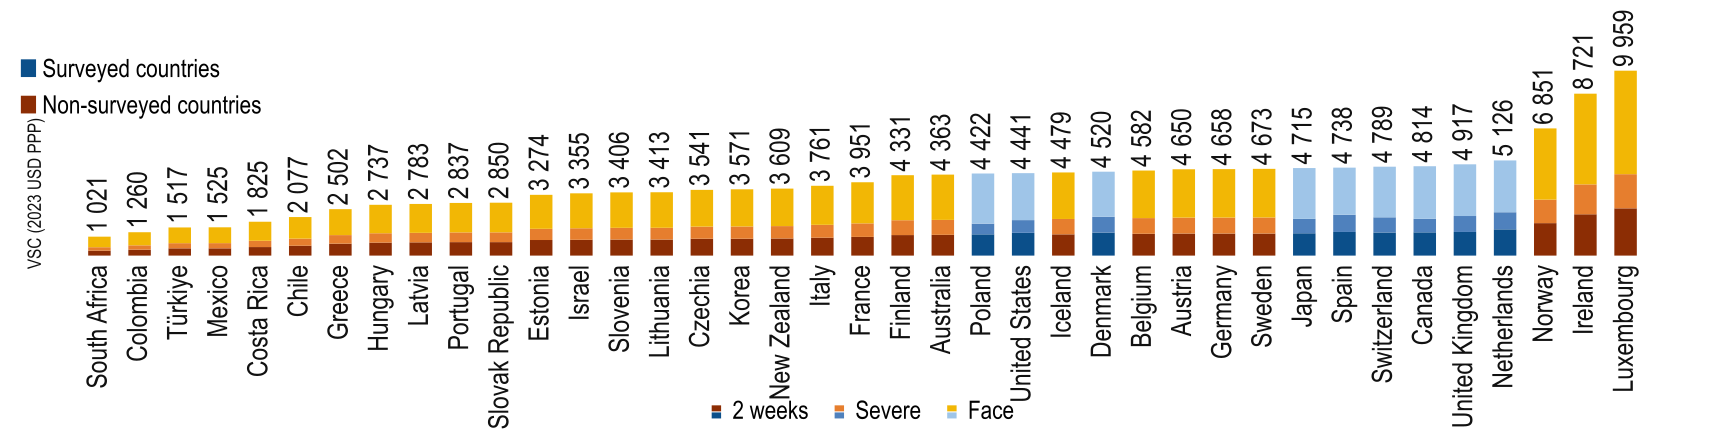
Note: the values for the countries shown in orange were estimated through an income-adjusted transfer from the Netherlands. The values for the countries shown in blue are taken from the skin sensitisation working paper and presented in Figure 2.13 of Chapter 2 and in Annex A.
Source: (Contu et al., 2026[3]; OECD, 2026[1]).
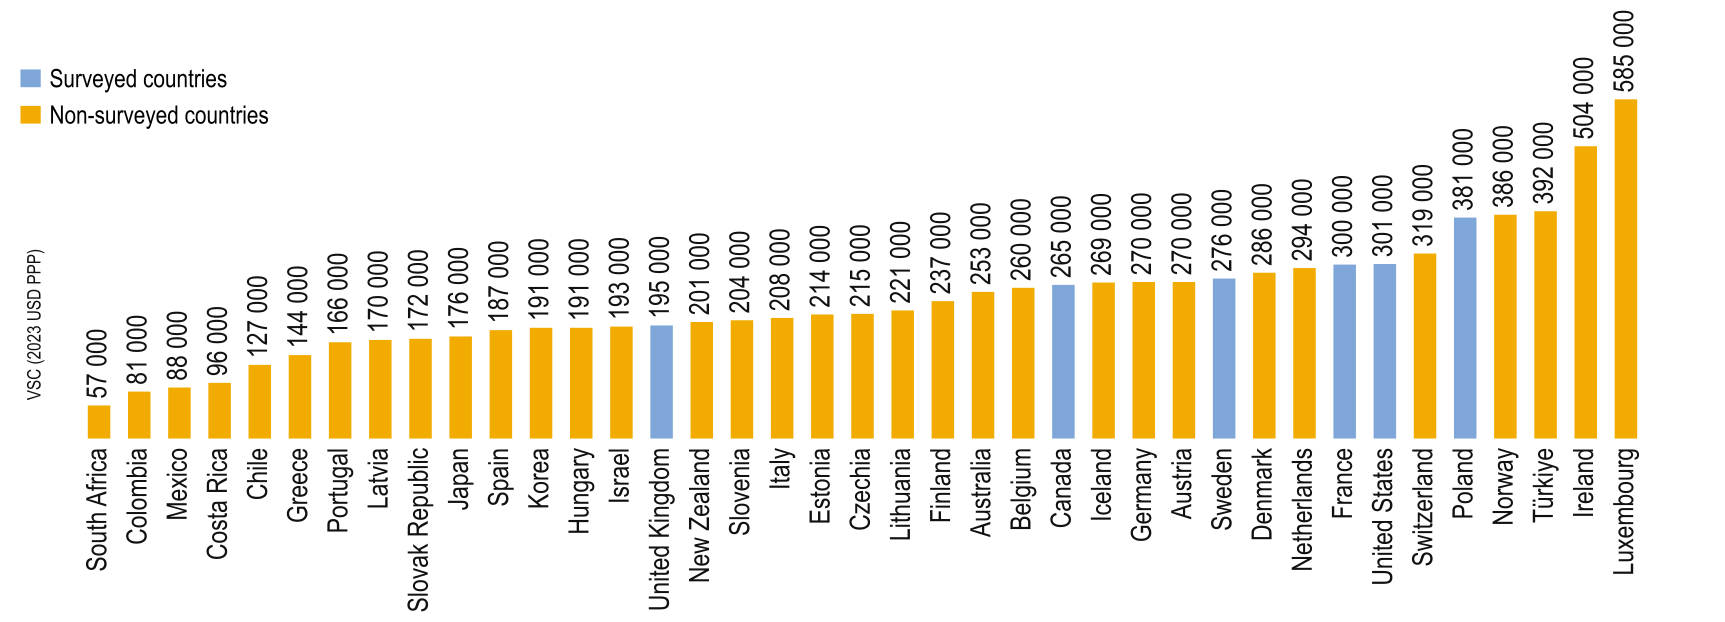
Note: the values for the countries shown in orange were estimated through an income-adjusted transfer from the United States. The values for the countries shown in blue are taken from the asthma working paper and presented in Figure 2.5 of Chapter 2.
Source: (Appéré et al., 2023[2]; OECD, 2026[1]).
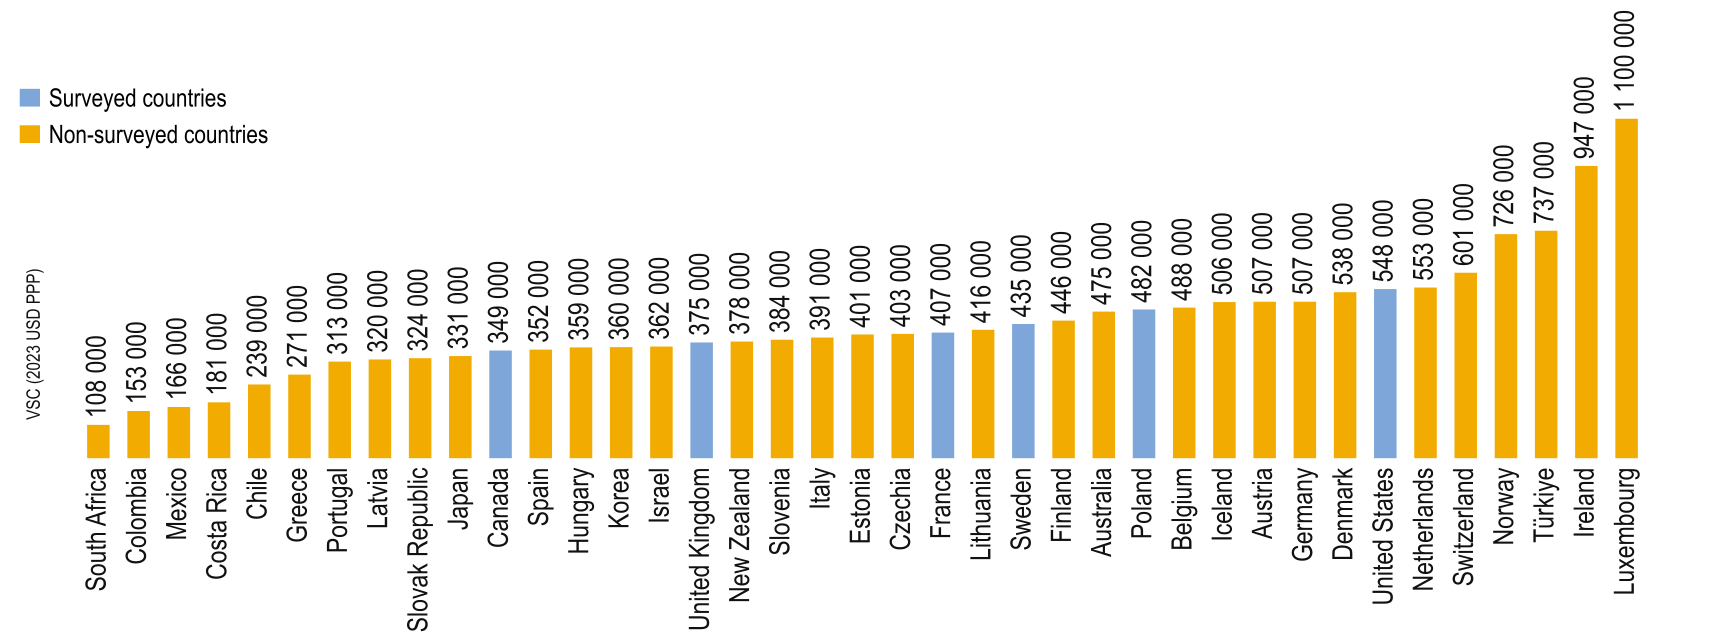
Note: the values for the countries shown in orange were estimated through an income-adjusted transfer from France. The values for the countries shown in blue are taken from the asthma working paper and presented in Figure 2.5 of Chapter 2.
Source: (Appéré et al., 2023[2]; OECD, 2026[1]).
5.1.2. Recommendations
The recommended values for the ten health effects for all 38 OECD Member countries and South Africa are listed in Annex B. For surveyed countries, recommended values are those directly derived from the surveys. For non-surveyed countries, the recommended values are those obtained through the use of a benefit transfer function.2 The transfer errors associated with the use of the benefit transfer functions range between 10-35% based on cross-testing benefit transfers among surveyed SWACHE countries (OECD, 2026[1]). Transfer errors of this size are consistent with findings in the literature and align with observed best‑practice values (Kristofersson and Navrud, 2007[12]; OECD, 2012[13]; Kaul et al., 2013[14]; Rosenberger and Loomis, 2017[15]).
Benefit function transfer values show consistent performance, with generally lower dispersion of transfer errors than simple unadjusted values or income‑adjusted values. It is therefore recommended to use OECD’s estimated benefit functions, in particular for countries where policymakers are not confident about which existing primary estimate could provide the best fit and be directly transferred for use in valuations of benefits in their country.
For more details on the methodology, see (OECD, 2026[1]), which performs an extensive comparative analysis of possible benefit transfer approaches, proposes a recommended methodology for valuations for health risk reductions in non-surveyed OECD countries using the SWACHE data and also offers ranges of the estimated values derived through benefit transfer.
The values derived from the benefit transfer analysis represent a starting point for the valuation of morbidity effects. Adjustment may be appropriate to account for the type of policy or programme considered, as well as for the countries and populations involved, and should also follow national governmental guidelines.
The benefit transfer approaches used in this report can also be applied to non-OECD countries where comparable data are available. However, it is important to note that the benefit‑transfer function applied in this report performs best when transferring values between countries that are not vastly different with respect to key socio‑economic characteristics, such as household income, gender, age, and education. Alternative approaches, such as unit value transfer or income‑adjusted value transfer, may also be considered and are discussed in (OECD, 2026[1]).
While the estimates provided by the SWACHE project are developed in the context of chemicals exposure, they can also be applied to the economic analysis of other health and environmental policies, provided that the endpoint targeted by the policy matches the endpoint description of the SWACHE project. SWACHE values can thus be applied to a wide range of policies, including air pollution or water regulations, preventive care programmes, or the setting of health and environmental standards.
The payment vehicles used in the studies of the first two rounds of the SWACHE project support the use of values in other policy contexts. All questionnaires describe different causes of the health outcome, with an emphasis on links to chemicals exposure, but the valuation questions themselves focused on the risk of developing or worsening a specific endpoint rather than on a particular regulatory measure.3 In most surveys, the payment vehicle is framed as paying more for safer products with fewer harmful chemicals, while in two surveys – chronic kidney disease and hypertension – respondents are directly asked how much they would be willing to pay to reduce their risk of developing the disease. In both cases, the resulting WTPs represent the amount respondents are willing to pay to reduce their risk of developing a defined health endpoint, rather than a preference for a specific policy instrument or chemical, which makes it possible to apply these values in other health-related non-chemicals policy domains. Importantly, coercive payment vehicles, such as taxes or mandatory fees, were not used. Instead, when an explicit payment vehicle was specified, the surveys followed guidance to use realistic everyday products that individuals purchase in real‑world decisions (OECD, 2018[16]). The choice of the payment vehicles thus ensures credibility to respondents.
The definition of the health outcome and its delimitation are essential when using values from the SWACHE project. For this reason, the choice of the health effect, its careful delimitation, and the definition presented to respondents in the questionnaire, were thoroughly reviewed and discussed within the SWACHE expert group, which includes health professionals, academics, cost-benefit analysis practitioners, and regulators. For example, the underactive thyroid study focuses specifically on hypothyroidism, rather than on other thyroid disorders. An accurate, clear and informative description of having an underactive thyroid was presented to respondents in the survey. An illustration of common symptoms of an underactive thyroid gland was also presented to respondents, as shown in Figure 5.16.
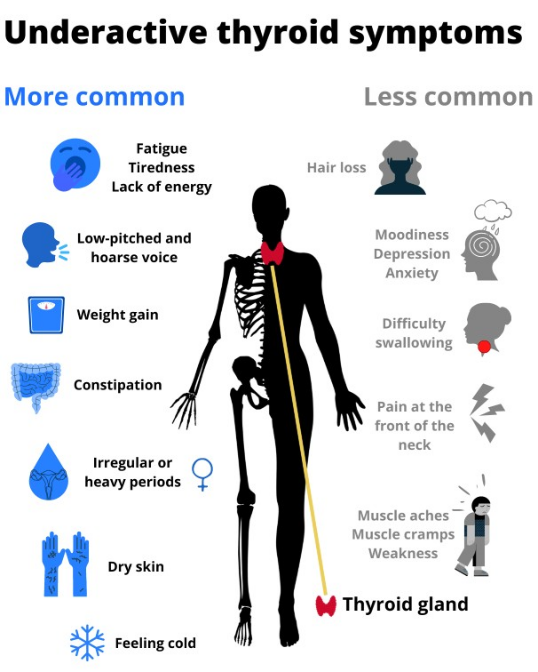
Source: (Ahtiainen et al., 2026[10]).
As a result, the VSC estimates recommended for policy analysis can be used only for policies or measures addressing hypothyroidism and do not apply to other thyroid disorders. In contrast, the study on non-fatal cancer deliberately presents an overview of cancer, without focusing on any specific type or progression of disease. The resulting value can therefore be applied to a wide range of policies, addressing different types of cancer and cancer-related risks as summarised by this extract from the non-fatal cancer survey: “Your answers will be used to measure the benefit of regulations that reduce the risk that people get cancer.”
This chapter discussed how benefit transfer approaches can be used to approximate the WTP and VSC in non-surveyed countries based on using a benefit transfer function and values for countries where SWACHE surveys have been performed. The chapter also provided benefit values for the OECD Member countries and South Africa and discussed their use outside of chemical applications, highlighting their potential to be used broadly in cost-benefit analyses that involve comparable health effects.
References
[10] Ahtiainen, H. et al. (2026), “Valuing a reduction in the risk of an underactive thyroid: A large-scale multi-country stated preference approach”, OECD Environment Working Papers, No. 272, OECD Publishing, Paris, https://doi.org/10.1787/4af8f3aa-en.
[2] Appéré, G. et al. (2023), “Valuing a reduction in the risk and severity of asthma: A large scale multi-country stated preference approach”, OECD Environment Working Papers, No. 218, OECD Publishing, Paris, https://doi.org/10.1787/f289d29e-en.
[3] Contu, D. et al. (2026), “Valuing a reduction in the risk of skin sensitisation: A large-scale multi-country stated preference approach”, OECD Environment Working Papers, No. 277, OECD Publishing, Paris, https://doi.org/10.1787/fc305de9-en.
[11] Dockins, C. et al. (2026), “Valuing a reduction in the risk of miscarriage: A large-scale multi-country stated preference approach”, OECD Environment Working Papers, No. 271, OECD Publishing, Paris, https://doi.org/10.1787/23bb6643-en.
[4] Dockins, C. et al. (2023), “Valuing a reduction in the risk of chronic kidney disease: A large scale multi-country stated preference approach”, OECD Environment Working Papers, No. 216, OECD Publishing, Paris, https://doi.org/10.1787/9c93138f-en.
[5] Dussaux, D. et al. (2023), “Valuing a reduction in the risk of infertility: A large scale multi-country stated preference approach”, OECD Environment Working Papers, No. 215, OECD Publishing, Paris, https://doi.org/10.1787/7242509f-en.
[6] Herrera-Araujo, D. et al. (2026), “Valuing a reduction in the risk of non-fatal cancer: A large-scale multi-country stated preference approach”, OECD Environment Working Papers, No. 274, OECD Publishing, Paris, https://doi.org/10.1787/0345660e-en.
[7] Hunt, A. et al. (2026), “Valuing a reduction in the risk of hypertension: A large-scale multi-country stated preference approach”, OECD Environment Working Papers, No. 270, OECD Publishing, Paris, https://doi.org/10.1787/9da8057a-en.
[14] Kaul, S. et al. (2013), “What can we learn from benefit transfer errors? Evidence from 20 years of research on convergent validity”, Journal of Environmental Economics and Management, Vol. 66/1, pp. 90-104, https://doi.org/10.1016/j.jeem.2013.03.001.
[12] Kristofersson, D. and S. Navrud (2007), “Can use and Non-use Values Be Transferred Across Countries?”, in The Economics of Non-Market Goods and Resources, Environmental Value Transfer: Issues and Methods, Springer Netherlands, Dordrecht, https://doi.org/10.1007/1-4020-5405-x_11.
[8] Mourato, S. et al. (2023), “Valuing the avoidance of IQ losses in children: A large scale multi-country stated preference approach”, OECD Environment Working Papers, No. 219, OECD Publishing, Paris, https://doi.org/10.1787/71574eb4-en.
[1] OECD (2026), Benefit transfer of willingness-to-pay estimates for avoiding negative chemicals-related health effects, OECD Publishing, Paris, https://doi.org/10.1787/f11379a0-en.
[16] OECD (2018), Cost-Benefit Analysis and the Environment: Further Developments and Policy Use, OECD Publishing, Paris, https://doi.org/10.1787/9789264085169-en.
[13] OECD (2012), Mortality Risk Valuation in Environment, Health and Transport Policies, OECD Publishing, Paris, https://doi.org/10.1787/9789264130807-en.
[15] Rosenberger, R. and J. Loomis (2017), “Benefit Transfer”, in The Economics of Non-Market Goods and Resources, A Primer on Nonmarket Valuation, Springer Netherlands, Dordrecht, https://doi.org/10.1007/978-94-007-7104-8_11.
[9] Ščasný, M., I. Zvěřinová and D. Dussaux (2023), “Valuing a reduction in the risk of very low birth weight: A large scale multi-country stated preference approach”, OECD Environment Working Papers, No. 217, OECD Publishing, Paris, https://doi.org/10.1787/dfd159a1-en.
← 1. As a reminder, the WTP estimates were derived using sampling quotas and post-stratification weights to ensure representativeness of the targeted sample in each surveyed country.
← 2. For skin sensitisation and asthma risk an income-adjusted benefit transfer technique was used (OECD, 2026[1]).
← 3. The IQ loss survey is the only exception, as the valuation scenario informs respondents that the government could place a ban on harmful chemicals affecting children’s IQ, and that such a ban would increase the price of everyday products.