Despite increasing internal mobility rates in most OECD countries in the past decade, mobility alone cannot address regional disparities in economic opportunity.
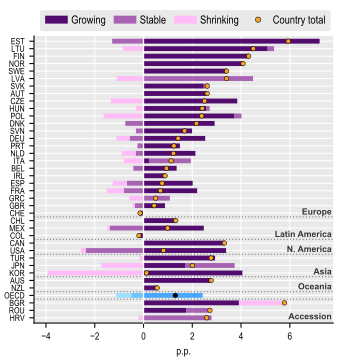
Metropolitan regions strengthened their demographic weight across nearly all OECD countries over the past two decades. They increased their already large share of national population in 31 of 33 OECD countries between 2005 and 2024. Their average share rose from 69% to 70.4%, adding 117 million residents to metropolitan regions (Figure 2.6). Net migration contributed for about half of the increase, as metropolitan regions attracted a larger share of migrants than their initial population share. Births contributed about one-quarter, while deaths contributed the remaining quarter. Growing metropolitan regions drove most of this shift, increasing their population share from 46.2% to 48.6%, while stable and shrinking regions each lost 0.5 percentage points.
Large metropolitan regions typically displayed contrasting patterns of net internal migration across countries (Figure 2.10 and Figure 2.11). Population inflows to large metropolitan regions surpassed outflows in Austria, Czechia, Hungary, Japan, Korea, Mexico, Poland, and Türkiye. By contrast, Australia, Chile, France, Germany, the United Kingdom and the United States showed net outflows from large metropolitan regions and inflows to midsize metropolitan regions or those near a midsize or large FUA. Age-specific migration may play a key role in shaping these patterns..
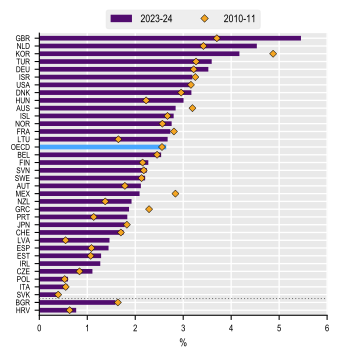
Although internal mobility rates increased in most countries, they remain relatively low given the scale of economic disparities across regions. The annual flow of people moving between small regions increased in 25 out of 33 OECD countries between 2010-2011 and 2023-2024 (Figure 2.7). The largest increases occurred in countries with relatively low rates in the initial period, pointing to some convergence in mobility rates. Despite the upward trend, the average internal mobility rate across the 33 countries was only 2.4% in 2023-2024.
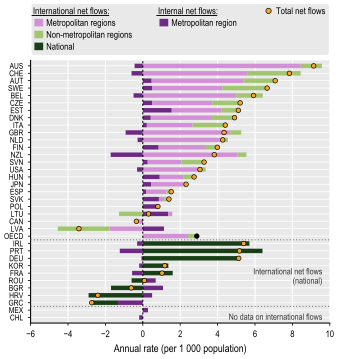
International migration contributed more to population growth in metropolitan regions than internal mobility in 19 of the 23 OECD countries with available regional data in 2010-2024 (Figure 2.8). Metropolitan regions gained an average of 2.4 international migrants per 1 000 national population, compared with 0.5 in non-metropolitan regions. In contrast, internal mobility produced virtually no net change in either region type. International inflows to metropolitan regions exceeded those to non-metropolitan regions in 22 countries. In Japan, Netherlands, New Zealand, United Kingdom and the United States, international inflows to metropolitan regions were at least eight times higher than non-metropolitan regions. International net flows to non-metropolitan regions were highest in Switzerland (2.8 per 1 000 national population), Sweden (2.4), Italy (1.7) and Austria (1.7).
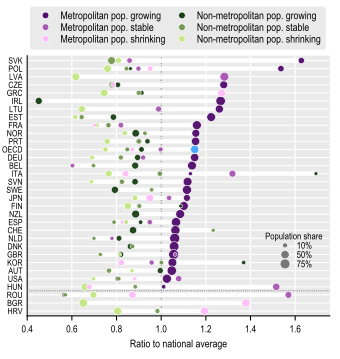
Large disparities in economic performance across regions coincide with marked differences in population growth and decline. Across 29 OECD countries, GDP per capita in metropolitan regions with growing population was 19% above the national average in 2024, compared with 15% below the national average in metropolitan regions with a shrinking population (Figure 2.9). Non-metropolitan regions fell below the national average less if they were growing in population compared to shrinking (12% vs. 26%).