This chapter examines the potential health and economic impacts of potential pandemic outbreaks. It starts by explaining the key epidemiological characteristics of pathogens of pandemic potential. Using the OECD Strategic Public Health Planning for Pandemic Preparedness and Response Model, the chapter quantifies the potential health and economic impacts of five unmitigated pandemic scenarios modelled based on the key traits of pathogens of pandemic potential, as well as data gathered for 51 OECD, European Union/European Economic Area and Group of 20 countries. The potential health burden is examined through measures of morbidity and mortality, extra burden on healthcare resources, whereas the potential impact on the economy is assessed through the estimated loss in economic output as measured by contraction in gross domestic product as a whole and by sector.
The Economic Case for Pandemic Preparedness and Response

Abstract
Key messages
Another pandemic is not a question of if, but when
Outbreaks have repeatedly disrupted societies, from the 1918 influenza pandemic to the recent COVID 19 crisis. The number of documented outbreaks has increased steadily since the 1940s and their severity intensified. Without deliberate action to interrupt the emergence and spread of outbreaks, the risk of future pandemic outbreaks is far from hypothetical.
Even before COVID 19, outbreaks imposed enormous economic costs. The 2002 2003 severe acute respiratory syndrome (SARS) outbreak cost around USD 50 billion, the 2005 highly pathogenic avian influenza HPAI A(H5N1) outbreak around USD 40 billion and the 2009 H1N1 influenza outbreak around USD 50 billion. The COVID 19 crisis was far more disruptive: Between 2020 2024, the global economy produced USD 13.8 trillion less than projected, a shortfall roughly equivalent to one year of China’s economic output.
Many pathogens circulate without causing major outbreaks, but some have epidemiological traits with pandemic potential such as high transmissibility, severe clinical outcomes, long infectious periods and limited population immunity. Today, reports of rising human infections with another highly pathogenic avian influenza virus raise concerns about the risk of another large-scale outbreak.
Using the OECD Strategic Public Health Planning (SPHeP) Pandemic Preparedness and Response (PPR) Model, this chapter reports estimates of the health and economic impacts of five unchecked outbreaks during their first nine months, assuming no pharmaceutical interventions are available. The outbreak scenarios broadly draw on the epidemiological traits of five pathogens with pandemic potential: Ebola-like, avian influenza-like, influenza A-like, coronavirus-like and measles-like.
Unmitigated outbreaks could threaten population health and overwhelm healthcare systems
The OECD model indicates that all five unmitigated pandemics would spread extensively across the populations of the 51 OECD, EU/EEA and G20 countries included in the analysis. Some outbreaks (e.g. measles-like outbreak) would lead to rapid and severe outbreaks, while others (e.g. Ebola-like outbreak), could progress more slowly. In most scenarios, a significant portion of the population could be infected within the first 2 3 months, reaching as high as 62.3% in a measles-like outbreak over the 9 month simulation period.
Health systems would face severe strain even with expanded capacity. Even the most advanced healthcare systems would struggle to meet the demand for intensive care capacity within 1 2 months, depending on the outbreak. Even with capacity increases to 120-130% of normal levels, as seen during COVID 19, surge capacity alone would not meet the demand. Resulting mortality could range from 1.2% of the population in a coronavirus-like outbreak to 5.4% in an avian influenza-like outbreak, rising up to 20% in a measles-like outbreak.
Unmitigated outbreaks threaten to destabilise entire economies, cutting across sectors
An unmitigated measles-like outbreak could reduce gross domestic product (GDP) by an average of 16.2% across 50 countries included in the analysis, while a coronavirus-like scenario would still result in a notable average decline of around 2.7%.
Some sectors are consistently more exposed than others. Across all outbreak scenarios, the transportation and storage sector would experience the steepest contractions, ranging from an average of around 13.4% in a coronavirus-like outbreak to 18.9% in a measles-like scenario.
The emergence and re‑emergence of disease outbreaks pose a significant threat to population health and economies across the globe. Over the 20th century, countries experienced several large‑scale disease outbreaks, including the 1918 influenza pandemic, 1957‑1958 influenza pandemic, 2002‑2003 severe acute respiratory syndrome (SARS) pandemic, avian influenza outbreaks in 1997, 2003 and 2018, and most recently, the COVID‑19 pandemic (D’Adamo et al., 2023[1]). Combined, these outbreaks claimed the lives of millions of people worldwide and imposed a heavy cost on economies.
Emerging evidence suggests that the risk of local outbreaks escalating into global pandemics has increased in recent years, driven by a number of factors such as climate change, expansion of global travel and trade networks and rapid urbanisation. More recently, the number of human infections with highly pathogenic avian influenza viruses has been on the rise, driven by sustained circulation in bird and mammal populations and occasional spillover into humans (Rolfes et al., 2025[2]). This trend has heightened concerns among public health authorities about the possibility of wider human-to-human transmission and the associated risk of a large‑scale outbreak.
To date, several attempts have been made to identify the pathogens that can potentially cause pandemics in the future. For example, the World Health Organization (WHO) Research and Development Blueprint for Epidemics, a global research strategy and pandemic preparedness plan, identified several pathogens of pandemic potential, including new variants of COVID‑19 and the Ebola virus disease (EVD) (WHO Research and Development Blueprint, 2024[3]). Broadly, previous efforts to identify pathogens of pandemic potential relied on several criteria to assess the pandemic potential of each pathogen such as the ability to spread between people rapidly and across geographic areas, the capacity to result in severe illness and mortality among the infected people and no or very little pre‑existing immunity in the community, as well as the lack of effective pharmaceutical treatments or vaccines to limit the spread of infections. Considering the high risk of disease outbreaks in the future (Box 3.1), it is imperative to examine the factors that contribute to the emergence and spread of pathogens of pandemic potential to help efforts to better prepare for and respond to future health emergencies.
The likelihood of another major outbreak is far from hypothetical
The number of outbreaks has increased steadily since the 1940s (Meadows et al., 2023[4]; Smith et al., 2014[5]; Jones et al., 2008[6]) and their severity has intensified. One recent analysis found that the number of deaths attributable to outbreaks and spillover events caused by SARS-CoV‑1, filoviruses and Machupo virus and Nipah virus grew at an exponential rate between 1963 and 2019. This study concluded that without deliberate action to interrupt the emergence and spread of these outbreaks, these pathogens could cause 12 times more deaths in 2050 than in 2020 (Meadows et al., 2023[4]). Another forward-looking study estimated that globally, the cumulative probability of experiencing another pandemic on the scale of COVID‑19 is roughly 50% in the next 25 years (Figure 3.1). The same study suggested that for respiratory pathogens, the probability of another pandemic ranged considerably from 14% to 80% depending on its severity (Madhav et al., 2023[7]).
Exceedance probability estimates for various historical and hypothetical pandemic scenarios

Note: Exceedance probability refers to the probability that an event of a given severity or worse will begin within a given year. Seasonal and endemic diseases, such as seasonal influenza and seasonal coronaviruses, are not included in the analysis.
Source: OECD estimates based on Tables 6 and A13 in (Madhav et al., 2023[7]).
A number of interlinked factors continue to elevate the risk of future pandemics. Human activity, ranging from rapid urbanisation and deforestation to intensive farming practices and an often‑unregulated wildlife trade, creates more opportunities for pathogens to spill over from animals to humans (Global Preparedness Monitoring Board, 2024[8]). At the same time, global mobility is accelerating, which in turn enables pathogens to circulate across regions at a much faster pace than ever seen before (AITA, 2023[9]). The demand for air travel is growing at roughly 3.4% per year and is expected to double by 2040 compared to 2019 levels. Adding to these factors, the increasing frequency of extreme weather events is amplifying the conditions under which new infectious threats can emerge (see Chapter 4).
Source: Meadows et al. (2023[4]), “Historical trends demonstrate a pattern of increasingly frequent and severe spillover events of high-consequence zoonotic viruses”, http://doi.org/10.1136/bmjgh-2023-012026; Smith et al. (2014[5]), “Global rise in human infectious disease outbreaks”, http://doi.org/10.1098/rsif.2014.0950; Jones et al. (2008[6]), “Global trends in emerging infectious diseases”, http://doi.org/10.1038/nature06536; Madhav et al. (2023[7]), “Estimated Future Mortality from Pathogens of Epidemic and Pandemic Potential”, https://www.cgdev.org/sites/default/files/estimated-future-mortality-pathogens-epidemic-and-pandemic-potential.pdf; Global Preparedness Monitoring Board (2024[8]), “The Changing Face of Pandemic Risk: 2024 Report”, https://www.gpmb.org/reports/m/item/the-changing-face-of-pandemic-risk-2024-report; AITA (2023[9]), “Global Outlook for Air Transport: Highly Resistant, Less Robust”, https://www.iata.org/en/iata-repository/publications/economic-reports/global-outlook-for-air-transport----june-2023/.
This chapter focusses on the potential health and economic impacts of pathogens of pandemic potential. It starts by taking stock of the health and economic impacts of large‑scale outbreaks over the last two decades. It then provides an overview of key epidemiological traits of pathogens that give them the potential to cause pandemics, with examples of past disease outbreaks. Next, the chapter presents results from a novel analysis of the potential health and economic impacts of five unmitigated pandemic scenarios across 51 OECD, EU/EEA and G20 countries, using the OECD Strategic Public Health Planning (SPHeP) for Pandemic Preparedness and Response (PPR) Model. The pandemic scenarios modelled in this chapter are 1) consistent with disease agents highlighted by WHO as pathogens of pandemic potential, 2) relevant to the current policy concerns highlighted by OECD, EU/EEA and G20 countries and 3) based on high-quality quantitative evidence on the key model parameters that were used as inputs in the OECD model. The chapter concludes by summarising the key findings.
Several major disease outbreaks had a significant impact on population health and the economy. The COVID‑19 pandemic was the most devastating of recent outbreaks, resulting in more than 762 million infections worldwide by April 2023 (WHO, 2023[10]) and costing USD 13.8 trillion to the global economy between 2020‑2024 (IMF, 2022[11]). Initially detected in China in December 2019, the COVID‑19 pandemic was declared a Public Health Emergency of International Concern by the WHO’s International Health Regulation Emergency Committee in January 2020, which was lifted in May 2023 (WHO, 2023[12]).
Even before the COVID‑19 pandemic, several pandemics had considerable implications for population health. The 2002‑2003 SARS outbreak gave early warning signs of major disruptions that could be caused by novel coronaviruses. The SARS outbreak spread across 26 countries on five continents (Wilder-Smith, 2021[13]; Peiris et al., 2003[14]), with estimated infections exceeding 8 000 cases (WHO, 2015[15]). Two years after the SARS outbreak, in 2005, another pandemic outbreak, this time caused by a highly pathogenic avian influenza (HPAI) H5N1 started spreading, first in countries such as China, Indonesia, Thailand and Viet Nam and eventually reaching Europe. The 2009 outbreak caused by the H1N1 influenza virus had a much broader reach, infecting nearly 275 000 people (WHO/GIP, 2024[16]) across 75 countries and territories (WHO, 2025[17]). Coronaviruses continued to threaten population health after the 2002‑2003 SARS outbreak. In 2012, a new outbreak caused by another coronavirus referred to as Middle East respiratory syndrome coronavirus (MERS-CoV) was first detected in Saudi Arabia, eventually spreading across 27 countries (WHO, 2026[18]). The global community experienced more localised disease outbreaks that were contained within certain geographic regions. For example, the 2014 EVD outbreak was primarily experienced in three West African countries, Guinea, Sierra Leone and Liberia, whereas the Zika outbreak primarily hit countries in the Latin American and Caribbean region. More recently, reports of rising human infections with another highly pathogenic avian influenza virus raise concerns about the risk of another large‑scale outbreak (Rolfes et al., 2025[2]).
The OECD analysis suggests that the economic cost of recent disease outbreaks has been substantial (Figure 3.2). The estimated economic impact of the H1N1 outbreak is similar to the cost caused by the 2002‑2003 SARS outbreak at around USD 50 billion, even though H1N1 infected almost 34 times more people than SARS. The H5N1 outbreak affected far fewer people compared to the SARS pandemic, but its economic cost was estimated to reach around USD 40 billion. The overall costs of MERS-CoV remained limited to USD 10 billion (Breban, Riou and Fontanet, 2013[19]). The 2014 EVD outbreak turned out to be more costly per infection compared to Zika. The estimated cost of the Zika outbreak for Latin American and Caribbean countries was approximately USD 17 billion, compared with USD 52 billion for EVD.

Notes: The size of the bubbles reflects the number of reported infections in each outbreak. The estimated economic cost of each outbreak is quantified based on a comprehensive review of the literature, although it may not include all associated costs.
Source: The number of infections for SARS, H5N1, H1N1, MERS, Ebola and Zika are extracted from (WHO/GIP, 2024[16]; da Costa et al., 2020[20]; Noh et al., 2020[21]; PAHO, 2025[22]). The economic cost of SARS was calculated as the sum of costs reported for China, Canada, Hong Kong, Chinese Taipei, Singapore, Viet Nam and the United States in (Chen, 2008[23]; Cherry and Krogstad, 2004[24]; Hai et al., 2004[25]; Ostwald, 2014[26]; Steinmueller, 2005[27]; Knobler, Institute of Medicine (U.S.). Forum on Microbial Threats. and Institute of Medicine (U.S.). Board on Global Health., 2004[28]). The economic cost of H5N1 was calculated as the sum of costs for China, South-East Asian economies, and Egypt based on (World Bank, 2017[29]; Elci, 2006[30]; Hassouneh et al., n.d.[31]). The economic cost for H1N1 was extracted from (The World Bank, 2018[32]) for a global analysis. The global economic cost of MERS was extracted from (GPMB, 2019[33]). The economic cost of Zika was extracted from (UNDP, 2017[34]) for the Latin American and Caribbean region. The economic cost for Ebola, which was calculated as the sum of costs for three countries, including Guinea, Sierra Leone, and Liberia, was extracted from (Huber, Finelli and Stevens, 2018[35]).
Large differences in the economic impact of outbreaks often reflect factors beyond the number of infections alone, including sectoral exposure and geographic concentration. The economic impact of the 2002‑2003 SARS outbreak was felt most in travel and consumer spending. The 2009 H1N1 pandemic mainly impacted tourism and the pork industry. For example, one study found that in Mexico, travel restrictions during the H1N1 outbreak led to USD 2.8 billion losses in tourism and a pork deficit of USD 27 million (Rassy and Smith, 2013[36]). The 2015 MERS-CoV outbreak led to widespread economic losses. In Korea, tourism revenue alone dropped by an estimated USD 2.6 billion (Joo et al., 2019[37]). The accommodation sector lost around USD 542 million, whereas the food and beverage industry lost around USD 359 million (Ibid). The losses in the transportation sector were estimated to be around USD 106 million (Ibid). The Zika outbreak also caused widespread losses in international tourism, with an estimated lost income between USD 6.5 billion and USD 9 billion (UNDP, 2017[34]).
Disease outbreaks can vary in size, ranging from small and localised events to global (Box 3.2). While all disease outbreaks are concerning for public health, only certain pathogens with certain epidemiological traits have the potential to spread widely and cause global concern.
A disease outbreak is defined as the occurrence of cases of disease in excess of what would normally be expected in a defined community, geographical area or season. Often maintained by infectious agents that spread directly from person to person, via an insect or animal vector or from exposure to an animal reservoir or other environmental source, disease outbreaks can broadly be classified as endemic, epidemic and pandemic (Ibid). Understanding the characteristics of disease outbreaks (e.g. its size, type, susceptibility of population exposed, time and place of occurrence) is essential for investigating and mitigating the spread of infectious diseases. Specifically:
An endemic refers to the constant presence or usual prevalence of a disease or infectious agent in a population within a geographic area (Center for Disease Control and Prevention, 2006[38]). A disease outbreak is endemic when it is consistently present but limited to a particular region (Columbia Mailman School of Public Health, 2021[39]).
An epidemic refers to the increase, often sudden, in the number of cases of a disease, specific health-related behaviour, or other health-related event above what is normally expected in that population in that area (Center for Disease Control and Prevention, 2006[38]). When describing an epidemic, the time period, geographical region and characteristics of the population in which the unexpected rise of cases has occurred must be specified (Bonita et al., 2006[40]). It is important to note that while epidemics can be large, they do not necessarily have to be contagious and are generally contained or expected in their spread.
A pandemic is an epidemic that has spread over several countries or continents, usually affecting large numbers of people (Center for Disease Control and Prevention, 2006[38]). Importantly, the difference between an epidemic and a pandemic outbreak is determined by the degree to which the disease is spread rather than the disease severity. As such, WHO declares a pandemic when a disease’s growth is exponential. The wide geographical reach is what makes pandemics lead to large‑scale social disruptions and economic loss and general hardships (Columbia Mailman School of Public Health, 2021[39]).
Source: Center for Disease Control and Prevention (2006[38]), Principles of Epidemiology in Public Health Practice; An Introduction to Applied Epidemiology and Biostatistics. 3RD ed, https://stacks.cdc.gov/view/cdc/6914/cdc_6914_DS1.pdf; Colombia Mailman School of Public Health (2021[39]) Epidemic, Endemic, Pandemic: What Are The Differences?,3RD ed, https://stacks.cdc.gov/view/cdc/6914/cdc_6914_DS1.pdf; Bonita et al. (2006[40]), Basic Epidemiology, https://apps.who.int/iris/handle/10665/43541.
As shown in Table 3.1, the extent to which pathogens can disrupt society depends broadly on two factors:
Epidemic trajectory refers to the rate at which the number of active cases occur at any given time in the population (Thomas et al., 2020[41]; Chiossi, Tsolova and Ciotti, 2021[42]). Assessing the epidemic trajectory of a pathogen requires understanding the type of agent (e.g. virus, bacteria or fungi) causing the outbreak and the efficiency with which a disease is circulating in the population, as measured by the basic reproduction number (.
Course of infection refers to the disease process from exposure to infection and the resolution of the case. Examining the course of infections necessitates understanding a range of factors such as the mode of transmission (e.g. direct contact, droplets), time elapsed between the onset of infection to onset of contagiousness (i.e. incubation period), the share of infected patients who exhibit symptoms and the proportion of cases that result in mortality.
Each of these factors and their interactions influence the potential of a pathogen to cause pandemics. The remainder of this section explores these key epidemiological characteristics, with examples of outbreaks caused by pathogens of pandemic potential in the past.
|
Dimension |
Factors |
Definition |
Pandemic potential |
|---|---|---|---|
|
Epidemic trajectory |
Agent type |
Intrinsic characteristics of pathogen agents, such as being a virus, bacteria or fungi, have an impact on their capacity to replicate, mutate and infect hosts |
Varies by agent type |
|
Basic reproduction number ( |
A measure to determine the efficiency with which a disease is transmitted. It represents the estimated number of secondary cases due to exposure to a single infector |
|
|
|
Course of infection |
Modes of transmission |
Mode of transmission of a pathogen agent from infector to infectee (e.g. direct contact, droplet spread, airborne, vector-borne) |
Varies by mode of transmission |
|
Latent period |
Time elapsed from onset of infection to onset of disease symptoms (within the same person) |
|
|
|
Incubation period |
Time elapsed between onset of infection and onset of contagiousness (within the same person) |
|
|
|
Infectious period |
Time during which a person can transmit the disease to another person |
pandemic potential |
|
|
Asymptomatic proportion |
The share of infectees that does not develop symptoms. An asymptomatic infector can still infect others and be unaware of own infectiousness |
Higher proportion of asymptomatic infections increase pandemic potential |
|
|
Case fatality rate (CFR) |
Proportion of cases that result in death |
On its own, CFR does not signal information on pandemic potential |
|
|
Immunogenicity |
Development of immune protection against re‑infection with the same/similar organisms following the initial infection |
Immunologically naïve populations have a greater risk of potential outbreaks |
 Higher
increases pandemic potential
Higher
increases pandemic potential In general, longer latency period decreases pandemic potential
Note: This table is not intended to be exhaustive; it presents selected determinants of epidemic trajectory and infection course, with a particular focus on those commonly used in modelling exercises.
Source: Porta (2016[43]), A Dictionary of Epidemiology; Nelson and Williams (2014[44]), Infectious Disease Epidemiology: Theory and Practice;
Adalja et al. (2018[45]), The Characteristics of Pandemic Pathogens: Improving Pandemic Preparedness by Identifying the Attributes of MIcroorganisms Most LIkely to Cause a Global Catastrophic Biological Event, https://www.centerforhealthsecurity.org/our-work/pubs_archive/pubs-pdfs/2018/180510-pandemic-pathogens-report.pdf; Mizumoto et al. (2020[46]), Estimating the asymptomatic proportion of coronavirus disease 2019 (COVID-19) cases on board the Diamond Princess cruise ship, Yokohama, Japan, 2020; Fraser et al. (2004[47]), Proceedings of the National Academy of Sciences of the United States of America; Center for Disease Control and Prevention (2006[38]), Principles of epidemiology in public health practice: An introduction to applied epidemiology and biostatistics. 3rd ed, https://stacks.cdc.gov/view/cdc/6914.
The remainder of the section presents the key epidemiological characteristics of pathogens of pandemic potential as follows (Annex 3.A provides more details):
Different classes of microbes vary substantially in their potential to generate global catastrophic biological risks. Viruses, especially rapidly evolving RNA viruses such as highly pathogenic avian influenza (HPAI) (Box 3.3) pose the greatest concern, while bacteria represent a growing threat due to rising antimicrobial resistance. In contrast, fungi, prions and protozoans currently have more limited pandemic potential given biological constraints, restrictive transmission routes and the availability of effective prevention or control strategies (Adalja et al., 2018[45]).
Animal influenza viruses, similar to those causing seasonal influenza in humans, continue to evolve. These viruses have the potential to adapt and spread efficiently among humans, posing a pandemic threat (CDC, 2023[48]). The highly pathogenic avian influenza A(H5N1) virus is of particular concern due to its ability to infect humans. Estimates of transmissibility of HPAI A(H5N1) in humans remain limited and transmission rates depend heavily on the outbreak setting and the type of infected animal (Kirkeby and Ward, 2022[49]). Humans who are infected with H5N1 face a very high risk of requiring ICU care, with around 63% of hospitalised patients requiring advanced organ support (Gruber, Gomersall and Joynt, 2006[50]). Infected patients also have a high risk of mortality (Lai et al., 2016[51]).
The increasing number of reported human infections with HPAI A(H5N1) in recent years has been raising concerns about the risk of another large‑scale outbreak. In total, there were 91 reported human cases of H5N1 worldwide from 2024 to 2025 (Institut Pasteur, 2025[52]). Most of the detected cases were reported in four countries: Bangladesh, Cambodia, China and India (ECDC, 2025[53]). While transmission between humans has not been observed, infections following exposure to infected animals continue to occur (CDC, 2023[48]).
Source: CDC (2023[48]),Technical Report: Highly Pathogenic Avian Influenza A(H5N1) Viruses, https://www.cdc.gov/flu/avianflu/spotlights/2022-2023/h5n1-technical-report.htm; Kirkeby and Ward (2022[49]), “A Review of Estimated Transmission Parameters for the Spread of Avian Influenza Viruses”, https://doi.org/10.1111/tbed.14675; Gruber, Gomersall and Joynt (2006[50]), “Avian Influenza (H5N1): Implications for Intensive Care”, https://doi.org/10.1007%2Fs00134-006-0148-z; Lai et al. (2016[51]), “Global Epidemiology of Avian Influenza A H5N1 Virus Infection in Humans, 1997–2015: A Systematic Review of Individual Case Data”, https://doi.org/10.1016/s1473-3099(16)00153-5; Institute Pasteur (2025[52]), “Avian Influenza: A Global Epidemic Under Surveillance”, https://www.pasteur.fr/en/research-journal/news/avian-influenza-global-epidemic-under-surveillance; ECDC (2025[53]), “Avian influenza overview June–September 2025”, https://www.ecdc.europa.eu/en/publications-data/avian-influenza-overview-june-september-2025.
The basic reproduction number () is one of the most important factors that helps assess the epidemic trajectory of a disease. It describes how many secondary infections one case generates in a fully susceptible population and is a key indicator of an outbreak’s potential trajectory (Delamater et al., 2019[54]). Outbreaks grow when is at or above 1 and decline when it falls below 1, but estimating its exact value is challenging because varies by context, pathogen and stage of the epidemic (Box 3.4). Historical and recent outbreaks, including the 1918 influenza pandemic and successive coronavirus epidemics, demonstrate how can shift over time as conditions change (Biggerstaff et al., 2014[55]).
Severe acute respiratory syndrome (SARS-CoV), MERS-CoV and SARS‑CoV‑2 are all coronaviruses that have caused disease outbreaks over the last two decades, each with distinct transmission dynamics. SARS‑CoV‑2 exhibited the highest transmissibility, driving its rapid global spread. SARS-CoV had a lower but still significant transmission rate, resulting in the 2002‑2003 outbreak. MERS-CoV demonstrated more limited human-to-human transmission. More specifically:
MERS-CoV is considered to have relatively low pandemic potential (Breban, Riou and Fontanet, 2013[19]). MERS-CoV transmission rates were observed to be higher in healthcare settings largely due to the close contact between infected patients and healthcare workers, especially in the absence of proper infection prevention and control measures. Community transmission is estimated to be less frequent, because in most cases, the infection was traced back to direct or indirect physical contact with infected camels, which are the known reservoir of the virus.
SARS-CoV primarily spreads through respiratory droplets and aerosol particles (Yu et al., 2004[56]) and its symptoms range from mild flu-like symptoms to severe pneumonia, with some cases leading to acute respiratory distress syndrome. The 2003 SARS outbreak highlighted the potential for zoonotic diseases to cause widespread health crises. SARS-CoV remains an important point of reference in understanding the epidemiology and control of novel coronaviruses.
SARS‑CoV‑2, the coronavirus that caused the COVID‑19 pandemic, evolved throughout the pandemic. The first variant of concern for SARS‑CoV‑2, referred to as the Alpha variant, was initially detected in the United Kingdom in late 2020. Another variant named Delta was detected in India in late 2020. By the end of 2021, the Omicron variant was detected in South Africa (CDC, 2023[57]). Each variant had substantially different properties from the ancestral strain of SARS‑CoV‑2. The Delta variant had an estimated value of 5.08 (Liu et al., 2020[58]) whereas the Omicron variant had an reaching 9.5 (Liu and Rocklöv, 2022[59]). Both of these values are substantially higher than the of the ancestral strain of around 2.79 (Liu et al., 2020[58]).
Source: Breban, Riou and Fontanet (2013[19]), “Interhuman Transmissibility of Middle East Respiratory Syndrome Coronavirus: Estimation of Pandemic Risk”, https://doi.org/10.1016/s0140-6736(13)61492-0; Yu et al. (2004[56]), “Evidence of Airborne Transmission of the Severe Acute Respiratory Syndrome Virus”, https://doi.org/10.1056/NEJMoa032867; CDC (2023[57]), SARS‑CoV‑2 Variant Classifications and Definitions, https://www.cdc.gov/coronavirus/2019-ncov/variants/variant-classifications.html; Liu et al. (2020[58]), “The Reproductive Number of COVID-19 is Higher Compared to SARS Coronavirus”, https://doi.org/10.1093/jtm/taaa021; Liu and Rocklöv (2022[59]), “The Effective Reproductive Number of the Omicron Variant of SARS-CoV-2 is Several Times Relative to Delta”, https://doi.org/10.1093/jtm/taac037.
The mode of transmission refers to the variety of ways through which an infectious agent may be transmitted to a susceptible host from its natural reservoir (Adalja et al., 2018[45]). Identification of the mode of transmission in the early stages of an outbreak is key to support the mitigation efforts and to ensure that the response is effective. Modes of transmission shape the scale and severity of infectious disease outbreaks, with respiratory and faecal – oral pathogens (e.g. Hepatitis A and Vibrio cholerae) posing particularly high risks because their spread is harder to interrupt and can be amplified by weaknesses in public health or sanitation systems (Mavhunga, 2023[60]). In contrast, pathogens transmitted through direct contact may be more easily interruptible through strengthened infection prevention and control measures. Vector- and tick-borne diseases remain geographically constrained but are becoming a growing concern as vector ranges expand (Chapter 4).
Timing of disease transmission strongly influences outbreak dynamics. Diseases such as EVD and smallpox are contagious primarily when symptoms appear (Wilder-Smith, 2021[13]), whereas human immunodeficiency virus (HIV) can be infectious for years after the initial infection (Nelson and Williams, 2014[44]). Other pathogens (e.g. influenza viruses) can spread during the incubation period and even before symptoms appear, creating more opportunities for infected individuals to transmit the disease while conducting their daily activities without any major interruptions (Box 3.5).
Influenza is a common acute respiratory infection responsible for 3‑5 million severe illnesses every year (WHO, 2023[61]). Each year, seasonal influenza causes up to 650 000 deaths globally, including an estimated 72 000 in the WHO European region (WHO, 2024[62]). Of the four known influenza virus types (i.e. types A, B, C and D), pandemics occur when a novel influenza virus emerges in the population with little or no pre‑existing immunity (CDC, 2023[63]). Past influenza A pandemics include the 1918‑1919 H1N1 outbreak, the 1957-1958 H2N2 outbreak and the 2009 H1N1 outbreak (CDC, 2019[64]; ECDC, 2023[65]).
Transmission and severity vary across influenza strains. The basic reproduction number of the 2009 H1N1 pandemic was estimated at around 1.46, with higher values reported in higher-density settings such as schools (Biggerstaff et al., 2014[55]). CFR for influenza pandemics is generally low compared to other diseases such as EVD, ranging from 0.26% in the 2009 H1N1 outbreak in England (Donaldson et al., 2009[66]) to less than 0.2% in the 1957-1958 H2N2 (ECDC, 2023[65]). Mortality risk also differs across population groups (CDC, 2019[64]).
Source: WHO (2023[61]),Influenza (Seasonal), https://www.who.int/news-room/fact-sheets/detail/influenza-(seasonal); WHO (2024[62]),”Pandemic Influenza: A Threat That All Countries Need to Prepare For” https://www.who.int/europe/emergencies/emergency-cycle/prepare/pandemic-influenza; CDC (2023[63]), Types of Influenza Viruses, https://www.cdc.gov/flu/about/viruses/types.htm; CDC (2019[64]), 2009 H1N1 Pandemic (H1N1pdm09 virus), https://www.cdc.gov/flu/pandemic-resources/2009-h1n1-pandemic.html; ECDC (2023[65]),Questions and Answers on influenza pandemics, https://www.ecdc.europa.eu/en/seasonal-influenza; Biggerstaff et al. (2014[55]), “Estimates of the reproduction number for seasonal, pandemic, and zoonotic influenza: a systematic review of the literature”, http://doi.org/10.1186/1471-2334-14-480; Donaldson et al. (2009[66]), “Mortality from pandemic A/H1N1 2009 influenza in England: public health surveillance study”, http://doi.org/10.1136/bmj.b5213; ECDC (2023[65]),Questions and Answers on influenza pandemics, https://www.ecdc.europa.eu/en/seasonal-influenza.
Non-symptomatic infections, those that occur without observable symptoms, can substantially shape outbreak dynamics by allowing transmission to go undetected. Asymptomatic infections occur when an infected individual never develops symptoms, whereas pre‑symptomatic infections refer to cases detected before symptoms eventually appear. Evidence from dengue, Ebola and COVID‑19 shows that a meaningful share of infected individuals falls into these categories, with estimates for COVID‑19 suggesting that 8.4% to 39% of cases may remain asymptomatic (Gao et al., 2021[67]). The relative infectiousness of non-symptomatic infections compared to symptomatic ones is difficult to quantify due to variations in testing capacity and follow-up (Gao et al., 2021[67]; CDC, 2021[68]).
Disease severity, often summarised through case fatality rate (CFR), is a critical determinant of a pathogen’s impact on population health and the economy. CFR refers to the proportion of infected individuals who lose their lives from a particular condition, and its value reflects both the epidemiology of the pathogens and the current standard of healthcare, as well as the availability of new therapeutics or vaccines. High mortality is not a prerequisite for major social disruption, as shown in the 1918 influenza pandemic, which caused approximately 50‑100 million deaths worldwide (Beach, Clay and Saavedra, 2022[69]) even though it has a relatively low CFR of around 1‑2% (Schoch-Spana et al., 2017[70]). Conversely, although Ebola has a much higher CFR (Box 3.6), its pandemic potential remains more limited if public health measures are effectively implemented with high proportion of the population adhering to guidelines (ECDC, 2022[71]).
The risk of EVD outbreaks in most OECD countries remains low
EVD is a rare but severe infectious disease transmitted through direct contact with the blood, organs and bodily fluids of the infected people/animals, as well as through unsafe handling of human remains. Asymptomatic infection is uncommon, even in high-exposure situations (Glynn et al., 2017[72]). The risk of large‑scale outbreaks can be reduced when effective infection prevention and control measures are in place (ECDC, 2022[71]).
EVD is characterised by relatively low transmissibility but extremely high lethality. One systematic assessment of the major EVD outbreaks between 2013 and 2016 in several West African countries suggested that the median basic reproduction number ranged from around 1.51 (95%CI: 1.50‑1.52) in Guinea to 1.59 (95% CI: 1.57‑1.60) in Liberia (Wong et al., 2017[73]). Depending on the context, the estimated CFR has been shown to range from 25‑90% (Malvy et al., 2019[74]).
The latest EVD outbreak, caused by the Bundibugyo species of Ebola, was declared in the Democratic Republic of the Congo and Uganda in May 2026, with the WHO designating it a Public Health Emergency of International Concern on 17 May 2026. As of 29 July 2026, the Democratic Republic of the Congo reported 3 442 confirmed cases and 1 521 deaths, whereas the last confirmed case in Uganda was reported on 21 June 2026 (ECDC, 2026[75]).Response efforts are complicated by the absence of any approved vaccine or treatment for Bundibugyo virus, alongside armed conflict, weak health infrastructure, low contact-tracing coverage and a substantial funding gap. At the time of writing of this chapter, the risk of an EVD outbreak in most OECD countries is considered very low (ECDC, 2026[75]).
Source: Glynn et al. (2017[72]), “Asymptomatic Infection and Unrecognised Ebola Virus Disease in Ebola-affected Households in Sierra Leone: A Cross-sectional Study Using a New Non-invasive Assay for Antibodies to Ebola Virus”, https://doi.org/10.1016/s1473-3099(17)30111-1; ECDC (2022[71]), Factsheet about Ebola Disease, https://www.ecdc.europa.eu/en/infectious-disease-topics/z-disease-list/ebola-virus-disease/facts/factsheet-about-ebola-disease; Malvy et al. (2019[74]), “Ebola Virus Disease”, http://doi.org/10.1016/s0140-6736(18)33132-5; Wong et al. (2017[73])“A Systematic Review of Early Modelling Studies of Ebola Virus Disease in West Africa”, http://doi.org/10.1017/s0950268817000164; ECDC (2026[75]), “ Ebola disease outbreak in the Democratic Republic of the Congo and Uganda”,https://www.ecdc.europa.eu/en/ebola-outbreak-democratic-republic-congo-and-uganda.
Populations with little or no pre‑existing immunity are more vulnerable to pandemic outbreaks because a larger share of individuals is susceptible to infection. Immunity acquired through prior infection or vaccination can slow transmission and reduce the severity of disease (Box 3.7), easing pressure on health systems even if its effect on the basic reproduction number is limited. When a novel pathogen emerges, however, the entire population is essentially susceptible, as seen with COVID‑19, allowing the disease to spread rapidly and cause substantial health impacts.
Measles is a highly contagious airborne disease and remains one of the leading causes of vaccine‑preventable deaths worldwide. With a basic reproductive number estimated at 12 to 18, measles spreads rapidly, particularly among children under five years of age (Do and Mulholland, 2025[76]). The virus causes a systemic infection affecting the skin, eyes, respiratory tract and gastrointestinal system. Common symptoms include fever, cough, rash and conjunctivitis (NHS, 2024[77]). Vulnerable populations, including malnourished children, immunocompromised individuals and pregnant people, face significantly higher risks of severe disease and mortality.
Since 2024, all WHO regions have reported rising measles incidence, with 395 521 confirmed cases in 2024 and over 16 000 cases recorded in the first two months of 2025 (Ibid). In 2023, measles caused an estimated 107 500 deaths globally, despite the widespread availability of a safe and cost-effective vaccine (WHO, 2026[78]).
Source: Do and Mulholland (2025[76]), “Measles 2025”, https://doi.org/10.1056/nejmra2504516; NHS (2024[77]), “Measles”, https://www.nhs.uk/conditions/measles/; WHO (2026[78]), “Measles”, https://www.who.int/news-room/fact-sheets/detail/measles.
The OECD SPHeP-PPR model is a microsimulation model that simulates the spread of five pandemics by replicating the epidemiological characteristics of pathogens of pandemic potential and healthcare resources in 51 OECD, EU/EEA and G20 countries (Box 3.8). Broadly, the OECD model aims to:
Build five unmitigated pandemic scenarios to quantify the potential health and economic impact of pandemics, assuming that no measure is implemented to curb the spread of infections during the first nine months of the outbreak.
Assess the effectiveness of the selected NPIs aiming to stem the spread of infections in each pandemic scenario assuming that there are no reliable medical treatments and vaccines available to treat infections.
The COVID‑19 pandemic led to a proliferation in the use of mathematical models that consider both epidemiological and economic factors for guiding policymakers
Epidemiological-economic models have become essential tools for assessing the potential consequences of pandemics and for informing policy decisions before, during and after an outbreak (OECD/WHO/The World Bank, 2024[79]). They bring together two components: an epidemiological one that simulates how a pathogen spreads through a population and the resulting burden on health system capacity, morbidity and mortality and an economic one that translates these health impacts into broader economic outcomes. By linking the two, such models allow policymakers to weigh the costs of an outbreak against the costs and benefits of measures to contain it.
Epidemiological-economic models differ in how the two components are connected (Bonnet et al., 2024[80]). In linked models, epidemiological outcomes are estimated first and then used to drive economic impacts, with no feedback from economic conditions to disease transmission. Fully integrated models instead capture the two‑way interaction between the epidemic and the economy, allowing economic conditions and individual behaviour to feed back into disease transmission. They can also differ in scope. Some apply a common framework across many countries to enable cross-country comparison (Haw et al., 2022[81]), while others provide more detailed analyses of individual countries (Romijn, Stadhouders and Polder, 2025[82]).
The OECD SPHeP-PPR Model
It is a country-specific, age‑stratified compartmental model that incorporates spatial population density mapped in 5x5 km grids. Using discrete time steps of one day, the model predicts disease outcomes by generating a synthetic cohort of individuals that fully replicates the historical profile of a given population in terms of demographic characteristics, risk of infections for selected pathogens, the likelihood of requiring hospital care (i.e. care received in inpatient or intensive care) and mortality, as well as the epidemiology of the disease. The analysis focusses on the first nine months of the outbreak under the assumption that there is no reliable pharmaceutical treatment or vaccine to stem the spread of the outbreak. It does not account for the potential long-term health impacts of pandemics (e.g. on non-communicable disease burden, mental health, long COVID etc.).
As with all models, the OECD SPHeP-PPR Model is a simplification of reality and its results are, therefore, subject to uncertainty. Actual impacts may be more variable than estimated. Nevertheless, by integrating detailed epidemiological, demographic, health system and economic information, the model provides a comprehensive framework for assessing the potential consequences of pandemic outbreaks and response measures.
The OECD model uses social contact matrices to take into account person-to-person contact patterns unique to each country
The risk of disease transmission of communicable diseases depends heavily on who interacts with whom. In settings where the average number of daily contacts is higher, infectious diseases may spread more rapidly and extensively, assuming that all other factors remain the same and no public health measures are put in place to control the spread of the outbreak. Contact patterns can vary considerably by age and by setting (e.g. households, workplaces and schools), within a country and across countries.
The OECD SPHeP-PPR Model accounts for social contact patterns by integrating country-, age‑ and setting-specific synthetic contact matrices developed by Prem and colleagues (Centre for the Mathematical Modelling of Infectious Diseases COVID-19 Working Group, 2021[83]). Contact matrices refer to a systematic approach to depict the patterns and frequency with which individuals from various demographic profiles come into contact with one another in various settings. Integrating contact matrices into the modelling framework can offer important advantages for accurately modelling the disease transmission within the community and identifying the likely containment impact of a range of NPIs.
The OECD model extends the traditional Susceptible‑Infected-Recovered framework
The model categorises individuals into 10 mutually exclusive groups representing their health status (Figure 3.3). At the outset, the model assumes that some or all individuals in a closed population are susceptible to infections, depending on the pathogen. As individuals advance through various compartments reflecting their health status, they are first infected but cannot spread the pathogen (i.e. pre‑infectious). Next, individuals become infectious. Symptomatic patients can be admitted to hospital to receive inpatient or ICU care. The model has two absorbing states: 1) recovery and 2) death.

Note: Greek letters summarise transition probabilities between health states as follows: β = From susceptible to pre‑infectious, = From pre‑infectious to infectious (asymptomatic), = infectious (symptomatic), = From infectious (asymptomatic) to community, ω = From Community to Recovery (for infectious [asymptomatic]), = From Community to Recovery (for infectious [symptomatic]), = From Community to Death (for infectious [symptomatic]), = From infectious (symptomatic) to community, = From infectious (symptomatic) to inpatient care, = From infectious (symptomatic) to ICU care, = From inpatient care to Recovery, = From inpatient care to Death, ζ = From inpatient care to intensive care unit (ICU), = From ICU to Death, = From ICU to Recovery. ICU = intensive care unit.
Source: OECD SPHeP-PPR model.
The probability of death increases as an infected individual proceeds from the community setting to ICU. Transitions across compartments occur depending on (1) effective contact rate and (2) rate of recovery (or death). The effective contact rate determines the transition probability from susceptible to infected whereas the rate of recovery alters the transition probability from the infected to recovered.
The model represents hospital care using two compartments: inpatient care and ICU care. Individuals can enter these compartments through several pathways. Those who require hospital or ICU care can be admitted directly if beds are available on that day of the simulation. Depending on how their symptoms evolve, patients may progress from inpatient care to the ICU. When ICU beds are unavailable, patients who need ICU may instead be admitted to regular hospital wards if inpatient beds are available. Survival probabilities in the model depend on both disease severity and access to care: patients who cannot access hospital or ICU care when needed face a higher risk of death.
The OECD model employs a maximum capacity approach to ascertain healthcare needs
The OECD SPHeP-PPR model employs a maximum capacity approach to simulate the strain on hospital services during outbreaks. To accurately predict the number of days required to reach maximum hospital and ICU capacity in each country, the model makes the following assumptions:
The maximum number of patients that can be hospitalised at a given moment of the simulation coincides with data from national statistics on the number of hospital and ICU beds per capita in the country, as retrieved from Eurostat and World Bank data. This rate is extrapolated for countries with missing data (Özçelik et al., 2024[84]).
At the beginning of the simulation, pre‑pandemic hospital and ICU occupancy rates are used as the baseline. As an outbreak progresses, hospital occupancy rates rise. Even before reaching full capacity, an increasing number of individuals are assumed to be denied hospital and ICU admission. This assumption reflects real-life situations that some hospitals fill faster than others, resulting in some patients lacking access to alternative healthcare facilities. This approach allows the model to simulate the uneven geographical distribution of hospitals within a country.
As the pandemic in the simulation progresses, the pre‑pandemic hospital and ICU occupancy rates within a country are adjusted by a certain percentage to account for non-urgent patients.
During the simulation, ICU bed capacity can be expanded over time as the pandemic scenario progresses. The rate of expansion and the time that it takes to achieve this is country-specific and based on a comprehensive review of the existing literature.
Estimating the economic impact of pandemic outbreaks
Outputs from the OECD SPHeP-PPR model are used as inputs for the economic model developed by the French Observatory of Economic Conjunctures at Sciences Po (Dauvin and Sampognaro, 2021[85]). This is a modified version of a Leontief model, which uses the national input-output tables produced by the OECD for the 51 OECD, EU/EEA and G20 countries included in the analysis and 19 sectors of the economy as defined by the International Standard Industrial Classification of All Economic Activities, Revision 4. The model is designed to capture the simultaneous shocks to both supply and demand, going beyond traditional models, facilitating an in-depth exploration of disruptions in economic activity due to outbreaks as follows:
On the supply side, the model considers factors such as workforce availability and supply chain interruptions, which hindered production capabilities.
On the demand side, the model accounts for changes in consumer behaviour, including reduced spending and shifts in consumption patterns due to social distancing measures or changes in human capital.
By integrating dual shocks, the model provides a nuanced view of the economic impact of the unmitigated outbreak scenarios as well as during the implementation of the various NPIs based on their level of stringency. It highlights the interconnectedness of various sectors and the cascading effects of disruptions across the economy. This holistic perspective is crucial for policymakers to design effective responses and recovery strategies, ensuring that both supply and demand factors are addressed to stabilise and stimulate economic activity.
Economic impacts should be interpreted in the context of each country’s economic structure. In some cases, headline macroeconomic indicators may be influenced by sectoral concentration, export activity or the presence of multinational enterprises. As a result, estimated economic effects may not fully capture changes in domestic economic welfare, although they provide a consistent basis for cross-country comparison. The economic estimates captured by the model do not include the long-run loss of future output associated with premature mortality and should be considered as a conservative measure of the total economic cost.
Source: OECD/WHO/The World Bank (2024[79]), “Strengthening Pandemic Preparedness and Response Through Integrated Modelling”, http://doi.org/10.1787/5f046115-en; Bonnet et al. (2024[80]), “A Scoping Review and Taxonomy of Epidemiological-Macroeconomic Models of COVID-19”, http://doi.org/10.1016/j.jval.2023.10.008; Haw et al. (2022[81]), “Optimizing social and economic activity while containing SARS-CoV-2 transmission using DAEDALUS”, http://doi.org/10.1038/s43588-022-00233-0; Romijn (2025[82]), “Application of an Epi-Econ-Model to Analyze COVID-19 Lockdown Policies in the Netherlands: Lessons and Limitations”, http://doi.org/10.1017/bca.2025.10; Centre for the Mathematical Modelling of Infectious Diseases COVID‑19 Working Group (2021[83]), “Projecting contact matrices in 177 geographical regions: An update and comparison with empirical data for the COVID-19 era”, https://doi.org/10.1371/journal.pcbi.1009098; Özçelik et al. (2024[84]), “Estimating the return on investment of selected infection prevention and control interventions in healthcare settings for preparing against novel respiratory viruses: modelling the experience from SARS-CoV-2 among health workers”, http://doi.org/10.1016/j.eclinm.2023.102388; Dauvin and Sampograno (2021[85]), “Dan les coulisses du confinement: modelisation de chocs simultanes d'offre et de demande. Une application au confinement du mois d’avril 2020 en France”, https://www.ofce.sciences-po.fr/pdf/dtravail/OFCEWP2021-05.pdf.
The remainder of the chapter focusses on the first objective, whereas methodologies and results related to the second objective are presented in Chapter 7. An unmitigated pandemic outbreak is unlikely in real-world settings given that, for example, population mortality would rise rapidly and, even in the event of no governmental action, individuals would be likely to start readopting behaviours learned during the COVID‑19 pandemic. This expectation is consistent with emerging evidence that people adapted their behaviours beyond legally mandated restrictions during the pandemic, with voluntary avoidance strongly correlating with local COVID‑19‑related deaths (Goolsbee and Syverson, 2021[86]). Nonetheless, these simulations are important for at least three reasons:
Outputs help confirm the internal validity of the model by ensuring consistency across various dimensions (e.g. predicted number of deaths over time should align with the progression of the outbreak in terms of the number of infections) and by comparing against empirical evidence from other studies;
Outputs can serve as a stress test to evaluate the resilience of healthcare services in the face of an emerging pandemic. Similar to stress tests conducted in other sectors, such as banking, this analysis involves a hypothetical extreme shock that exceeds what is likely to occur, which helps identify potential vulnerabilities and prepare for worst-case scenarios; and
Results from the unmitigated spread of infections provide a common baseline for comparing other analyses that entail the scale up of various NPIs modelled in Chapter 7, which, in turn, facilitates understanding the potential of NPIs and underlining the importance of timely and effective action.
The five pandemic scenarios modelled in this chapter broadly reflect the epidemiological characteristics of pathogens of pandemic potential as follows (Table 3.2):
Ebola-like outbreak represents a pathogen with lower transmission but extremely high severity, testing healthcare systems’ ability to manage critical cases.
Avian influenza-like outbreak models a new animal-to-human influenza strain with high levels of hospitalisation and case fatality.
Influenza A-like outbreak simulates a highly transmissible but less severe flu virus, representing a classic fast-spreading pandemic.
Coronavirus-like outbreak is a simulation of a novel coronavirus, characterised by asymptomatic spread and age‑dependent severity.
Measles-like outbreak is the most extreme scenario, featuring a hyper-infectious agent in a non-immune population.
While each scenario draws on the epidemiological profile of a specific pathogen, the parameters used in the OECD model are not intended to replicate the exact dynamics of those diseases. Rather, they are designed to represent a range of plausible outbreak archetypes that differ in transmissibility, severity and the pressure they can put on health systems. The OECD model does not distinguish between modes of transmission, even though the five pathogens span different real-world routes from direct contact with bodily fluids in Ebola virus disease to airborne spread in measles. The model uses the same underlying logic and structure to simulate each pandemic scenario (e.g. the same population size, healthcare capacity limits etc.) to ensure that differences in outcomes reflect the epidemiological assumptions and country characteristics and not unrelated modelling quirks.
Notes: CFR = case fatality rate, ICU = Intensive care unit, = Basic reproduction number.
Source: OECD review of the existing evidence base.
3.5.1. Health impacts
Figure 3.4 illustrates the pandemic curves that depict how the share of population infected evolves over time, expressed in days, under five unmitigated outbreak scenarios. The figure presents the average across the 51 countries included in the analysis, with shaded areas indicating cross-country variability. For instance, the measles-like outbreak shows a smaller shaded area, indicating less cross-country variability compared to the other scenarios and, similarly, slightly different cross-country variability patterns can also be discerned between, for example, avian influenza-like outbreak and influenza A-like outbreak. This suggests that:
Pathogen-specific factors are crucial in shaping the progression of the disease. For example, in an outbreak driven by a measles-like agent with such high infectivity, other factors tend to become secondary in influencing the evolution of the outbreak.
Country-specific factors such as demographics and social contact patterns are pivotal in the progression of epidemics when the infectivity of the pathogen is lower. This is particularly evident in the influenza A-like outbreak, where two epidemic peaks can be observed, approximately 7‑10 days apart, indicating that the agent spreads at varying speeds across different populations. Country-specific outputs (not shown) also show that epidemic peaks can occur across a range of days, anywhere from 74‑264 days after the onset depending on the country.
Figure 3.4 shows that all five scenarios modelled in the analysis could lead to large scale outbreaks. The most severe outbreak would be caused by a measles-like agent, with infections quickly rising to around 62.3% of the population (min: 55.8%, max: 69.5%) in 83 days before tapering off. This scenario depicts a rapid outbreak with a steep peak that can burden the healthcare system in a relatively short period.
By contrast, an outbreak caused by an Ebola-like agent reflects a more gradual rise in infections. By the end of the 9‑month simulation period, the outbreak would fall short of reaching a peak. This means that the outbreak would still be in its growth phase (i.e. remains 1) by the end of the simulation whereby the susceptible population would have been depleted for transmissions to start declining. In this outbreak scenario, infections would spread over a longer period, limiting the immediate strain on healthcare resources but prolonging the duration of the pressure on the healthcare systems.
The remaining scenarios would fall between these two extremes. The outbreak caused by a coronavirus-like agent would peak on the 111th day with about 23.6% of the population (min: 14.5%, max: 29.6%) being infected, whereas an outbreak caused by an H5N1‑like agent would lead to an extended outbreak with a lower peak on the 192nd day. These findings are aligned with emerging evidence. For example, one earlier modelling study showed that highly transmissible pathogens with higher would lead to rapid surges in the number of infections and steep epidemic peaks, whereas less transmissible pathogens would create more prolonged epidemic curves (Vallée, Faranda and Arutkin, 2023[136]).
Share of the population infected over time, unmitigated outbreaks, by scenario
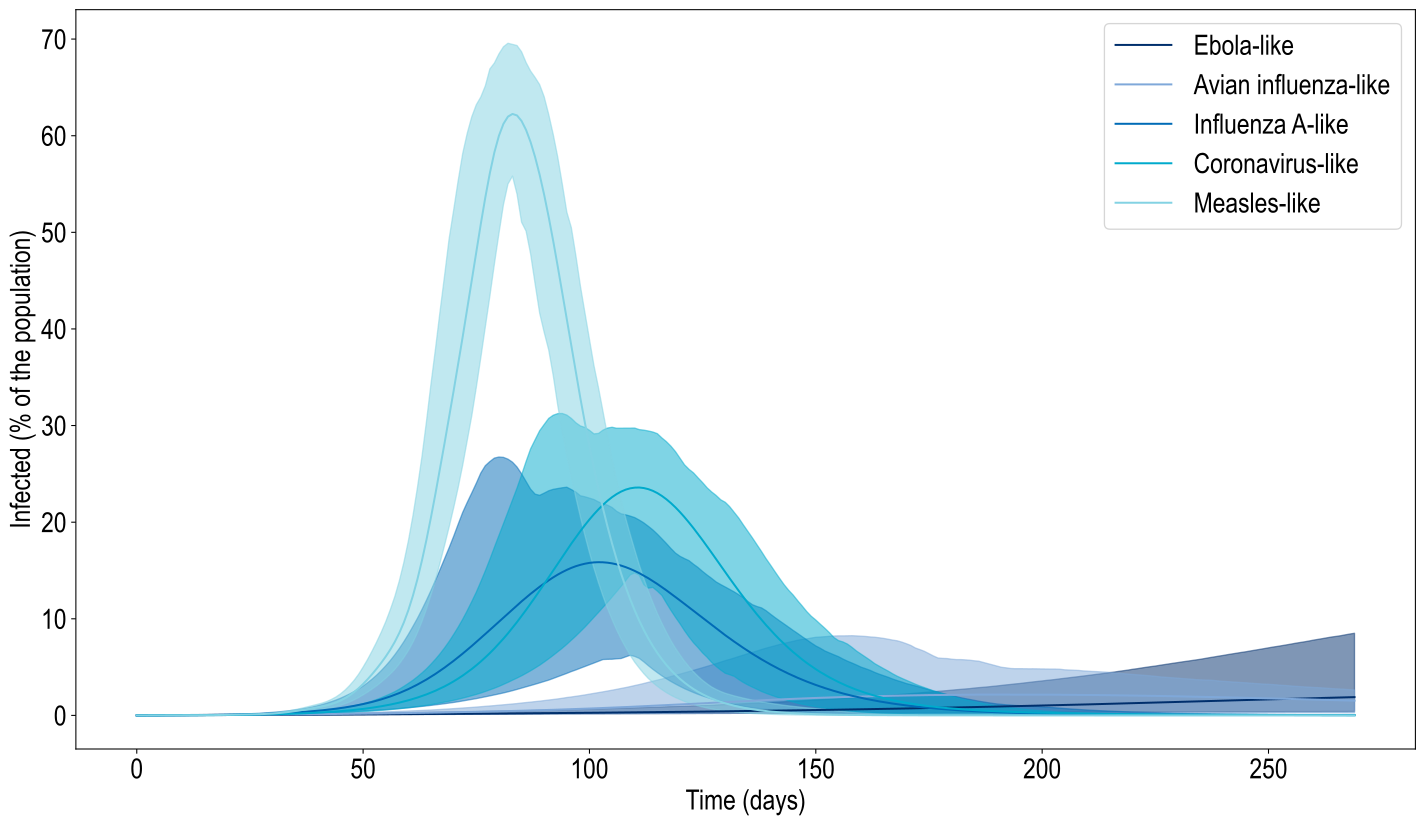
Note: The figure presents the cross-country average across the 51 OECD, EU/EEA and G20 countries included in the analysis, with the shaded areas indicating cross-country variability. Evolution of the pandemic is expressed in days. Each outbreak is simulated to last for 9 months.
Source: Analysis based on the SPHeP-PPR model.
Figure 3.5 illustrates the proportion of the population that would succumb to the outbreak by the end of each simulation. As previously mentioned, mortality depends not only on how widely the infection spreads but also how deadly the pathogen is. A highly infectious agent such as the one in the measles-like outbreak could spread rapidly, infecting a huge number of the population. The sheer number of infections would drive the high death toll, even though the CFR of the measles-like agent is lower than the CFR of an extremely lethal agent such as the one in the Ebola-like outbreak. This is the case for the mortality toll of the modelled scenarios. The measles-like outbreak would be the most severe, with 20.3% of the population losing their lives, on average, across the 51 countries included in the analysis. The lowest level of mortality would be observed in Japan (17.2%) whereas the highest fatality would be in India (21.4%). Pandemics caused by influenza A-like and avian influenza could also have substantial impacts, with mortality averaging at 5.4% and 4.3% of the population respectively. Both scenarios show large cross-country variations. In both scenarios, Italy would face the most severe mortality burden, potentially reaching as high as 14.2% in an avian influenza outbreak and 8.3% in an outbreak caused by influenza A-like pathogen. In comparison, Germany would face the least severe mortality burden with an estimated loss of 0.2% and 0.5% of its population respectively.
Share of population losing their lives by the end of the simulation, unmitigated outbreaks, by country and scenario

Note: Countries are sorted from left to right from lowest to highest percentage of population losing their lives under the Ebola-like outbreak (e.g. a value of 23.9 in the Ebola-like outbreak scenario in Italy means 23.9% of the Italian population is estimated to lose their lives due to an Ebola-like pathogen by the end of the 9‑month simulation period). Averages for different country groupings are unweighted.
Source: Analysis based on the SPHeP-PPR model.
3.5.2. Impact on healthcare system resilience
When outbreaks spread without mitigation, they can rapidly overwhelm healthcare systems. Figure 3.6 reports how quickly ICU beds are exhausted under different scenarios for the 51 countries included in the analysis. In nearly all scenarios, existing capacity falls far short of the surge in demand. Depending on the scenario, ICU capacity across the 51 countries included in the analysis would be exhausted within 9 to 139 days.
Across the 51 countries, outbreaks caused by avian influenza and influenza A-like agents would be the most alarming, with ICUs reaching full capacity, on average, within 28.6 days (min: 8.8 days, max: 107 days) and 39.8 days (min: 21.7 days, max: 90.1 days) respectively. In the avian influenza outbreak, in countries such as Ireland and Indonesia, ICU capacity could be saturated within 8.8 and 9.1 days respectively, leaving little time for health systems to meet the rapid rise in demand.
A measles-like outbreak also poses major risks for health systems, though the timeline of the saturation is longer at an average of 45.6 days (min: 29.9 days, max: 61.4 days), leaving slightly more room for response. In an outbreak caused by a coronavirus-like agent, ICUs remain under far less pressure where full ICU capacity is reached in 77.3 days (min: 52.6 days, max: 139 days).
Surge capacity would provide only temporary relief but cannot compensate for the rapid spread of outbreaks. Even expanding ICU capacity to 130% of non-emergency levels, similar to measures taken early in the COVID‑19 pandemic, would only slightly extend the healthcare systems’ ability to manage the outbreaks, by approximately an additional 5.4 to 18.6 days, depending on the outbreak. This finding suggests that mitigation of the spread is the only viable strategy to avoid the collapse of healthcare systems.
Number of days it takes to reach or exceed ICU capacity, unmitigated outbreaks, by country and scenario

Note: Countries are sorted from left to right from lowest to highest number of days to reach 100% ICU capacity in each pandemic scenario (e.g. a value of 58.6 in the avian influenza-like outbreak scenario in Japan means it would take 58.6 days to reach 100% ICU capacity during an avian influenza like outbreak). Each outbreak is simulated to last for 9 months.
Source: Analysis based on the OECD SPHeP-PPR model.
As a complementary step, the model also estimated how much ICU capacity would need to expand to meet the excess demand during an unmitigated outbreak (Figure 3.7). It is important to stress that this exercise is purely theoretical, as scaling up ICU beds to the required levels would not be feasible in practice. The measles-like outbreak scenario would be the most extreme, with the 51 countries included in the analysis needing, on average, 72.3‑fold increase in ICU beds to meet the excess demand due to the outbreak. The influenza A-like outbreak would also lead to substantial upscaling, requiring, on average, 58.1‑fold expansion of current capacity, while an outbreak caused by a coronavirus would call for a more modest expansion of the order of 4.5 times, on average, though some countries such as India would still need to increase their ICU capacity by 25.7‑fold. Combined, these results suggest that solely relying on surge capacity remains insufficient to meet the surge demand in most outbreak scenarios.
Increase in ICU capacity to meet the pandemic demand

Note: Countries are sorted from left to right from lowest to highest increase in ICU bed capacity to meet the demand for ICU beds in an Ebola-like outbreak. A value of 6.6 in the influenza A-like outbreak in the Czech Republic (hereafter ‘Czechia’) means the ICU bed capacity would need to be scaled up 6.6 times to meet the demand during an influenza A-like outbreak. Each outbreak is simulated to last for 9 months.
Source: Analysis based on the OECD SPHeP-PPR model.
Beyond ICU capacity, a surge in infections during outbreaks could stretch other essential components of the healthcare systems. Experiences from the COVID‑19 pandemic demonstrated that meeting the surge in demand goes far beyond adding more hospital or ICU beds (Grasselli, Pesenti and Cecconi, 2020[137]). Critical care equipment (e.g. ventilators), consumables and pharmaceuticals might need to be rapidly scaled up to meet patient needs (Phua et al., 2020[138]) but these resources can become scarce during large outbreaks, if the global supply chains cannot keep up with the simultaneous surge in demand across countries. Equally important is the human factor. Expanding capacity would depend on mobilising a much larger pool of healthcare professionals (e.g. ICU nurses), but the health workforce cannot be increased substantially in a short period of time (Vera San Juan et al., 2022[139]). The prolonged pressure on existing health personnel could also lead to fatigue, absenteeism and burnout (Aymerich et al., 2022[140]; Morgantini et al., 2020[141]), further compromising the system’s ability to deliver care. Other parts of the health infrastructure (e.g. laboratory capacity) could also face unprecedented pressure (Phua et al., 2020[138]).
3.5.3. Economic impacts
Figure 3.8 shows that during the initial nine months of the unmitigated outbreak, GDP is projected to decline, on average, by 2.7% to 16.2% across 50 countries included in the analysis, depending on the scenario. A measles-like outbreak could result in the highest levels of collapse, with almost every sector contracting by around 16% or more. A coronavirus-like outbreak could shrink the economy, on average, by around 2.7%, reflecting a milder but still disruptive shock. The economic impact of the other outbreaks would fall within these two scenarios, from 3.4% in an Ebola-like outbreak to 5.5% in an influenza A-like outbreak. In reality, countries would likely intervene to attenuate the economic consequences of the outbreak, as they did during the COVID‑19 pandemic through policies such as job retention programmes and monetary easing. The unmitigated outbreak scenarios presented in Figure 3.8 do not account for such policy responses.
Some sectors are consistently more exposed to shocks than others. The transportation and storage, manufacturing, administrative and support services activities and professional, scientific and technical activities would show distinct but consistently severe patterns of contraction. The transportation and storage sector could experience by far the steepest losses, contracting, on average, between 13.4% and 18.9% in outbreaks caused by a coronavirus-like and by a measles-like agent respectively. Manufacturing would follow a similar trajectory but at a lower magnitude, with the average declines ranging from 5.9% to 16.2% depending on the scenario. Both the administrative and support services, and professional, scientific and technical activities sectors could experience contractions of the order of 4.2% to 5.5% in four scenarios, while collapsing by, on average, 16.1% in the measles-like outbreak.
Service‑based sectors such as education, human health and social work activities, public administration and defence, compulsory social security, and information and communication sectors would experience the lowest levels of contraction, reflecting their relative insulation from immediate demand shocks. In the first four outbreak scenarios, the education and human health and social work sectors are projected to contract from 0.5% to 4.5%. Similarly, public administration and defence, compulsory social security and information and communication sectors would also experience relatively modest declines between 1.5% and 4.4%. These sectors would not be insulated in the case of an outbreak caused by a measles-like agent, with average losses of around 16%.
The differences in GDP contraction across sectors are explained by several factors. On the demand side, sectors that rely heavily on face‑to-face interactions or discretionary spending (e.g. transportation) would experience sharp declines. By contrast, sectors such as health and education could face relatively stable or even increased demand, as they are often classified as essential services and therefore remain fully or partially operational during outbreaks (European Commission, 2021[142]). On the supply side, disruptions depend on the ability of firms to maintain operations amid workforce and input shortages and restrictions on mobility. Transport and storage and manufacturing sectors would be particularly vulnerable, whereas service‑based sectors, especially those that can operate remotely (e.g. information and communication sector) face fewer physical bottlenecks. However, in severe outbreaks, both demand and supply channels would deteriorate simultaneously.
Percentage of GDP contracted during the first nine months of unmitigated outbreaks by sector
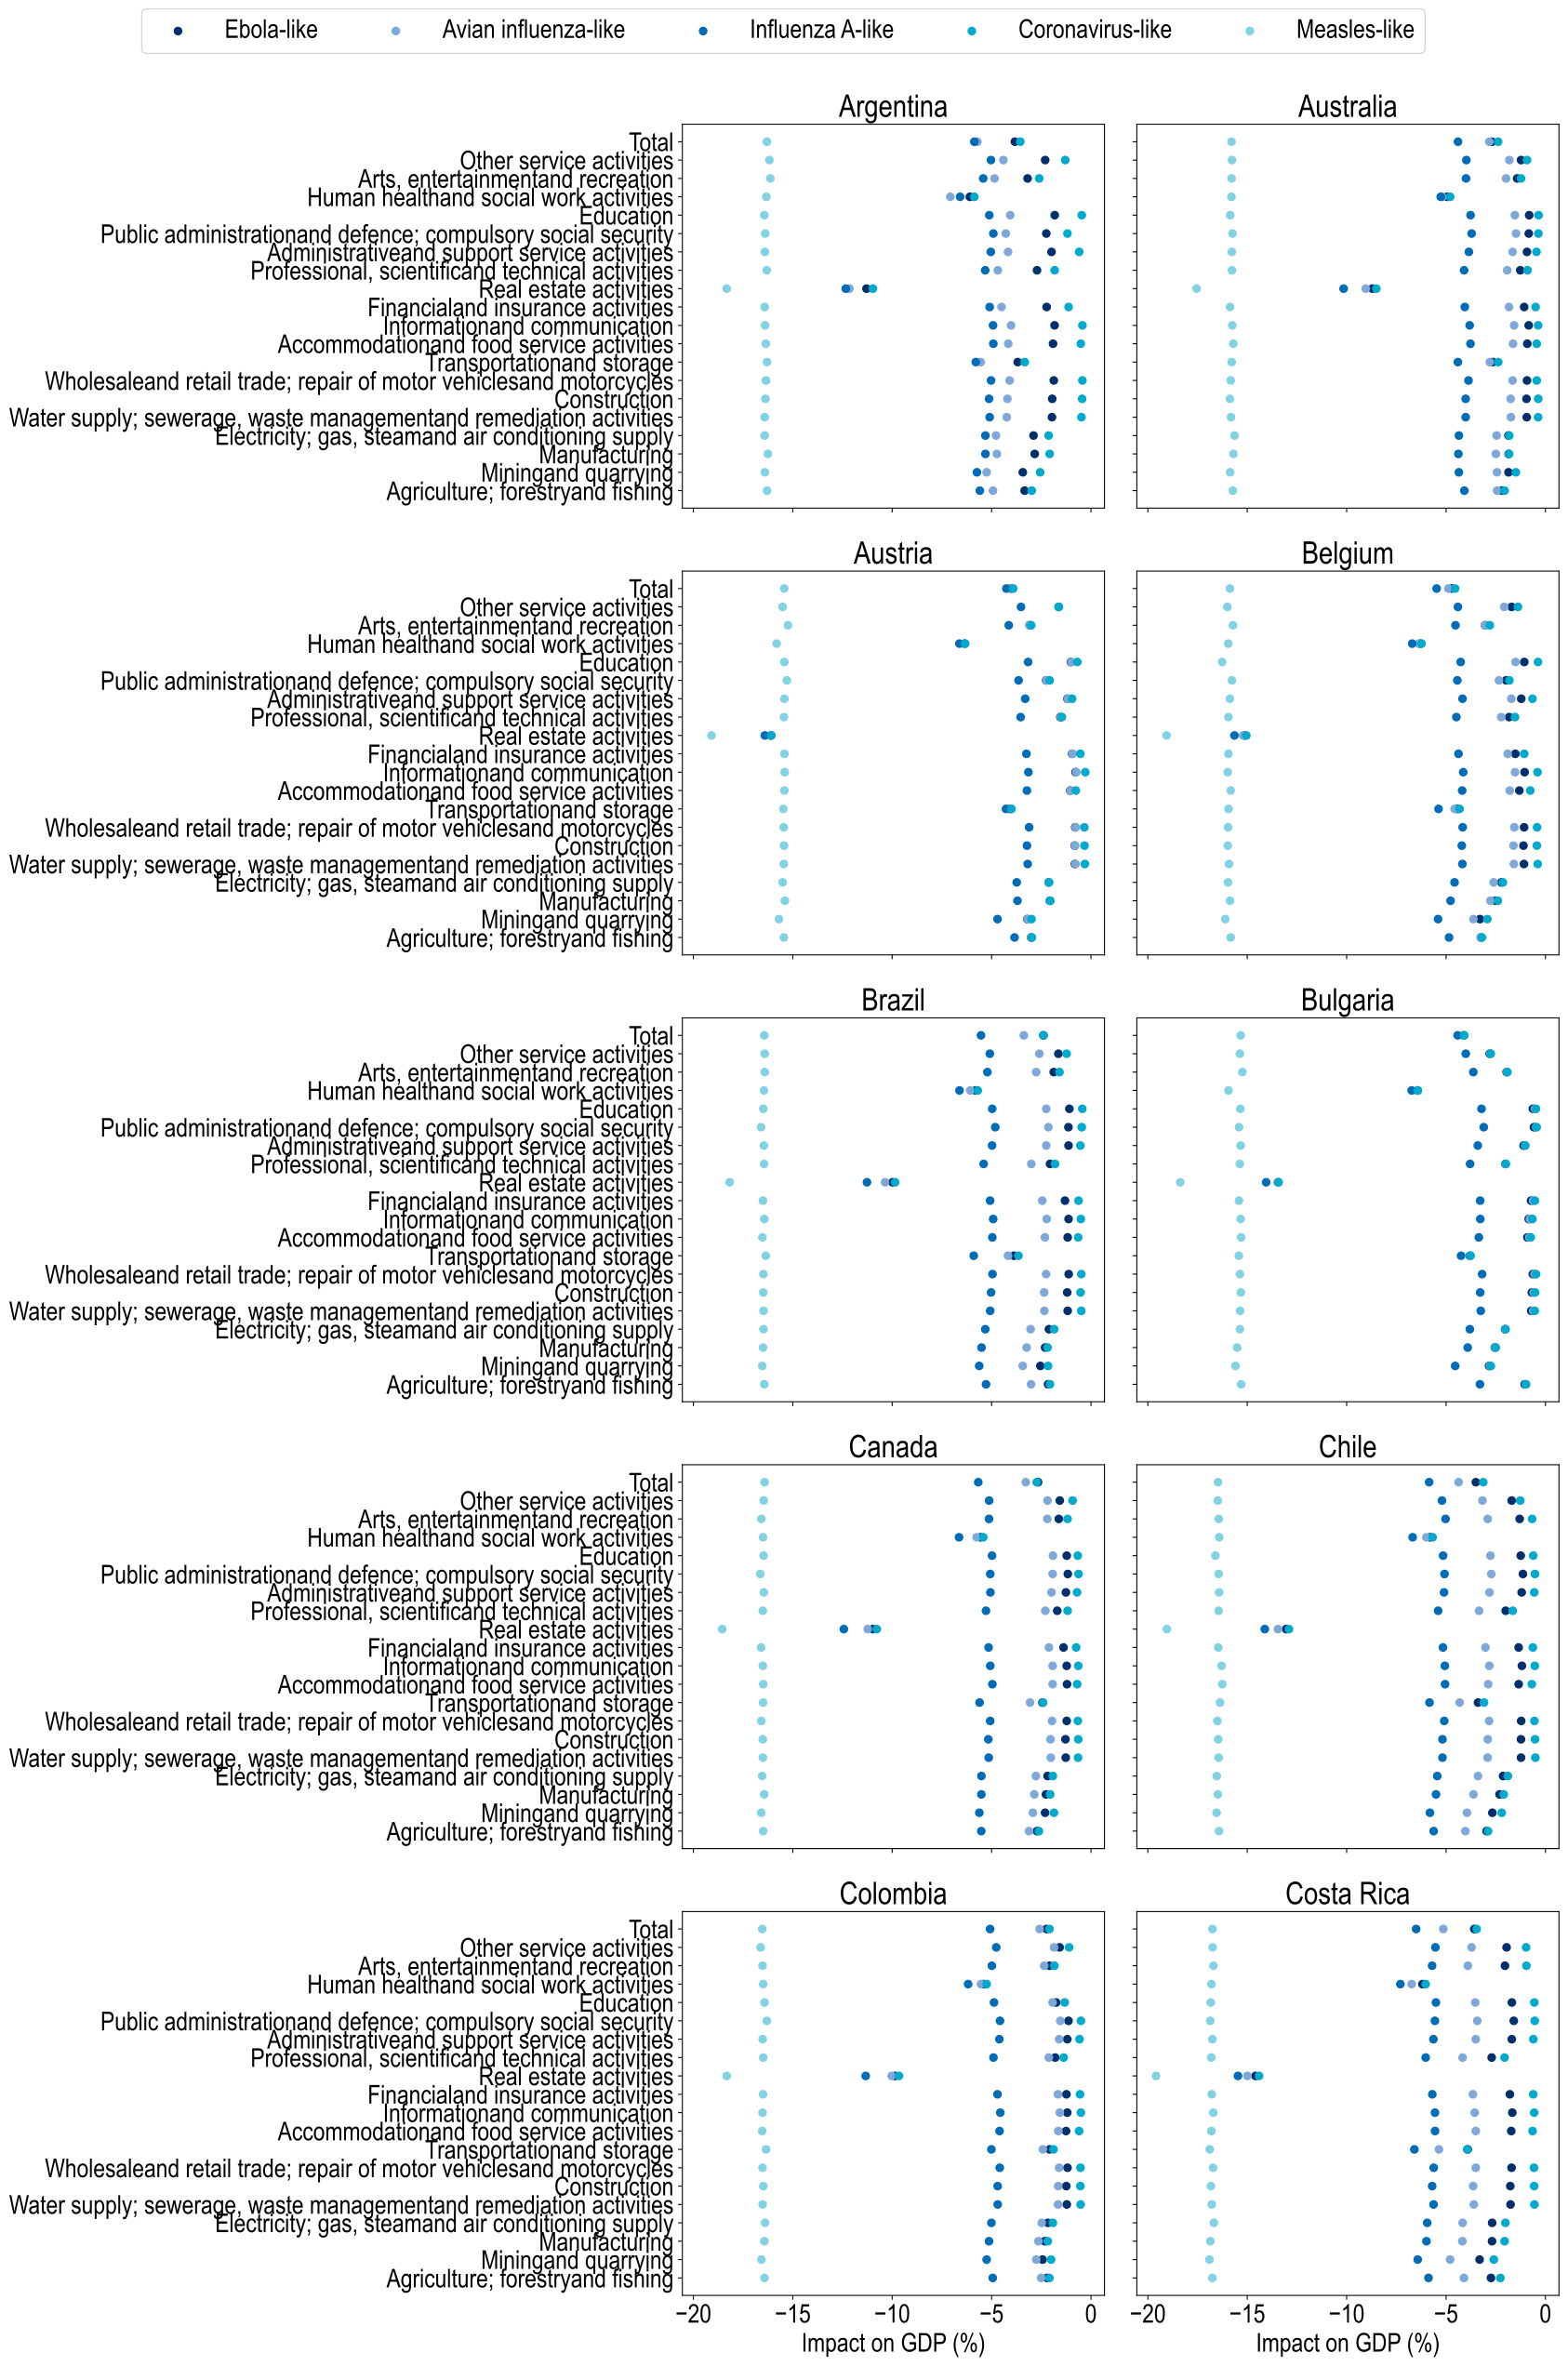
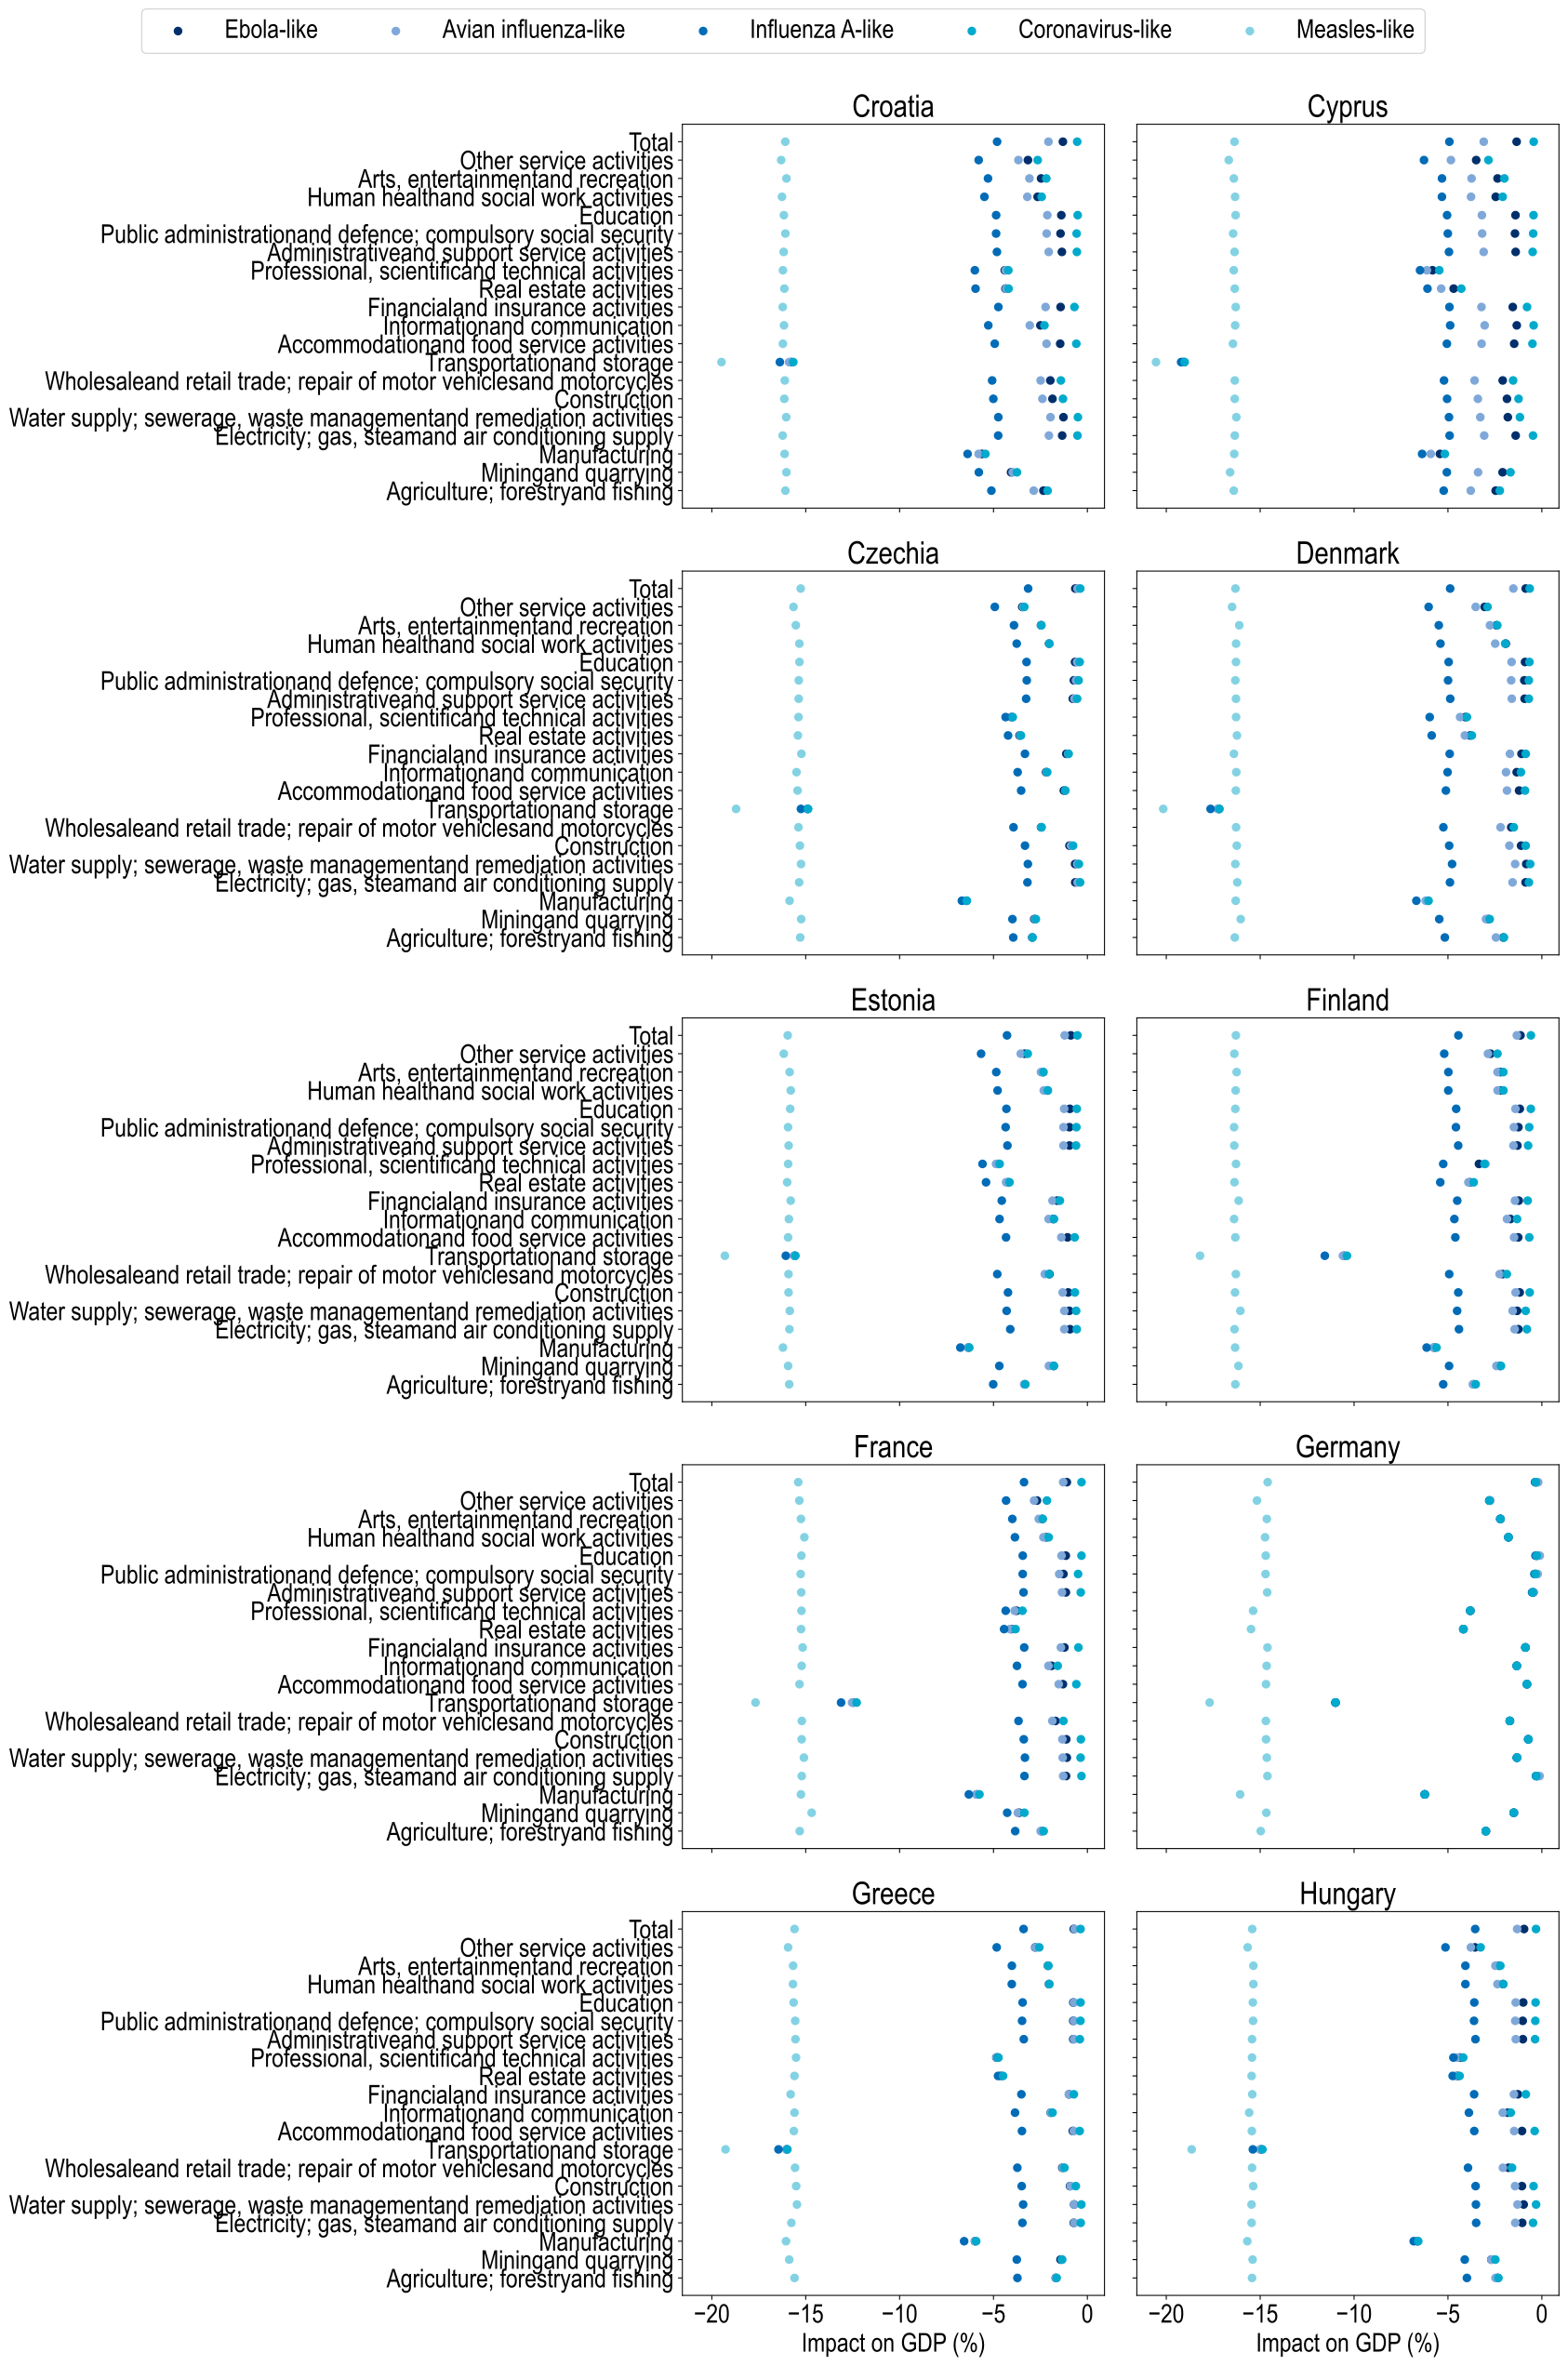
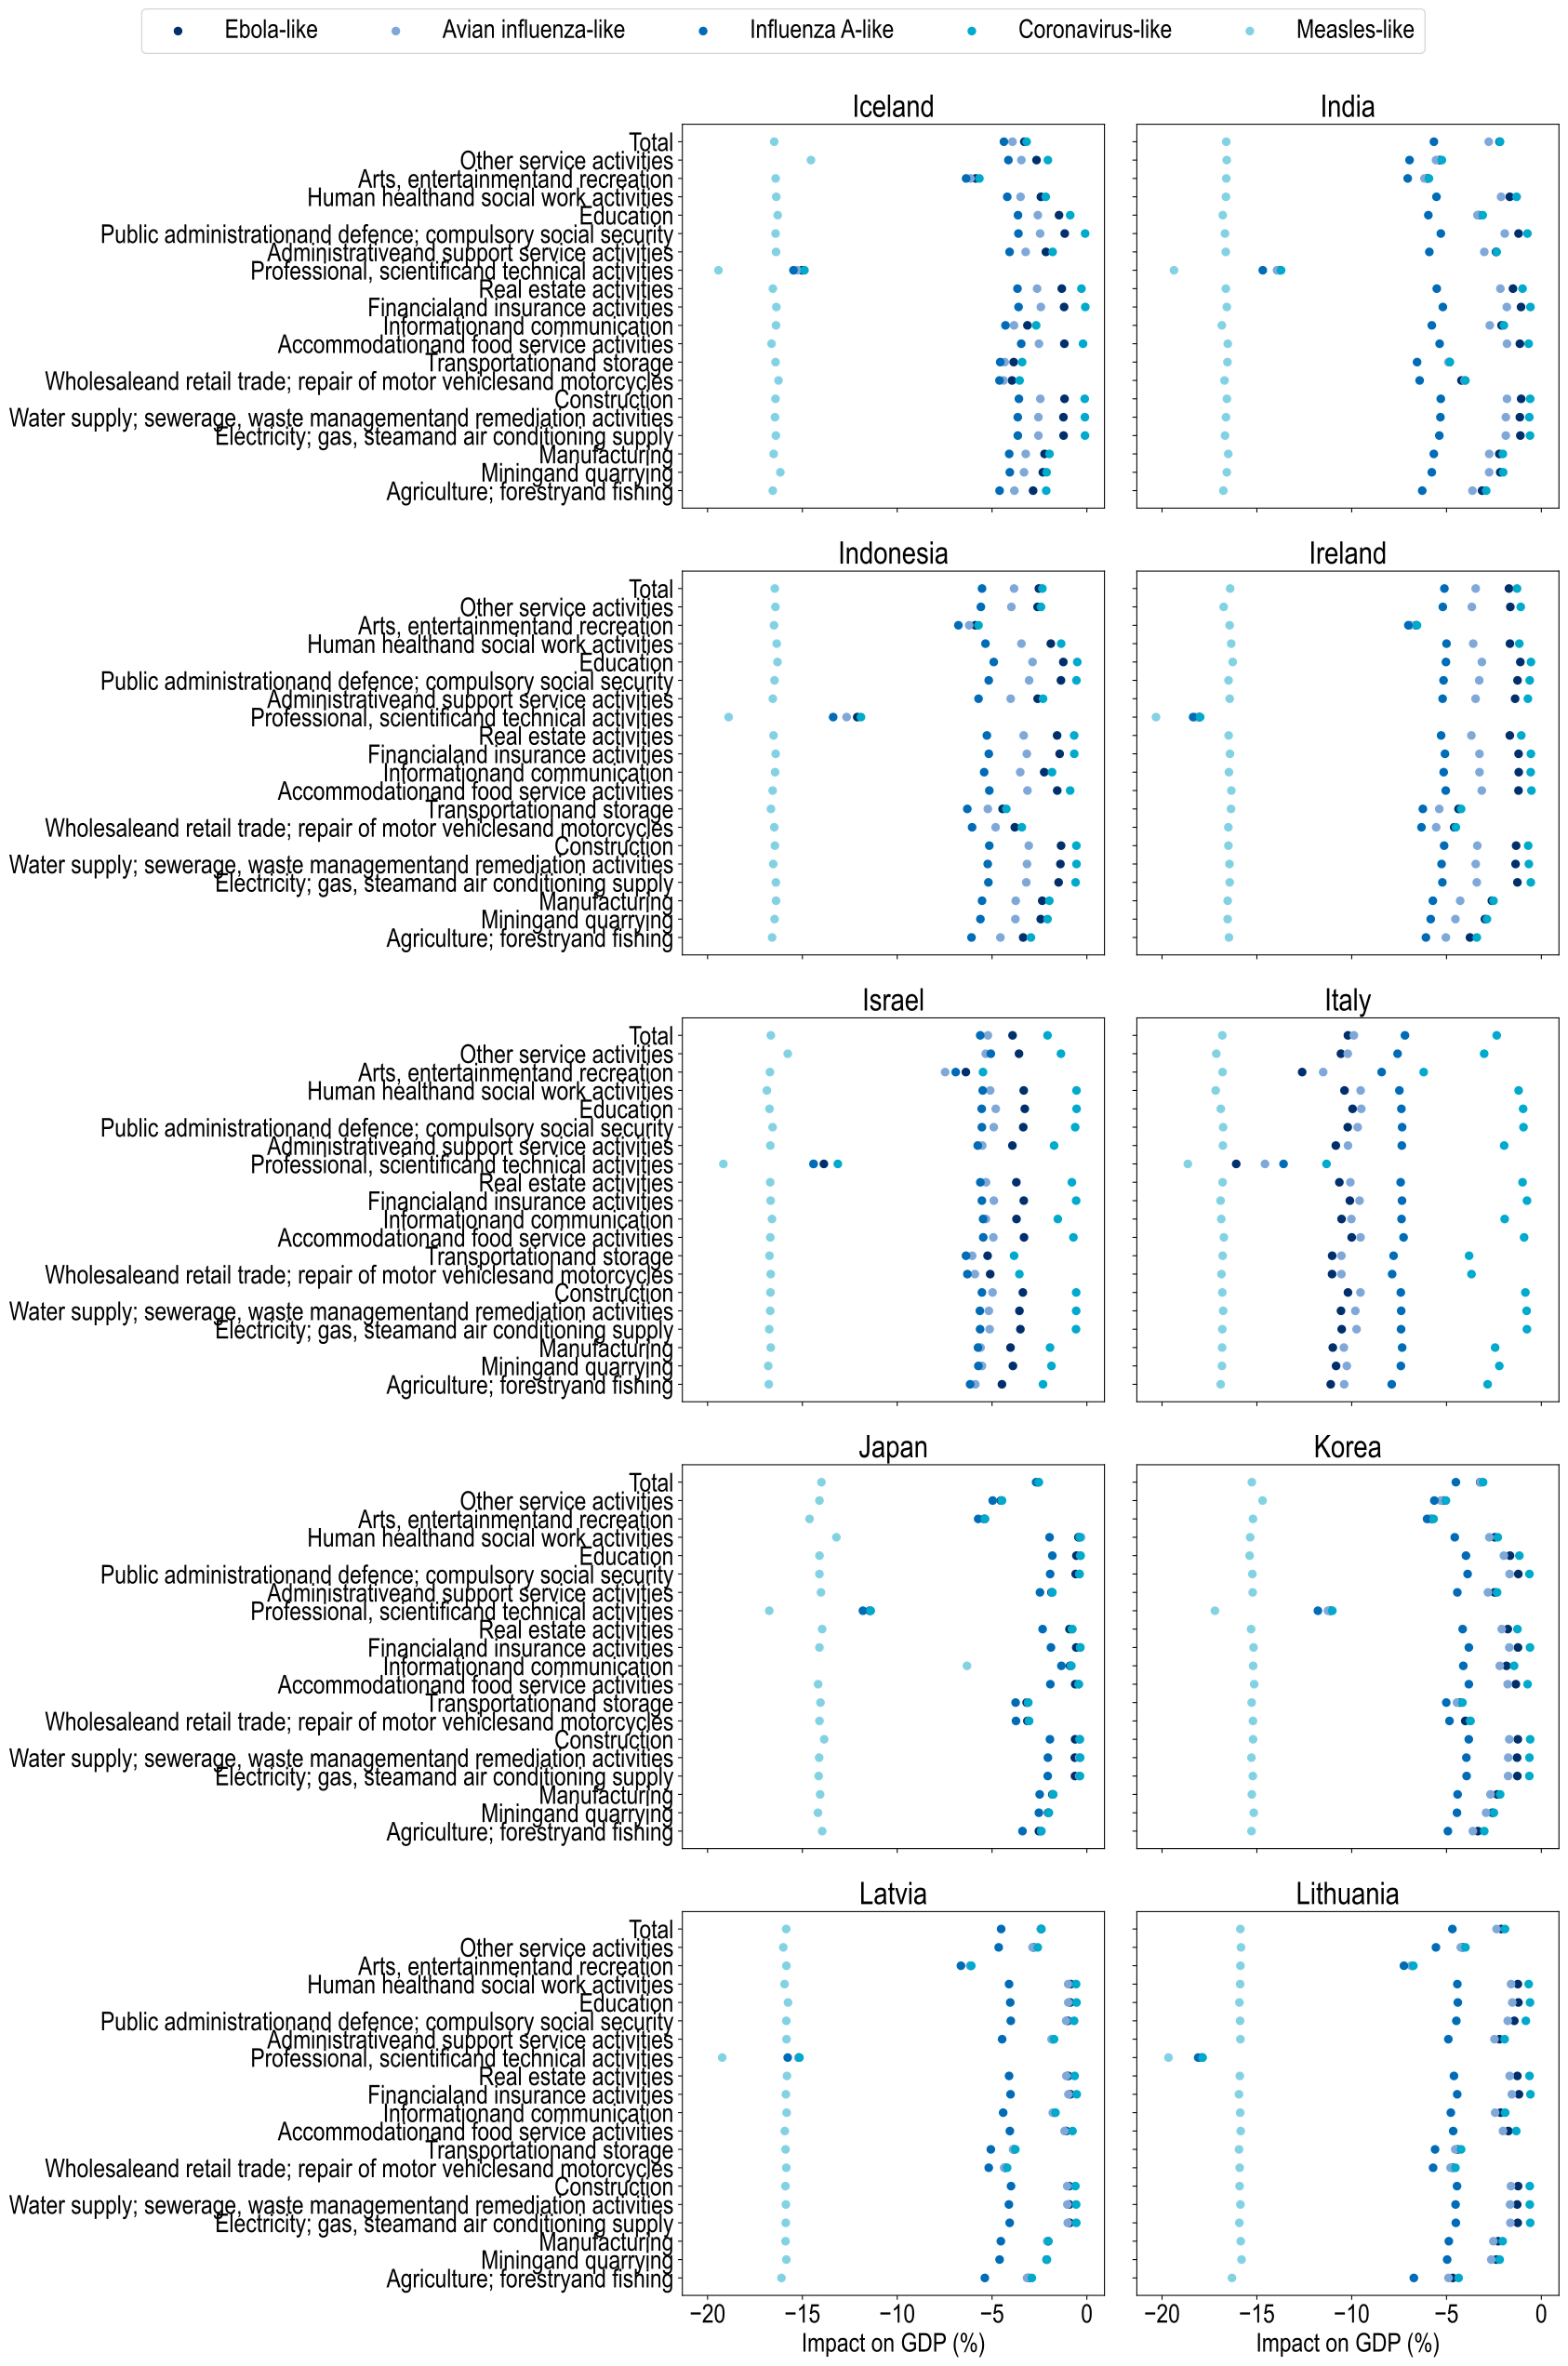
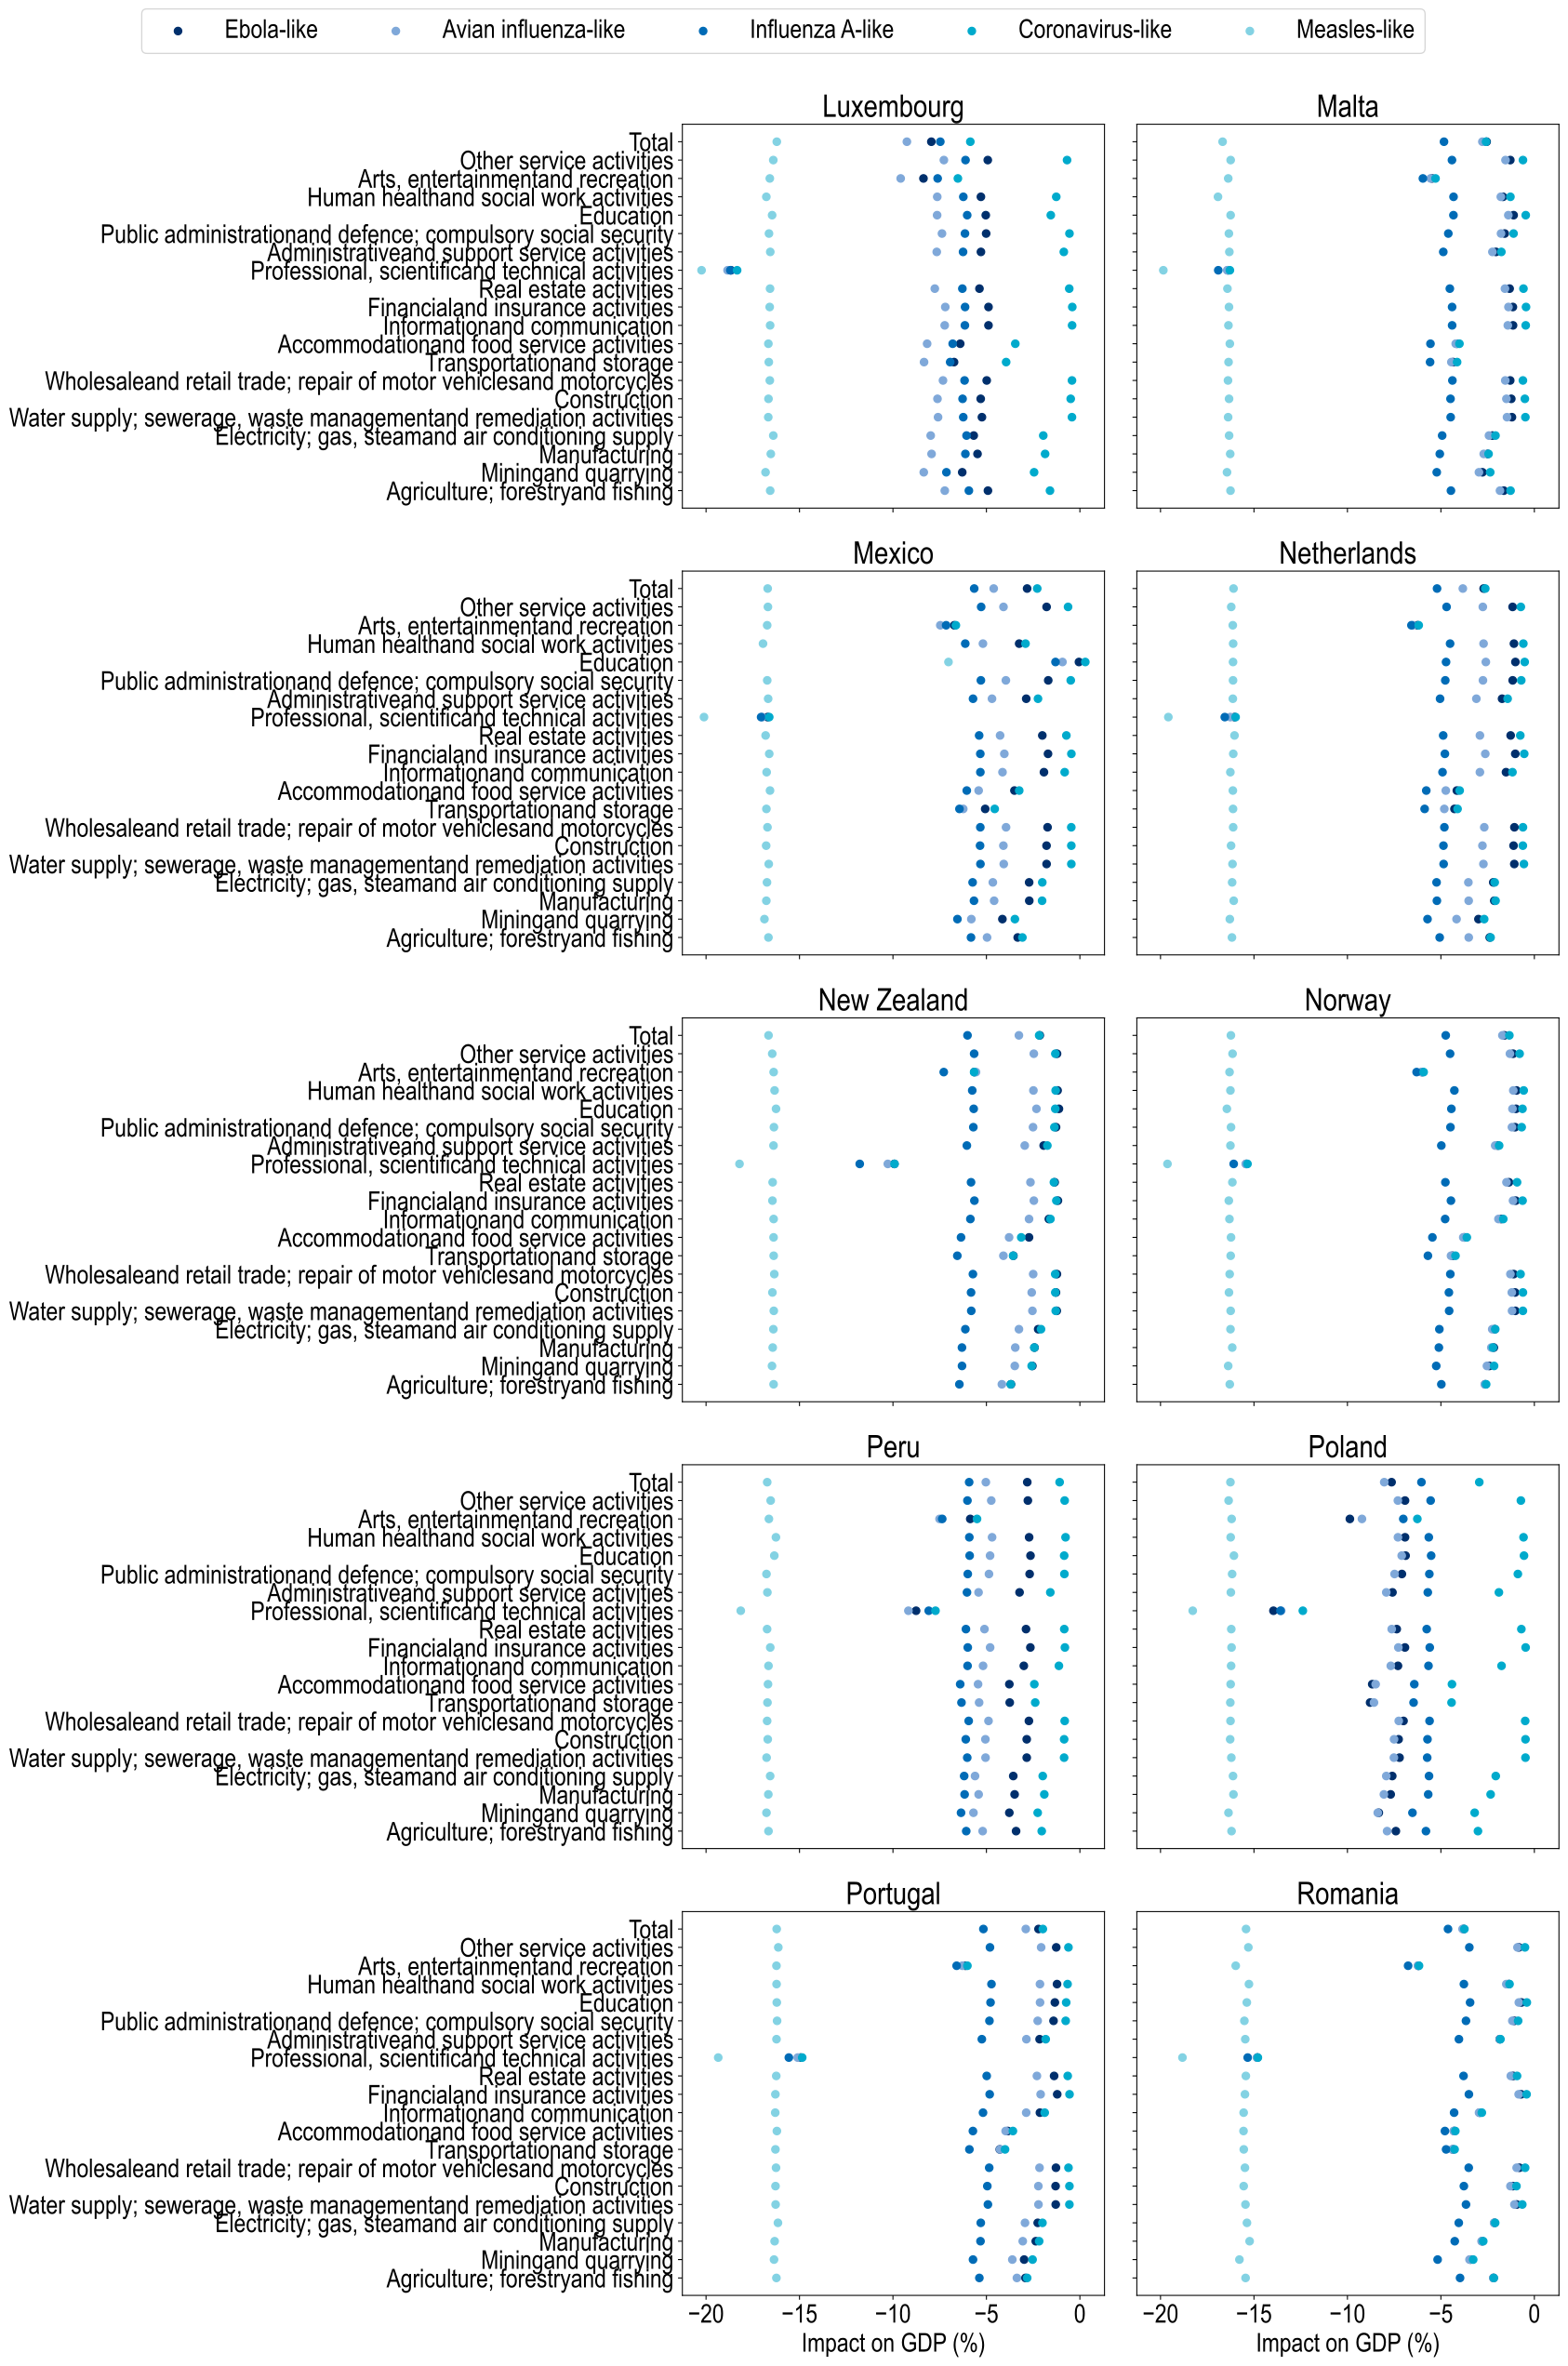
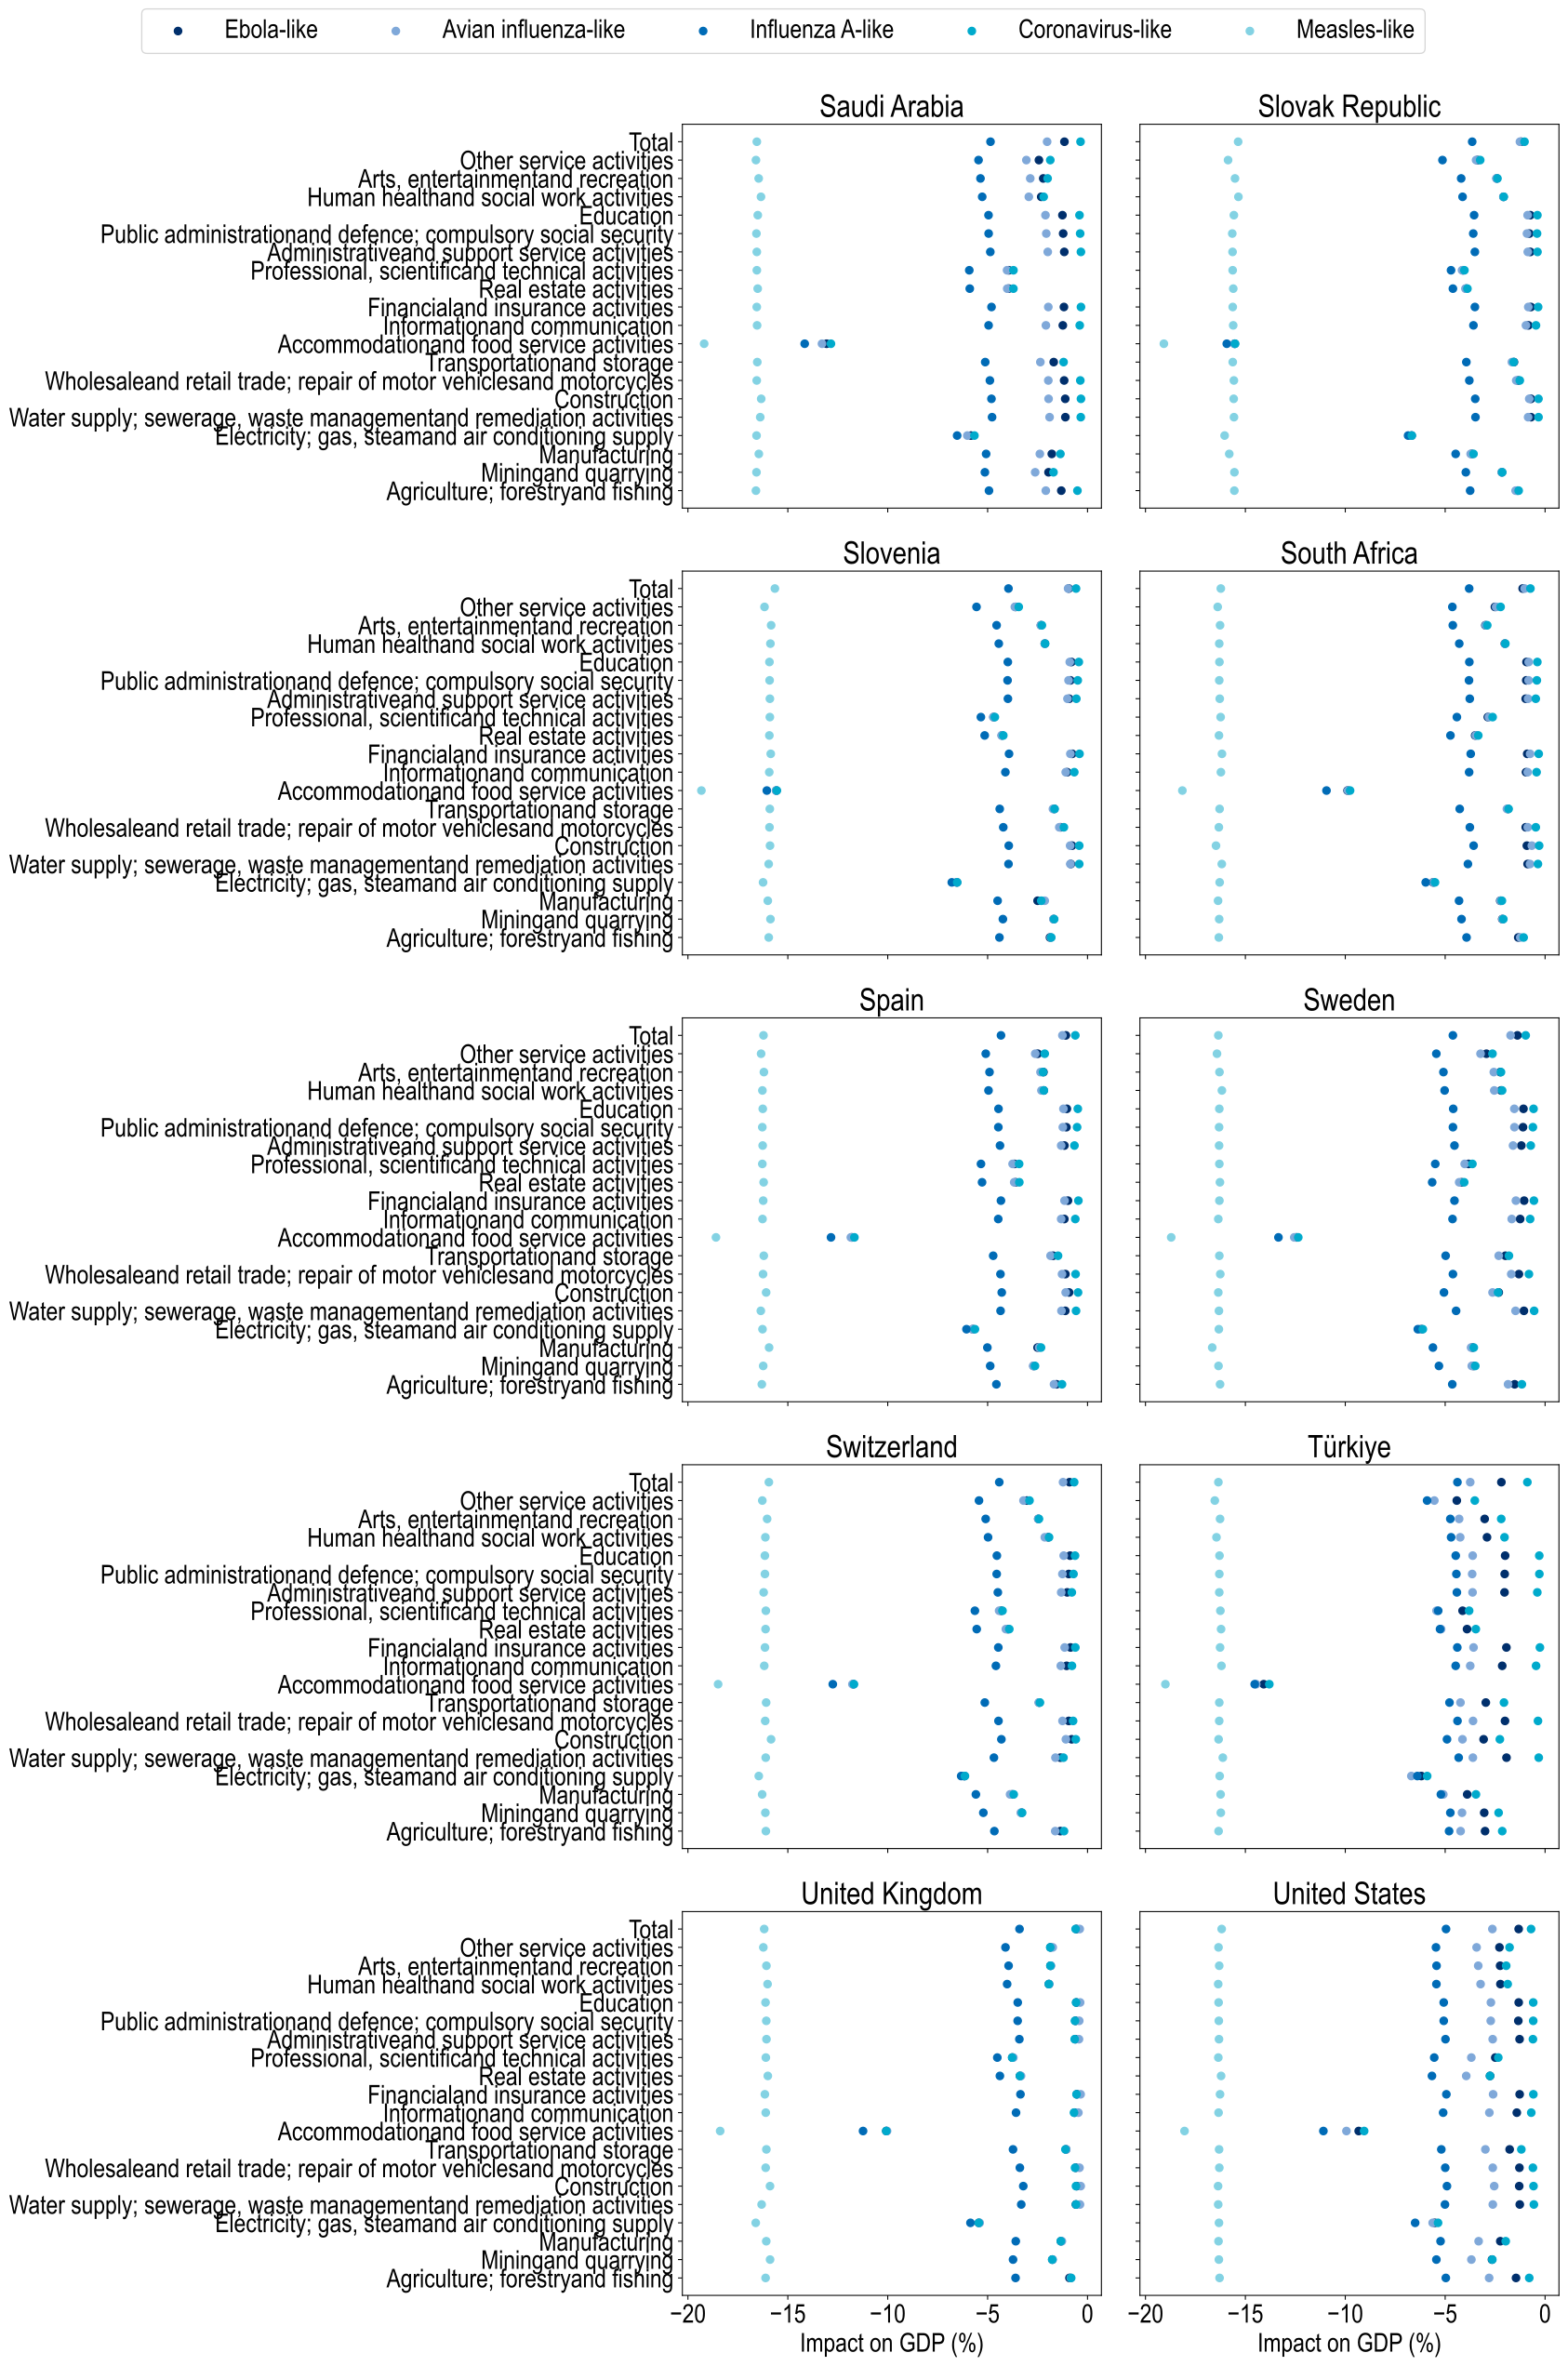
Note: Sectors of the economy include: Agriculture, forestry and fishing; mining and quarrying; manufacturing; electricity, gas, steam and air conditioning supply; water supply, sewerage, waste management and remediation activities; construction; wholesale and retail trade, repair of motor vehicles and motorcycles; transportation and storage, accommodation and food service activities; information and communication; financial and insurance activities; real estate activities; professional, scientific and technical activities; administrative and support service activities; public administration and defence, compulsory social security; education; human health and social work activities; arts, entertainment and recreation; and other service activities.
Source: Analysis based on the OECD SPHeP-PPR and the FOEC models.
This chapter assessed the potential health and economic consequences of pandemic outbreaks across five illustrative scenarios reflecting pathogens of pandemic potential. The results indicate that unmitigated outbreaks could cause severe health impacts and place substantial strain on healthcare systems, with outcomes varying widely across countries depending on both pathogen characteristics and national contexts.
The analysis also highlights the significant economic disruption that pandemics can generate. Across 51 countries, GDP could contract by 2.7% to 16.2%, depending on the scenario, with the transport, manufacturing and professional services sectors among the most affected. These estimates are likely conservative, as the model does not account for the long-term health and economic repercussions of future pandemics. The findings of the chapter underscore the need for sustained investment in PPR capacities. Building on lessons from COVID‑19, subsequent chapters examine the health and economic impact of scaling up NPIs to mitigate pandemic impacts (Chapter 7) and estimate the cost of investing in the strengthening of PPR capacity (Chapter 8).
References
[45] Adalja, A. et al. (2018), The characteristics of pandemic pathogens: Improving Pandemic Preparedness by Identifying the Attributes of MIcroorganisms Most LIkely to Cause a Global Catastrophic Biological Event, https://www.centerforhealthsecurity.org/our-work/pubs_archive/pubs-pdfs/2018/180510-pandemic-pathogens-report.pdf (accessed on 5 April 2023).
[9] AITA (2023), Global Outlook for Air Transport: Highly Resistant, Less Robust, https://www.iata.org/en/iata-repository/publications/economic-reports/global-outlook-for-air-transport----june-2023/ (accessed on 18 October 2025).
[93] Andronico, A. et al. (2019), “Highly pathogenic avian influenza H5N8 in south-west France 2016–2017: A modeling study of control strategies”, Epidemics, Vol. 28, p. 100340, https://doi.org/10.1016/j.epidem.2019.03.006.
[140] Aymerich, C. et al. (2022), “COVID-19 pandemic effects on health worker’s mental health: Systematic review and meta-analysis”, European Psychiatry, Vol. 65/1, https://doi.org/10.1192/j.eurpsy.2022.1.
[118] Bah, E. et al. (2015), “Clinical Presentation of Patients with Ebola Virus Disease in Conakry, Guinea”, New England Journal of Medicine, Vol. 372/1, pp. 40-47, https://doi.org/10.1056/nejmoa1411249.
[69] Beach, B., K. Clay and M. Saavedra (2022), “The 1918 Influenza Pandemic and Its Lessons for COVID-19”, Journal of Economic Literature, Vol. 60/1, pp. 41-84, https://doi.org/10.1257/jel.20201641.
[121] Belgian Collaborative Group on COVID-19 Hospital Surveillance (2020), “Time between Symptom Onset, Hospitalisation and Recovery or Death: Statistical Analysis of Belgian COVID-19 Patients”, International Journal of Environmental Research and Public Health, Vol. 17/20, p. 7560, https://doi.org/10.3390/ijerph17207560.
[55] Biggerstaff, M. et al. (2014), “Estimates of the reproduction number for seasonal, pandemic, and zoonotic influenza: a systematic review of the literature”, BMC Infectious Diseases, Vol. 14/1, https://doi.org/10.1186/1471-2334-14-480.
[40] Bonita, R. et al. (2006), Basic epidemiology, 2nd edition, World Health Organisation, https://apps.who.int/iris/handle/10665/43541 (accessed on 4 July 2024).
[80] Bonnet, G. et al. (2024), “A Scoping Review and Taxonomy of Epidemiological-Macroeconomic Models of COVID-19”, Value in Health, Vol. 27/1, pp. 104-116, https://doi.org/10.1016/j.jval.2023.10.008.
[19] Breban, R., J. Riou and A. Fontanet (2013), “Interhuman transmissibility of Middle East respiratory syndrome coronavirus: estimation of pandemic risk”, The Lancet, Vol. 382/9893, pp. 694-699, https://doi.org/10.1016/S0140-6736(13)61492-0.
[98] Canini, L. and F. Carrat (2011), “Population Modeling of Influenza A/H1N1 Virus Kinetics and Symptom Dynamics”, Journal of Virology, Vol. 85/6, pp. 2764-2770, https://doi.org/10.1128/jvi.01318-10.
[103] CDC (2025), Measles Clinical Diagnosis Fact Sheet, https://www.cdc.gov/measles/media/pdfs/2024/08/measles-clinical-diagnosis-fs.pdf.
[101] CDC (2023), CDC Yellow Book™: Health Information for International Travel, https://www.cdc.gov/yellow-book/hcp/travel-associated-infections-diseases/influenza.html.
[57] CDC (2023), SARS-CoV-2 Variant Classifications and Definitions, https://www.cdc.gov/coronavirus/2019-ncov/variants/variant-classifications.html (accessed on 17 April 2023).
[48] CDC (2023), Technical Report: Highly Pathogenic Avian Influenza A(H5N1) Viruses, https://www.cdc.gov/flu/avianflu/spotlights/2022-2023/h5n1-technical-report.htm (accessed on 5 April 2023).
[63] CDC (2023), Types of Influenza Viruses, https://www.cdc.gov/flu/about/viruses/types.htm (accessed on 6 April 2023).
[68] CDC (2021), COVID-19 Pandemic Planning Scenarios, https://www.cdc.gov/coronavirus/2019-ncov/hcp/planning-scenarios.html (accessed on 14 April 2023).
[95] CDC (2021), Measles Factsheet, https://www.cdc.gov/measles/downloads/measles-fact-sheet-508.pdf (accessed on 13 April 2023).
[64] CDC (2019), 2009 H1N1 Pandemic (H1N1pdm09 virus), https://www.cdc.gov/flu/pandemic-resources/2009-h1n1-pandemic.html (accessed on 6 April 2023).
[114] CDC (2009), 2009 H1N1 Early Outbreak and Disease Characteristics, https://www.cdc.gov/h1n1flu/surveillanceqa.htm (accessed on 21 April 2024).
[130] Chêne, G. (ed.) (2010), “Case Fatality Rates Based on Population Estimates of Influenza-Like Illness Due to Novel H1N1 Influenza: New York City, May–June 2009”, PLoS ONE, Vol. 5/7, p. e11677, https://doi.org/10.1371/journal.pone.0011677.
[23] Chen, Y. (2008), “The 2003 SARS Outbreaks in Taiwan”, in Emerging Infections in Asia, Springer US, Boston, MA, https://doi.org/10.1007/978-0-387-75722-3_7.
[24] Cherry, J. and P. Krogstad (2004), SARS: The first pandemic of the 21st century, https://doi.org/10.1203/01.PDR.0000129184.87042.FC.
[42] Chiossi, S., S. Tsolova and M. Ciotti (2021), “Assessing public health emergency preparedness: A scoping review on recent tools and methods”, International Journal of Disaster Risk Reduction, Vol. 56, p. 102104, https://doi.org/10.1016/J.IJDRR.2021.102104.
[39] Columbia Mailman School of Public Health (2021), Epidemic, Endemic, Pandemic: What are the Differences?, https://www.publichealth.columbia.edu/news/epidemic-endemic-pandemic-what-are-differences#:~:text=The%20WHO%20defines%20pandemics%2C%20epidemics,as%20opposed%20to%20regional%20epidemics. (accessed on 17 April 2023).
[94] Cowling, B. et al. (2015), “Preliminary epidemiological assessment of MERS-CoV outbreak in South Korea, May to June 2015”, Eurosurveillance, Vol. 20/25, https://doi.org/10.2807/1560-7917.es2015.20.25.21163.
[20] da Costa, V. et al. (2020), Comparative epidemiology between the 2009 H1N1 influenza and COVID-19 pandemics, Elsevier Ltd, https://doi.org/10.1016/j.jiph.2020.09.023.
[1] D’Adamo, A. et al. (2023), “Health disparities in past influenza pandemics: A scoping review of the literature”, SSM - Population Health, Vol. 21, p. 101314, https://doi.org/10.1016/j.ssmph.2022.101314.
[147] Dadras, O. et al. (2022), “COVID‐19 mortality and its predictors in the elderly: A systematic review”, Health Science Reports, Vol. 5/3, https://doi.org/10.1002/hsr2.657.
[85] Dauvin, M. and R. Sampognaro (2021), “Dan les coulisses du confinement : modelisation de chocs simultanes d’offre et de demande”, https://www.ofce.sciences-po.fr/pdf/dtravail/OFCEWP2021-05.pdf (accessed on 4 November 2025).
[109] Dean, N. et al. (2016), “Transmissibility and Pathogenicity of Ebola Virus: A Systematic Review and Meta-analysis of Household Secondary Attack Rate and Asymptomatic Infection”, Clinical Infectious Diseases, Vol. 62/10, pp. 1277-1286, https://doi.org/10.1093/cid/ciw114.
[54] Delamater, P. et al. (2019), “Complexity of the Basic Reproduction Number (R<sub>0</sub>)”, Emerging Infectious Diseases, Vol. 25/1, pp. 1-4, https://doi.org/10.3201/eid2501.171901.
[38] Dicker, R. (ed.) (2006), Principles of epidemiology in public health practice; an introduction to applied epidemiology and biostatistics. 3rd ed, https://stacks.cdc.gov/view/cdc/6914 (accessed on 4 July 2024).
[76] Do, L. and K. Mulholland (2025), “Measles 2025”, New England Journal of Medicine, https://doi.org/10.1056/NEJMra2504516.
[66] Donaldson, L. et al. (2009), “Mortality from pandemic A/H1N1 2009 influenza in England: public health surveillance study”, BMJ, Vol. 339/dec10 1, pp. b5213-b5213, https://doi.org/10.1136/bmj.b5213.
[143] Duong, V. et al. (2015), “Asymptomatic humans transmit dengue virus to mosquitoes”, Proceedings of the National Academy of Sciences, Vol. 112/47, pp. 14688-14693, https://doi.org/10.1073/pnas.1508114112.
[126] EC (2016), Emergency Experience Against Ebola, https://health.ec.europa.eu/system/files/2016-11/summary_report_emergency_en_0.pdf (accessed on 24 April 2024).
[75] ECDC (2026), Ebola disease outbreak in the Democratic Republic of the Congo and Uganda, https://www.ecdc.europa.eu/en/ebola-outbreak-democratic-republic-congo-and-uganda (accessed on 29 July 2026).
[53] ECDC (2025), Avian influenza overview June-September 2025, 2025, https://www.ecdc.europa.eu/en/publications-data/avian-influenza-overview-june-september-2025 (accessed on 7 October 2025).
[65] ECDC (2023), Questions and answers on influenza pandemics, https://www.ecdc.europa.eu/en/pandemic-influenza/facts/questions-and-answers (accessed on 6 April 2023).
[71] ECDC (2022), Factsheet about Ebola disease, https://www.ecdc.europa.eu/en/infectious-disease-topics/z-disease-list/ebola-virus-disease/facts/factsheet-about-ebola-disease (accessed on 5 April 2023).
[30] Elci, C. (2006), “The Impact of HPAI of the H5N1 Strain on Economies of Affected Countries”, https://ideas.repec.org/h/izm/prcdng/200610.html (accessed on 2 October 2025).
[142] European Commission (2021), The Sectoral Impact of the COVID-19 Crisis: An Unprecedented & Atypical Crisis, https://commission.europa.eu/system/files/2021-12/eb069_en.pdf (accessed on 20 November 2025).
[83] Ferrari, M. (ed.) (2021), “Projecting contact matrices in 177 geographical regions: An update and comparison with empirical data for the COVID-19 era”, PLOS Computational Biology, Vol. 17/7, p. e1009098, https://doi.org/10.1371/journal.pcbi.1009098.
[105] Fiebig, L. et al. (2011), “Avian influenza A(H5N1) in humans: new insights from a line list of World Health Organization confirmed cases, September 2006 to August 2010”, Eurosurveillance, Vol. 16/32, https://doi.org/10.2807/ese.16.32.19941-en.
[108] Fragkou, P. et al. (2020), “Clinical characteristics and outcomes of measles outbreak in adults: A multicenter retrospective observational study of 93 hospitalized adults in Greece”, Journal of Clinical Virology, Vol. 131, https://doi.org/10.1016/j.jcv.2020.104608.
[47] Fraser, C. et al. (2004), “Factors that make an infectious disease outbreak controllable”, Proceedings of the National Academy of Sciences of the United States of America, Vol. 101/16, pp. 6146-6151, https://doi.org/10.1073/PNAS.0307506101/ASSET/45E6B0E2-CB72-4A4F-BAA1-C12EB7DF0150/ASSETS/GRAPHIC/ZPQ0150445020003.JPEG.

[110] Furuya-Kanamori, L. et al. (2016), “Heterogeneous and Dynamic Prevalence of Asymptomatic Influenza Virus Infections”, Emerging Infectious Diseases, Vol. 22/6, pp. 1052-1056, https://doi.org/10.3201/eid2206.151080.
[67] Gao, W. et al. (2021), “Role of asymptomatic and pre-symptomatic infections in covid-19 pandemic”, BMJ, p. n2342, https://doi.org/10.1136/bmj.n2342.
[133] Garske, T. et al. (2017), “Heterogeneities in the case fatality ratio in the West African Ebola outbreak 2013–2016”, Philosophical Transactions of the Royal Society B: Biological Sciences, Vol. 372/1721, p. 20160308, https://doi.org/10.1098/rstb.2016.0308.
[8] Global Preparedness Monitoring Board (2024), The Changing Face of Pandemic Risk: 2024 Report, https://www.gpmb.org/reports/m/item/the-changing-face-of-pandemic-risk-2024-report (accessed on 18 October 2025).
[72] Glynn, J. et al. (2017), “Asymptomatic infection and unrecognised Ebola virus disease in Ebola-affected households in Sierra Leone: a cross-sectional study using a new non-invasive assay for antibodies to Ebola virus”, The Lancet Infectious Diseases, Vol. 17/6, pp. 645-653, https://doi.org/10.1016/s1473-3099(17)30111-1.
[86] Goolsbee, A. and C. Syverson (2021), “Fear, lockdown, and diversion: Comparing drivers of pandemic economic decline 2020”, Journal of Public Economics, Vol. 193, p. 104311, https://doi.org/10.1016/j.jpubeco.2020.104311.
[33] GPMB (2019), Annual report on global preparedness for health emergencies Global Preparedness Monitoring Board: A world at risk, http://apps.who.int/iris.
[137] Grasselli, G., A. Pesenti and M. Cecconi (2020), “Critical Care Utilization for the COVID-19 Outbreak in Lombardy, Italy”, JAMA, Vol. 323/16, p. 1545, https://doi.org/10.1001/jama.2020.4031.
[100] Griffin, D., W. Lin and C. Pan (2012), Measles virus, immune control, and persistence, https://doi.org/10.1111/j.1574-6976.2012.00330.x.
[50] Gruber, P., C. Gomersall and G. Joynt (2006), “Avian influenza (H5N1): implications for intensive care”, Intensive Care Medicine, Vol. 32/6, https://doi.org/10.1007/s00134-006-0148-z.
[91] Guerra, F. et al. (2017), “The basic reproduction number (R 0 ) of measles: a systematic review”, The Lancet Infectious Diseases, Vol. 17/12, pp. e420-e428, https://doi.org/10.1016/s1473-3099(17)30307-9.
[131] Guillon, A. et al. (2021), “Case fatality inequalities of critically ill COVID-19 patients according to patient-, hospital- and region-related factors: a French nationwide study”, Annals of Intensive Care, Vol. 11/1, https://doi.org/10.1186/s13613-021-00915-4.
[25] Hai, W. et al. (2004), The Short-Term Impact of SARS on the Chinese Economy *, http://direct.mit.edu/asep/article-pdf/3/1/57/1688277/1535351041747905.pdf.
[31] Hassouneh, I. et al. (n.d.), Give to AgEcon Search Food Scare Crises and Developing Countries: The Impact of Avian Influenza on Vertical Price Transmission in the Egyptian Poultry Sector, http://ageconsearch.umn.edu.
[81] Haw, D. et al. (2022), “Optimizing social and economic activity while containing SARS-CoV-2 transmission using DAEDALUS”, Nature Computational Science, Vol. 2/4, pp. 223-233, https://doi.org/10.1038/s43588-022-00233-0.
[112] Horby, P. (ed.) (2017), “Predicting Ebola Severity: A Clinical Prioritization Score for Ebola Virus Disease”, PLOS Neglected Tropical Diseases, Vol. 11/2, p. e0005265, https://doi.org/10.1371/journal.pntd.0005265.
[92] Huai, Y. (2008), “Incubation Period for Human Cases of Avian Influenza A (H5N1) Infection, China”, Emerging Infectious Diseases, Vol. 14/11, pp. 1819-1821, https://doi.org/10.3201/eid1411.080509.
[35] Huber, C., L. Finelli and W. Stevens (2018), The Economic and Social Burden of the 2014 Ebola Outbreak in West Africa, Oxford University Press, https://doi.org/10.1093/infdis/jiy213.
[106] Hui, D. (2008), Review of clinical symptoms and spectrum in humans with influenza A/H5N1 infection, https://doi.org/10.1111/j.1440-1843.2008.01247.x.
[11] IMF (2022), A Disrupted Global Recovery: Growth slows as economies grapple with supply disruptions, higher inflation, record debt and persistent uncertainty, https://www.imf.org/en/Blogs/Articles/2022/01/25/blog-a-disrupted-global-recovery.
[52] Institut Pasteur (2025), Avian influenza: A global epidemic under surveillance, 2025, https://www.pasteur.fr/en/research-journal/news/avian-influenza-global-epidemic-under-surveillance.
[6] Jones, K. et al. (2008), “Global trends in emerging infectious diseases”, Nature, Vol. 451/7181, pp. 990-993, https://doi.org/10.1038/nature06536.
[37] Joo, H. et al. (2019), “Economic Impact of the 2015 MERS Outbreak on the Republic of Korea’s Tourism-Related Industries”, Health Security, Vol. 17/2, pp. 100-108, https://doi.org/10.1089/hs.2018.0115.
[104] Kandun, I. et al. (2008), “Factors associated with case fatality of human H5N1 virus infections in Indonesia: a case series”, The Lancet, Vol. 372/9640, pp. 744-749, https://doi.org/10.1016/s0140-6736(08)61125-3.
[145] Kawuki, J., T. Musa and X. Yu (2021), “Impact of recurrent outbreaks of Ebola virus disease in Africa: a meta-analysis of case fatality rates”, Public Health, Vol. 195, pp. 89-97, https://doi.org/10.1016/j.puhe.2021.03.027.
[123] Kiiza, P. et al. (2020), Treatment of Ebola-related critical illness, Springer, https://doi.org/10.1007/s00134-020-05949-z.
[88] Kim, W. and S. Cho (2021), “Estimation of the Basic Reproduction Numbers of the Subtypes H5N1, H5N8, and H5N6 During the Highly Pathogenic Avian Influenza Epidemic Spread Between Farms”, Frontiers in Veterinary Science, Vol. 8, https://doi.org/10.3389/fvets.2021.597630.
[49] Kirkeby, C. and M. Ward (2022), “A review of estimated transmission parameters for the spread of avian influenza viruses”, Transboundary and Emerging Diseases, Vol. 69/6, pp. 3238-3246, https://doi.org/10.1111/tbed.14675.
[28] Knobler, S., Institute of Medicine (U.S.). Forum on Microbial Threats. and Institute of Medicine (U.S.). Board on Global Health. (2004), Learning from SARS: Preparing for the next disease outbreak: workshop summary, National Academies Press.
[128] Kumar, A. et al. (n.d.), Critically Ill Patients With 2009 Influenza A(H1N1) Infection in Canada, http://www.jama.com.
[127] Kumar, T. et al. (2012), “H1N1-infected patients in ICU and heir clinical outcome”, North American Journal of Medical Sciences, Vol. 4/9, pp. 394-398, https://doi.org/10.4103/1947-2714.100984.
[51] Lai, S. et al. (2016), “Global epidemiology of avian influenza A H5N1 virus infection in humans, 1997–2015: a systematic review of individual case data”, The Lancet Infectious Diseases, Vol. 16/7, pp. e108-e118, https://doi.org/10.1016/s1473-3099(16)00153-5.
[125] Leboucher, C. et al. (2023), “The burden of hospitalisations for COVID-19 in France: a study of all cases in the national insurance claims database in 2020”, Journal of Market Access and Health Policy, Vol. 11/1, https://doi.org/10.1080/20016689.2022.2160328.
[90] Linka, K., M. Peirlinck and E. Kuhl (2020), The reproduction number of COVID-19 and its correlation with public health interventions, Cold Spring Harbor Laboratory, https://doi.org/10.1101/2020.05.01.20088047.
[58] Liu, Y. et al. (2020), “The reproductive number of COVID-19 is higher compared to SARS coronavirus”, Journal of Travel Medicine, Vol. 27/2, https://doi.org/10.1093/jtm/taaa021.
[59] Liu, Y. and J. Rocklöv (2022), “The effective reproductive number of the Omicron variant of SARS-CoV-2 is several times relative to Delta”, Journal of Travel Medicine, Vol. 29/3, https://doi.org/10.1093/jtm/taac037.
[7] Madhav, N. et al. (2023), Estimated Future Mortality from Pathogens of Epidemic and Pandemic Potential, https://www.cgdev.org/sites/default/files/estimated-future-mortality-pathogens-epidemic-and-pandemic-potential.pdf (accessed on 18 October 2025).
[122] Maltezou, H. et al. (2020), “Costs associated with measles in healthcare personnel during the 2017–2018 epidemic in Greece: a real-world data cost-of-illness analysis”, Journal of Hospital Infection, Vol. 105/1, pp. 91-94, https://doi.org/10.1016/j.jhin.2019.12.006.
[74] Malvy, D. et al. (2019), “Ebola virus disease”, The Lancet, Vol. 393/10174, pp. 936-948, https://doi.org/10.1016/s0140-6736(18)33132-5.
[60] Mavhunga, C. (2023), “Cholera: World Health Organization warns of rising cases in Africa”, BMJ, p. p488, https://doi.org/10.1136/bmj.p488.
[4] Meadows, A. et al. (2023), “Historical trends demonstrate a pattern of increasingly frequent and severe spillover events of high-consequence zoonotic viruses”, BMJ Global Health, Vol. 8/11, p. e012026, https://doi.org/10.1136/bmjgh-2023-012026.
[46] Mizumoto, K. et al. (2020), “Estimating the asymptomatic proportion of coronavirus disease 2019 (COVID-19) cases on board the Diamond Princess cruise ship, Yokohama, Japan, 2020”, Eurosurveillance, Vol. 25/10, p. 1, https://doi.org/10.2807/1560-7917.ES.2020.25.10.2000180.
[141] Murakami, M. (ed.) (2020), “Factors contributing to healthcare professional burnout during the COVID-19 pandemic: A rapid turnaround global survey”, PLOS ONE, Vol. 15/9, p. e0238217, https://doi.org/10.1371/journal.pone.0238217.
[44] Nelson, K. and C. Williams (2014), Infectious Disease Epidemiology: Theory and Practice, Jones & Bartlett Learning.
[77] NHS (2024), Measles, https://www.nhs.uk/conditions/measles/ (accessed on 8 October 2025).
[21] Noh, J. et al. (2020), “Effect of information disclosure policy on control of infectious disease: MERS-CoV outbreak in South Korea”, International Journal of Environmental Research and Public Health, Vol. 17/1, https://doi.org/10.3390/ijerph17010305.
[79] OECD/WHO/The World Bank (2024), Strengthening Pandemic Preparedness and Response Through Integrated Modelling, OECD Publishing, Paris, https://doi.org/10.1787/5f046115-en.
[144] Oran, D. and E. Topol (2020), “Prevalence of Asymptomatic SARS-CoV-2 Infection”, Annals of Internal Medicine, Vol. 173/5, pp. 362-367, https://doi.org/10.7326/m20-3012.
[26] Ostwald, K. (2014), “Ebola, SARS, and the economies of Southeast Asia”, ISEAS Perspective. Institute of Southeast Asian Studies..
[84] Özçelik, E. et al. (2024), “Estimating the return on investment of selected infection prevention and control interventions in healthcare settings for preparing against novel respiratory viruses: modelling the experience from SARS-CoV-2 among health workers”, eClinicalMedicine, Vol. 68, p. 102388, https://doi.org/10.1016/j.eclinm.2023.102388.
[22] PAHO (2025), Zika: Analysis by country, https://www.paho.org/en/arbo-portal/zika-data-and-analysis/zika-analysis-country (accessed on 2 October 2025).
[14] Peiris, J. et al. (2003), “The Severe Acute Respiratory Syndrome”, New England Journal of Medicine, Vol. 349/25, pp. 2431-2441, https://doi.org/10.1056/nejmra032498.
[89] Petersen, E. et al. (2020), “Comparing SARS-CoV-2 with SARS-CoV and influenza pandemics”, The Lancet Infectious Diseases, Vol. 20/9, pp. e238-e244, https://doi.org/10.1016/s1473-3099(20)30484-9.
[113] Petersen, E. et al. (2024), “Avian ‘Bird’ Flu – undue media panic or genuine concern for pandemic potential requiring global preparedness action?”, International Journal of Infectious Diseases, p. 107062, https://doi.org/10.1016/j.ijid.2024.107062.
[138] Phua, J. et al. (2020), “Intensive care management of coronavirus disease 2019 (COVID-19): challenges and recommendations”, The Lancet Respiratory Medicine, Vol. 8/5, pp. 506-517, https://doi.org/10.1016/s2213-2600(20)30161-2.
[120] Pormohammad, A. et al. (2020), “Comparison of influenza type A and B with COVID‐19: A global systematic review and meta‐analysis on clinical, laboratory and radiographic findings”, Reviews in Medical Virology, Vol. 31/3, https://doi.org/10.1002/rmv.2179.
[43] Porta, M. (ed.) (2016), A Dictionary of Epidemiology, Oxford University Press, https://doi.org/10.1093/ACREF/9780199976720.001.0001.
[135] Portnoy, A. et al. (2019), “Estimates of case-fatality ratios of measles in low-income and middle-income countries: a systematic review and modelling analysis”, The Lancet Global Health, Vol. 7/4, pp. e472-e481, https://doi.org/10.1016/s2214-109x(18)30537-0.
[116] Probert, W. et al. (2021), “Molecular Epidemiology of Measles in California, United States—2019”, The Journal of Infectious Diseases, Vol. 224/6, pp. 1015-1023, https://doi.org/10.1093/infdis/jiab059.
[36] Rassy, D. and R. Smith (2013), “The economic impact of H1N1 on Mexico’s tourist and pork sectors”, Health Economics, Vol. 22/7, pp. 824-834, https://doi.org/10.1002/hec.2862.
[146] Reed, C. et al. (2013), “Novel Framework for Assessing Epidemiologic Effects of Influenza Epidemics and Pandemics”, Emerging Infectious Diseases, Vol. 19/1, pp. 85-91, https://doi.org/10.3201/eid1901.120124.
[2] Rolfes, M. et al. (2025), “Human infections with highly pathogenic avian influenza A(H5N1) viruses in the United States from March 2024 to May 2025”, Nature Medicine, https://doi.org/10.1038/s41591-025-03905-2.
[82] Romijn, G., N. Stadhouders and J. Polder (2025), “Application of an Epi-Econ-Model to Analyze COVID-19 Lockdown Policies in the Netherlands: Lessons and Limitations”, Journal of Benefit-Cost Analysis, Vol. 16/2-3, pp. 170-206, https://doi.org/10.1017/bca.2025.10.
[111] Sah, P. et al. (2021), “Asymptomatic SARS-CoV-2 infection: A systematic review and meta-analysis”, Proceedings of the National Academy of Sciences, Vol. 118/34, https://doi.org/10.1073/pnas.2109229118.
[70] Schoch-Spana, M. et al. (2017), “Global Catastrophic Biological Risks: Toward a Working Definition”, Health Security, Vol. 15/4, pp. 323-328, https://doi.org/10.1089/hs.2017.0038.
[102] Sender, R. et al. (2022), “The unmitigated profile of COVID-19 infectiousness”, eLife, Vol. 11, https://doi.org/10.7554/eLife.79134.
[5] Smith, K. et al. (2014), “Global rise in human infectious disease outbreaks”, Journal of The Royal Society Interface, Vol. 11/101, p. 20140950, https://doi.org/10.1098/rsif.2014.0950.
[115] Souris, M. and J. Gonzalez (2020), “COVID-19: Spatial analysis of hospital casefatality rate in France”, PLoS ONE, Vol. 15/12 December, https://doi.org/10.1371/journal.pone.0243606.
[129] Stahl, J. et al. (2013), “Adult patients hospitalized for measles in France, in the 21st century”, Medecine et Maladies Infectieuses, Vol. 43/10, pp. 410-416, https://doi.org/10.1016/j.medmal.2013.07.001.
[27] Steinmueller, A. (2005), Social and Economic Impacts of SARS Outbreak in Thailand.
[32] The World Bank (2018), Operational Framework for Strengthening Human, Animal, and Environmental Public Health Systems at their Interface 27292_Operational_Framework.indd 1 4/16/18 2:29 PM, http://documents.worldbank.org/curated/en/703711517234402168/Operational-framework-for-.
[41] Thomas, S. et al. (2020), “Strengthening health systems resilience: Key concepts and strategies”, European Observatory on Health Systems and Policies, https://doi.org/10.13140/RG.2.2.17429.35041 (accessed on 30 January 2023).
[97] Tuite, A. et al. (2010), “Estimated epidemiologic parameters and morbidity associated with pandemic H1N1 influenza”, CMAJ. Canadian Medical Association Journal, Vol. 182/2, pp. 131-136, https://doi.org/10.1503/cmaj.091807.
[34] UNDP (2017), The United Nations Development Programme (UNDP) in partnership with the International Federation of Red Cross and Red Crescent Societies (IFRC): A socio-economic impact assessment of the Zika virus in Latin America and the Carribbean.
[136] Vallée, A., D. Faranda and M. Arutkin (2023), “COVID-19 epidemic peaks distribution in the United-States of America, from epidemiological modeling to public health policies”, Scientific Reports, Vol. 13/1, https://doi.org/10.1038/s41598-023-30014-2.
[119] Van Kerkhove, M. et al. (2015), “A review of epidemiological parameters from Ebola outbreaks to inform early public health decision-making”, Scientific Data, Vol. 2/1, https://doi.org/10.1038/sdata.2015.19.
[96] Velásquez, G. et al. (2015), Time from Infection to Disease and Infectiousness for Ebola Virus Disease, a Systematic Review, Oxford University Press, https://doi.org/10.1093/cid/civ531.
[139] Vera San Juan, N. et al. (2022), “Training and redeployment of healthcare workers to intensive care units (ICUs) during the COVID-19 pandemic: a systematic review”, BMJ Open, Vol. 12/1, p. e050038, https://doi.org/10.1136/bmjopen-2021-050038.
[107] Vijayanand, P., E. Wilkins and M. Woodhead (2004), “Severe acute respiratory syndrome (SARS): a review”, Clinical Medicine, Vol. 4/2, pp. 152-160, https://doi.org/10.7861/clinmedicine.4-2-152.
[124] Wang, C. et al. (2014), “Comparison of Patients Hospitalized With Influenza A Subtypes H7N9, H5N1, and 2009 Pandemic H1N1”, Clinical Infectious Diseases, Vol. 58/8, pp. 1095-1103, https://doi.org/10.1093/cid/ciu053.
[78] WHO (2026), Measles, https://www.who.int/news-room/fact-sheets/detail/measles (accessed on 27 July 2026).
[18] WHO (2026), Middle East respiratory syndrome: global summary and assessment of risk, https://www.who.int/publications/i/item/B09692 (accessed on 27 July 2026).
[17] WHO (2025), Influenza A (H1N1), https://www.who.int/emergencies/situations/influenza-a-(h1n1)-outbreak (accessed on 2 October 2025).
[62] WHO (2024), Pandemic influenza: a threat that all countries need to prepare for, https://www.who.int/europe/emergencies/emergency-cycle/prepare/pandemic-influenza.
[61] WHO (2023), Influenza (Seasonal), https://www.who.int/news-room/fact-sheets/detail/influenza-(seasonal) (accessed on 6 April 2023).
[12] WHO (2023), Statement on the fifteenth meeting of the IHR (2005) Emergency Committee on the COVID-19 pandemic, https://www.who.int/news/item/05-05-2023-statement-on-the-fifteenth-meeting-of-the-international-health-regulations-(2005)-emergency-committee-regarding-the-coronavirus-disease-(covid-19)-pandemic.
[10] WHO (2023), WHO Coronovirus (COVID-19) Dashboard, https://covid19.who.int/ (accessed on 16 April 2023).
[15] WHO (2015), Summary of probable SARS cases with onset of illness from 1 November 2002 to 31 July 2003, https://www.who.int/publications/m/item/summary-of-probable-sars-cases-with-onset-of-illness-from-1-november-2002-to-31-july-2003.
[87] WHO Ebola Response Team (2014), “Ebola Virus Disease in West Africa — The First 9 Months of the Epidemic and Forward Projections”, New England Journal of Medicine, Vol. 371/16, pp. 1481-1495, https://doi.org/10.1056/nejmoa1411100.
[3] WHO Research and Development Blueprint (2024), Prioritizing diseases for research and development in emergency contexts, https://www.who.int/activities/prioritizing-diseases-for-research-and-development-in-emergency-contexts (accessed on 29 November 2022).
[16] WHO/GIP (2024), Cumulative number of confirmed human cases for avian influenza A(H5N1) reported to WHO, 2003-2024, 3 May 2024, Data in HQ, https://www.who.int/publications/m/item/cumulative-number-of-confirmed-human-cases-for-avian-influenza-a(h5n1)-reported-to-who--2003-2024-3-may-2024.
[13] Wilder-Smith, A. (2021), “COVID-19 in comparison with other emerging viral diseases: risk of geographic spread via travel”, Tropical Diseases, Travel Medicine and Vaccines, Vol. 7/1, https://doi.org/10.1186/s40794-020-00129-9.
[117] Winkler, N. et al. (2022), “Australian vaccine preventable disease epidemiological review series: measles, 2012–2019”, Communicable Diseases Intelligence, Vol. 46, https://doi.org/10.33321/cdi.2022.46.38.
[134] Wong, J. et al. (2015), “Hospitalization Fatality Risk of Influenza A(H1N1)pdm09: A Systematic Review and Meta-Analysis”, American Journal of Epidemiology, Vol. 182/4, pp. 294-301, https://doi.org/10.1093/aje/kwv054.
[132] Wong, R. et al. (1993), “Clinical and laboratory features of measles in hospitalized adults”, The American Journal of Medicine, Vol. 95/4, pp. 377-383, https://doi.org/10.1016/0002-9343(93)90306-A.
[73] Wong, Z. et al. (2017), “A systematic review of early modelling studies of Ebola virus disease in West Africa”, Epidemiology and Infection, Vol. 145/6, pp. 1069-1094, https://doi.org/10.1017/s0950268817000164.
[29] World Bank (2017), One health economics for healthy people, agriculture and environment, https://blogs.worldbank.org/en/health/one-health-economics-healthy-people-agriculture-and-environment.
[99] Xin, H. et al. (2022), “Estimating the Latent Period of Coronavirus Disease 2019 (COVID-19)”, Clinical Infectious Diseases, Vol. 74/9, pp. 1678-1681, https://doi.org/10.1093/cid/ciab746.
[56] Yu, I. et al. (2004), “Evidence of Airborne Transmission of the Severe Acute Respiratory Syndrome Virus”, New England Journal of Medicine, Vol. 350/17, pp. 1731-1739, https://doi.org/10.1056/nejmoa032867.
Different classes of microbes have a differentiated potential to become a global catastrophic biological risk:
Viruses are of higher concern given their rate of replication, the lack of broad spectrum anti-viral agents and the genomic characteristics of RNA viruses. In particular, concerns are rising in recent years about the risk of highly pathogenic avian influenza (HPAI) caused by the H5N1 virus
Infections caused by bacteria are another rising concern, considering the serious threat of antimicrobial resistance.
In comparison, fungal infections have a more limited pandemic potential given that, in general, fungi show a more limited ability to reproduce efficiently in mammalian hosts with higher body temperatures (Adalja et al., 2018[45]).
Prions (i.e. transmissible infective proteins) also have more limited pandemic potential because their transmission routes are restrictive.
Finally, infections caused by protozoans are often vector-borne, thus their pandemic potential is currently considered to be limited given the availability of anti-malarian compounds and vector avoidance strategies have proved successful when employed appropriately (Adalja et al., 2018[45]).
The basic reproduction number is one of the most important factors that help assess the epidemic trajectory of a disease. It refers to the average number of secondary cases that can occur after one infectious individual is introduced in a susceptible population (Delamater et al., 2019[54]). The basic reproduction number is typically reported as a single numeric value or a range with high and low values. The magnitude of is considered to shed light on to the potential size of an outbreak. It is generally accepted that if the average number of secondary cases:
exceeds 1 or equal to 1 (i.e. 1), a disease is outbreak is likely to occur or persist.
stays below 1 (i.e. <1), then the outbreak would be expected to end.
Quantifying the precise magnitude of can be difficult, because it depends on a wide range of factors such as the location of the outbreak, population density, seasonality and the stage of the outbreak. The value can also be different for the same disease across the different stages of the outbreak. This has been shown to be the case during the 1918 influenza outbreak when the median value around 1.81 in the first wave of the outbreak, 1.73 in the 2nd wave and 1.70 in the third wave (Biggerstaff et al., 2014[55]). Similarly, there has been considerable variation in the estimated of recent outbreaks caused by coronaviruses.
The mode of transmission refers to the variety of ways through which an infectious agent may be transmitted to a susceptible host from its natural reservoir. Certain transmission types can pose a greater threat to population health (Adalja et al., 2018[45]). For example, disease pathogens that spread through the respiratory route (e.g. influenza) are considered to pose great risks for large outbreaks, because public health interventions that aim to interrupt the spread of an airborne pathogens/ droplets are substantially more difficult to implement (e.g. mask wearing). Similarly, pathogens such as Hepatitis A and Vibrio cholera that spread though faecal/oral exposure can cause large outbreaks if water and sanitation infrastructures are undermined (Mavhunga, 2023[60]). In contrast, the spread of a pathogen agent that is transmitted through direct contact may be more easily interrupted by scaling up infection prevention and control measures in the community and healthcare settings (e.g. increasing the use of personal protective equipment). The spread of vector- and tick-borne diseases are generally circumscribed by the geographic distribution of disease vectors, though these diseases are becoming increasingly worrisome threat to population health across OECD, EU/EEA and G20 countries.
Several factors that relate to the timing of disease transmission play a crucial role in determining the scale of disease outbreaks. Certain infectious diseases such as EVD are contagious during the later stages of an infection while the infected person shows symptoms. This limits the opportunities for spreading the infection (Wilder-Smith, 2021[13]). This was also the case for smallpox – the only human infectious disease eradicated from the planet – which was not contagious during its incubation period (Adalja et al., 2018[45]). In comparison, a person infected with the human immunodeficiency virus (HIV) can potentially infect other persons years after the initial infection, even though the estimated probability of disease transmission per exposure without treatment remains low (Nelson and Williams, 2014[44]). Other pathogen agents such as influenza viruses are contagious during their incubation period and even before the infected person develops any symptoms. In other words, there may be more opportunities for these types of pathogen agents to spread because the infected individuals can transmit the disease while conducting their daily activities without any major interruptions.
The share of non-symptomatic infections is another factor that plays a crucial role in determining the course of an infection as well as the course of an outbreak. Non-symptomatic infections can occur in two ways:
Asymptomatic infection: An asymptomatic infection refers to a situation where an infected person does not develop any symptoms over the course of the disease (Gao et al., 2021[67]).
Pre‑symptomatic infection: Whereas pre‑symptomatic infection occurs when the infection is detected before the infected individual eventually develops symptoms.
Previous evidence documented that the transmission of dengue and EVD can occur in the absence of any symptoms (Duong et al., 2015[143]). In the case of COVID‑19, the evidence on emerging data collated through systematic reviews and meta‑analysis suggested that the share of people who tested positive for COVID‑19 and never developed any symptoms range from around 8.4% to 39% (Gao et al., 2021[67]).
The relative infectiousness of asymptomatic cases in comparison to symptomatic cases remains highly uncertain. This uncertainty is a reflection of the differences across study settings in terms of what is considered an asymptomatic case, the testing capacity and the accuracy of tests used, the duration of the follow-up period and difficulties around measuring and quantifying disease transmission (Gao et al., 2021[67]; CDC, 2021[68]). Considering this uncertainty and based on available evidence, the CDC suggests that COVID‑19 can consider that asymptomatic patients are around 25% as infectious as symptomatic individuals (CDC, 2021[68]).
Non-symptomatic infections can complicate the public health response to halt the spread of an outbreak. Non-symptomatic infections can be addressed by scaling up early and effective testing capacity. However, as shown by previous evidence from the COVID‑19 pandemic, the identification of non-symptomatic infections can become more difficult during the peak moments of large outbreaks because the pressure on the testing capacity exacerbates as the infection rates rise (Gao et al., 2021[67]; Oran and Topol, 2020[144]).
The severity of a disease is another key factor that affects the extent to which a pathogen can cause harm to population health and disrupt economic activity. CFR is one summary measure that help assess the severity of disease. It refers to the proportion of population who lose their lives due to a particular condition. CFR reflects not only the epidemiology of the pathogen agent, but also the current standard of healthcare and it could be influenced by the emergence of new therapeutics or vaccines.
A pathogen of pandemic potential does not need to have an extremely high CFR value to cause significant disruption to the society. For example, the 1918 influenza pandemic had a devastating impact on population health (Beach, Clay and Saavedra, 2022[69]), causing approximately 50‑100 million deaths worldwide. Yet, compared to other diseases such as EVD, the disease severity of the 1918 pandemic is considered to be low, with an estimated CFR of around 1‑2% (Schoch-Spana et al., 2017[70]). In contrast, the EVD is considered to have a very high risk of mortality, with an estimated CFR rate of around 60% (Kawuki, Musa and Yu, 2021[145]). Despite this, the risk of a global EVD pandemic is considered to be relatively low (Box 3.6), partly because the spread of the disease is expected to be curbed relatively fast if a high proportion of the population adheres with public health guidelines (ECDC, 2022[71]).
Relying solely on a pre‑defined CFR threshold to inform policy decisions around the use of non-pharmaceutical interventions (NPIs) could hinder the public health response during the pandemics. For example, during a disease outbreak caused by a pathogen with low risk of mortality, relying only on CFR may prevent policymakers from taking policy action. Yet, an uncontrolled outbreak may still result in substantial detrimental impacts to the society, because CFR does not account for other effects of pandemics such as absenteeism from work due to ill health and excess demand for healthcare services (Reed et al., 2013[146]). Conversely, a disease agent with a high level of CFR may prompt policymakers to impose a wide range of NPIs (e.g. stay-at-home orders). However, the benefits of NPIs do not always outweigh their costs considering that certain diseases such as common cold are self-limiting such that they will resolve on their own without medical intervention or treatment. Importantly, a single summary measure of CFR cannot fully capture the detrimental impacts of outbreaks on the health of vulnerable populations (e.g. older adults and people with immunodeficiencies) who might bear a heavier attributable mortality burden (Dadras et al., 2022[147]).
Broadly, having an immunologically naïve population may increase the risk of pandemic outbreaks because a larger share of the population is susceptible to infections. When the individuals in a population have already been exposed to a disease agent through previous infection (i.e. natural immunity) or vaccination (i.e. vaccine‑induced immunity), they may develop immunity. In turn, the pre‑existing immunity in the community can help slow the spread of the disease agent and reduce the number of new infections, decreasing the risk of a pandemic outbreak. In addition, pre‑existing immunity in the community may also decrease the health burden and the burden on the health system, even when the impact on the basic reproduction number is limited, for example by limiting the development of more serious forms of the disease. Conversely, when a novel disease agent emerges, all individuals in the community are considered to be susceptible to infection because no individual would have pre‑existing immunity. This could mean that the disease could spread in the population at a faster pace, potentially resulting in a pandemic outbreak. This was the case with the COVID‑19 pandemic that emerged in an immunologically naïve population, causing millions of infections and deaths.