Women dominate the teaching profession, especially in early childhood and primary education, but less so at higher levels. In OECD countries, women account for 96% of teachers at pre-primary level but only 46% at tertiary level on average.
Female representation in school management remains lower than in teaching positions. Although women make up 83% of primary teachers, they hold only 67% of management roles.
The intensity of teachers’ working time reflects the prevalence of part-time work among the teaching workforce, with secondary teachers averaging 89% of a full-time workload. Working-time intensity is notably low in Mexico and Switzerland, reflecting larger shares of teachers who work part time.
Most teachers meet their countries’ minimum educational attainment requirements for the profession, yet significant gaps exist. On average, 89% of lower secondary teachers meet current requirements, but shares are much lower in countries like Iceland and Sweden.
Education at a Glance 2026

Based on the ratio of full-time equivalent teachers to total teacher headcount, indicating the average proportion of a full-time workload per teacher.
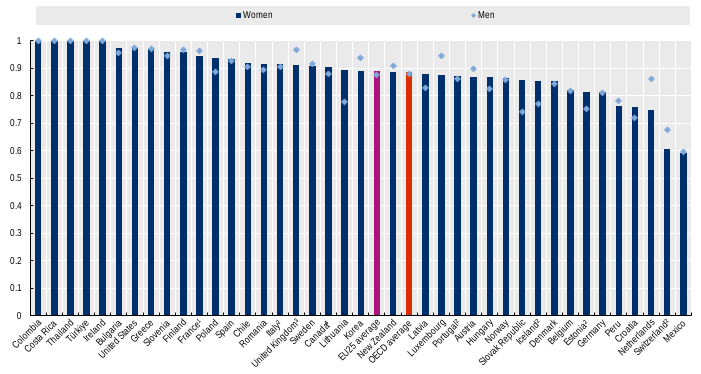
1. Includes only public and government dependent private institutions.
2. Secondary education includes post-secondary non-tertiary education.
3. Includes only general programmes at secondary level.
4. Data for secondary relate only to upper secondary education.
For data, see Table D5.3. The data for this figure can be accessed via https://stat.link/4t97hi.
Context
Teachers are the most significant in-school determinant of student achievement and well-being, making the recruitment and retention of a high-quality workforce a top priority for education systems. However, many OECD countries are currently grappling with significant teacher shortages, driven by the declining attractiveness of the profession and an impending wave of retirements (see Chapter 1, Teacher shortages and the attractiveness of the teaching profession). These staffing challenges are often compounded by issues such as relatively low salaries, high workloads and limited opportunities for career advancement, which require a deeper understanding of the workforce's structural characteristics to inform effective policy responses.
The composition of the teaching workforce, particularly regarding gender, remains a central theme in educational policy, as it affects the diversity of role models available to students and reflects broader equity issues in the workplace (Kammermeier et al., 2025[1]). Although women make up the vast majority of teachers at the pre-primary and primary levels, their representation typically decreases as the level of education increases. Furthermore, women’s representation in school management and leadership roles is lower than in the classroom in many education systems. Addressing these disparities is crucial not only for ensuring workplace equity but also for providing viable career progression pathways that can enhance the long-term attractiveness of the profession.
Teachers’ working patterns and educational attainment requirements are also critical factors in determining the actual teaching capacity and preparedness of the workforce (UNESCO, 2024[2]). The intensity of teachers’ working time, reflected in the balance between full-time and part-time employment, varies considerably across countries and levels of education, influencing both the flexibility of the profession and the total number of staff required to meet student needs. Simultaneously, there is a global trend of rising educational attainment requirements for would-be teachers, aimed at ensuring they possess advanced pedagogical and subject-matter expertise. In an era of persistent staffing challenges, understanding how these attainment requirements intersect with the actual attainment levels of the current workforce is essential for maintaining educational quality while managing the practical constraints of teacher supply.
Other findings
Working-time intensity is almost identical for men and women on average among secondary school teachers. However, women are more likely to work part time than men in countries such as the Netherlands and Switzerland, while it is the other way round in Lithuania and the Slovak Republic, reflecting different patterns of part-time work by gender.
Educational attainment requirements for the teaching profession have been increasing in many countries, with nearly half of OECD countries requiring a master’s degree for lower secondary teaching. Requirements are often more flexible for vocational subjects to attract industry professionals.
These changing requirements mean some experienced teachers do not hold current minimum attainment. These "legacy teachers" continue to be considered qualified to teach, a nuance essential for interpreting data in countries with ageing workforces.
Gender composition of the teaching workforce
Women make up the large majority of the teaching workforce across most OECD countries, although their representation tends to decrease as the level of education increases. On average across OECD countries in 2024, 96% of teachers in pre-primary (ISCED 01) education were women, compared to 83% in primary education (ISCED 1). This dominance remains significant at the secondary level, with women making up 68% of teachers in lower secondary (ISCED 2) programmes and 60% in upper secondary ones (ISCED 3). However, the gender profile reverses at the tertiary level, where women are in the minority, making up 46% of the teaching staff on average (Table D5.1).
Pre-primary to post-secondary non-tertiary education
The teaching profession remains highly feminised, particularly at lower levels of education. In pre-primary education, the share of female teachers ranges from nearly 100% in the Slovak Republic, and 99% in Portugal to 88% in the Netherlands. However, the degree of feminisation varies substantially across countries at other levels of education, reflecting different cultural contexts and labour-market dynamics. In primary education, the share of female teachers ranges from 96% in Lithuania and 95% in Hungary to 63% in Japan and 59% in Saudi Arabia. The differences are even more pronounced at the upper secondary level, where Japan stands out with women making up only 32% of the workforce, against shares as high as 77% in Latvia and 78% in Lithuania (Table D5.1).
Between 2015 and 2024, the gender composition of the teaching workforce remained largely stable across education levels. The share of women teachers in pre-primary education declined slightly, from 97% to 96%, while it remained unchanged at 83% in primary education. At lower secondary level, the share decreased marginally from 69% to 68%, whereas at upper secondary level it increased slightly from 59% to 60%. At post-secondary non-tertiary level (ISCED 4), it remained stable at 56% (Table D5.1).
The high concentration of women in teaching, especially in pre-primary and primary education, reflects a combination of cultural norms, labour-market dynamics and working conditions. Teaching at lower levels is often associated with caregiving and child development, roles that continue to be socially linked to women in many societies (Gibbons, 2020[3]). In early childhood education (ECE), relatively low salaries, limited career progression and gender stereotypes surrounding care work discourage many men from entering or remaining in the profession (Wu, 2023[4]; Quinones, Barnes and Berger, 2021[5]). Male educators may also face greater scrutiny or suspicion, contributing to higher attrition rates (Brody and Ziv, 2020[6]). Research further shows that female student teachers are more strongly motivated by pedagogical and student-support goals, while male student teachers more often emphasise subject-related interests (Kammermeier et al., 2025[1]). These patterns are consistent with social role theories, which argue that gender norms shape occupational preferences and perceptions of career suitability.
Working conditions also help explain women’s representation in teaching. Although salaries are often lower than those in other graduate professions, the profession typically offers more predictable working hours, greater job security and better compatibility with family responsibilities than other jobs, factors that tend to weigh more strongly in women’s career decisions (OECD, 2023[7]; OECD, 2025[8]). At the same time, the feminisation of teaching is associated with lower relative salaries and occupational status. Evidence suggests that occupations with a high share of women tend to receive lower pay and social recognition, a pattern often explained by the “devaluation thesis”, according to which work predominantly carried out by women is undervalued compared to male-dominated occupations (Leuze and Strauß, 2016[9]; Verzola Vaz and Camargo Botassio, 2022[10]). The resulting under-representation of men not only narrows the recruitment pool and may contribute to teacher shortages but also limits the diversity of role models available to children.
Recent trends suggest that targeted policies can contribute to modest changes. In a number of countries, the share of female teachers in pre-primary education fell between 2015 and 2024, including Norway (from 93% to 90%), Germany (from 96% to 93%) and the United Kingdom (from 98% to 93%) (Table D5.1). In Norway, this development aligns with sustained policy efforts aimed at increasing the share of men in the ECE workforce (OECD, 2020[11]). Norway has implemented national targets and initiatives such as the “Play Resources” project, which introduces boys and young men to the profession at an early stage (OECD, 2020[11]). In Germany, broader workforce strategies, such as expanding paid training pathways and improving career incentives, have also aimed to diversify recruitment into the sector (OECD, 2020[11]).
Tertiary education
Although men continue to form the majority of tertiary teaching staff in most countries, women have reached or exceeded parity in a number of countries, such as in Finland (53%), Latvia (55%) and Lithuania (56%). Between 2015 and 2024, there has been a notable shift toward greater gender parity in tertiary education. On average, the share of female teachers in tertiary education rose from 43% to 46% over this period. Some countries experienced significant progress: for example, the share of women in the Netherlands increased from 44% of teachers at tertiary level in 2015 to 50% in 2024 (Table D5.1).
Note: Countries are ranked in descending order according to the share of women among teachers at primary level. The colour scale ranges from dark blue to light green, where darker shades indicate higher shares (approaching 100%) and lighter shades indicate lower shares. Grey indicates that data are not available.
1. Upper secondary includes post-secondary non-tertiary.
2. Pre-primary includes early childhood educational development programmes (ISCED 01).
3. Primary includes lower secondary.
4. Tertiary includes post-secondary non-tertiary.
5. Lower secondary includes upper secondary.
6. Data on teachers refer to full-time equivalents (FTE) rather than headcounts.
7. Upper secondary includes lower secondary.
8. Year of reference differs from 2024.
9. Primary includes pre-primary and lower secondary.
For data, see Table D5.1. The data for this figure can be accessed via https://stat.link/4t97hi.
The increasing share of women in tertiary teaching across several OECD countries reflects both broader societal change and the impact of targeted policy interventions aimed at addressing structural barriers within academia such as persistent gender biases in recruitment, promotion and recognition, as well as unequal access to professional networks and research funding. Several countries have implemented measures to improve gender balance. In Switzerland, the Federal Programme “Equal Opportunity at Swiss Universities” established targets for female representation of 25% among full and associate professors and 40% among assistant professors (University of Bern, 2024[12]), and contributed to an increase in the share of women in tertiary teaching from 44% in 2015 to 50% in 2024 (Table D5.1). In the Netherlands, initiatives such as the Aspasia programme, administered by the Dutch Research Council, provided financial incentives to support the promotion of female researchers (NWO, 2021[13]). Combined with broader national strategies on diversity and inclusion, these measures have supported progress towards gender parity in tertiary education. While these developments suggest that targeted policies can accelerate progress, their impact remains uneven.
Gender disparities in school management
Despite the high degree of feminisation in the teaching profession, women remain consistently under-represented in management roles relative to their share of the teaching workforce across almost all OECD countries. Research suggests women are less likely to pursue leadership positions because of concerns about workload, work-life balance and self-confidence in leadership readiness (OECD, 2019[14]). This "leaky pipeline" is particularly apparent at higher levels of education.
Women are more strongly represented in management roles at lower levels of education, partly because access to leadership positions is often linked to prior teaching experience, and women constitute the vast majority of teachers in pre-primary and primary education. In 2024, women accounted for 90% of school management personnel in pre-primary education across OECD countries, compared to 67% in primary education, 61% in lower secondary education and 53% in upper secondary education. The share has also increased steadily over the past decade. In upper secondary education, for example, the average share of women in management positions rose from 46% in 2015 to 53% in 2024, reflecting the way wider efforts to improve gender balance in teaching roles have also increased women representation in management positions (Table D5.2).
The representation of women in school management varies widely across countries, reflecting broader labour-market patterns and cultural norms around leadership. In primary education, women account for nearly all management staff in Lithuania (95%) and the Slovak Republic (90%), but only 29% in Japan. At upper secondary level, the disparities are even greater, ranging from 79% in Lithuania to just 15% in Japan, 22% in Korea and 35% in Switzerland (Table D5.2).

Note: Countries above the diagonal line have a higher proportion of women teachers than women in school management.
1. Data on teachers and school management refer to full-time equivalents (FTE) rather than headcounts.
For data, see Table D5.1 and Table D5.2. The data for this figure can be accessed via https://stat.link/4t97hi.
Figure D5.3 shows how the gap between teaching and management roles differs across countries at primary level. On average across OECD countries, women make up 83% of primary teachers but hold 67% of school management positions. In Japan, women represent 63% of primary teachers but only 29% of school management staff. Large gaps are also observed in Hungary (where women are 95% of the teachers but only 79% of leaders) and Korea (77% versus 52%), albeit with women forming the majority in both roles. In contrast, Denmark stands out as one of the few countries where women are more strongly represented among school management personnel than among teachers themselves, accounting for 73% of school management personnel compared to 67% of teachers in primary education (Table D5.1; Table D5.2).
Making teaching more attractive through visible career progression
In most OECD countries, school management is not a separate profession but a career progression from teaching that requires substantial classroom experience. On average, school heads in public primary and secondary schools must be fully qualified teachers in nearly two-thirds of OECD systems (OECD, 2022[15]). In France, becoming a chef d’établissement at the secondary level requires passing a national competitive examination after several years of teaching and completing leadership training (Ministry of National Education, 2018[16]). In England (United Kingdom), aspiring school heads generally complete the National Professional Qualification for Headship (NPQH), following teaching experience (UK Government, 2023[17]). However, pathways into school leadership vary across systems, with some countries offering more flexible routes and less formalised leadership structures.
The structure of management personnel has direct implications for teacher supply, particularly recruitment. Systems where management roles (principal, assistant principal, head teacher) are clearly defined, attainable and visible as career progression tend to make teaching more attractive, especially for candidates who value advancement, status and decision-making authority. Evidence from the OECD’s Teaching and Learning International Survey (TALIS) shows that teachers’ perceptions of career opportunities are positively associated with job satisfaction and retention (OECD, 2025[8]).
The workload and design of leadership roles are important factors shaping the attractiveness of management positions within the teaching profession. If leadership roles are too burdensome, fewer teachers will aspire to them; if they are too diffuse, they may not function as strong incentives. Among OECD countries principals tend to report very high workloads and administrative burdens, which can discourage teachers from moving into leadership and create bottlenecks in the career pipeline (OECD, 2025[8]). Nordic countries such as Norway and Sweden distribute leadership tasks across teams, which can make progression more accessible but may dilute incentives if roles are less distinct or well rewarded (Sundberg and Hovdhaugen, 2026[18]).
Working patterns and working-time intensity of the teaching workforce
The average working-time intensity of teachers is calculated as the ratio of full-time equivalent (FTE) teachers to total headcount. It reflects the prevalence of part-time employment and thus the effective amount of teaching that the teaching workforce can deliver. A ratio of 1.00 indicates that all teachers are employed full-time, while lower values reflect a greater reliance on part-time arrangements. Across OECD countries, working-time intensity remains relatively high but varies slightly by level of education, averaging 0.91 in pre-primary, 0.92 in primary and 0.89 in secondary education in 2024. These figures suggest that although most teachers work full-time, part-time employment remains a significant feature of the profession, particularly at the secondary level (Table D5.3).
There are substantial cross-country differences in working-time intensity, reflecting national approaches to labour-market flexibility and work-life balance – greater flexibility in working hours is not necessarily confined to teaching but reflects broader labour-market trends (see Chapter A6). In countries such as Colombia, Costa Rica and the Republic of Türkiye, the ratio is 1.00 across all education levels, indicating almost all teachers work full time. In contrast, the ratio is considerably lower in Switzerland (0.62 at primary level and 0.64 at secondary level) and the Netherlands (0.73 at primary level and 0.80 at secondary level), suggesting that part-time work is institutionalised within the teaching profession in these countries. Germany also reports comparatively low working-time intensity, with the ratio of full-time equivalent teachers to total teacher headcount reaching 0.77 at primary level and 0.81 at secondary level reflecting broader work-life balance preferences within a female-dominated workforce and the wider prevalence of part-time work arrangements in the labour market (Table D5.3).
Although working-time intensity is almost identical for men and women on average across OECD countries, respectively at 0.88 and 0.89 among teachers in secondary education, gender differences emerge at national level. Women have lower working-time intensity than men in the Netherlands, with ratios of 0.75 for women compared to 0.86 for men, and in Switzerland, where it is 0.61 compared to 0.68. A similar gap exists in the United Kingdom, where the ratio for women is 0.91 compared to 0.97 for men. Balancing this out are countries which display the opposite trend. In the Slovak Republic, the ratio is 0.74 for men compared to 0.86 for women, while in Lithuania the figures are 0.78 for men and 0.89 for women (Table D5.3). Working-time intensity also differs by age group, as discussed in Chapter D4.
The prevalence of part-time work is partially shaped by teachers’ personal preferences and pursuit of work-life balance. Gender differences often reflect broader societal patterns in which women are more likely to choose part-time employment to balance professional and domestic responsibilities. Across OECD countries, around half of teachers report that one reason for entering the profession was the desire for working hours which were compatible with family responsibilities (OECD, 2025[8]). Such motivations are reflected in working-time intensity patterns. For example, Latvia, where flexible working hours are frequently cited as an important reason for choosing teaching, records lower FTE-to-headcount ratios than countries such as Bulgaria, where such motivations are less common and working-time intensity is higher (Table D5.3). Part-time working can also support teacher well-being and retention by offering greater flexibility and reducing burnout risks. Evidence from Germany, for example, associates reduced working hours with improved mental health outcomes among teachers, although sometimes at the cost of slower career progression (Seibt and Kreuzfeld, 2023[19]).
At the same time, labour-market structures and institutional conditions also play a key role. Part-time employment may be voluntary or involuntary, depending on the availability of full-time positions and broader labour-market conditions. In some education systems, part-time contracts serve as entry pathways for younger teachers or facilitate the recruitment of professionals with specialised expertise, particularly in secondary education (see Chapter D4). However, these arrangements may also be associated with reduced job security, fragmented workloads and weaker professional integration. In some contexts, part-time arrangements can increase teacher supply by enabling professionals to combine teaching with employment in other sectors, as observed in Mexico and the Slovak Republic. In Lithuania, the relatively high share of part-time male secondary teachers is largely linked to their concentration in subjects such as physical education, arts and non-formal education, where teaching loads are typically limited to only a small number of weekly hours.
Part-time employment therefore represents both a challenge and an opportunity for education systems. Part-time work can be used to enhance the attractiveness of teaching through greater flexibility but in turn means that larger numbers of teachers are required to meet staffing needs. It may also contribute to inequalities through lower lifetime earnings, fewer leadership opportunities and reduced pension entitlements (OECD, 2019[14]). From a policy perspective, part-time employment can also be viewed as a form of latent workforce capacity. Increasing the working hours of part-time teachers, where feasible, may help alleviate shortages more rapidly than recruiting new entrants, although such measures must be carefully balanced against some teachers’ strong preferences for flexible working arrangements.
Educational attainment requirements and teacher preparedness
Minimum attainment required to teach
Minimum educational attainment requirements for teachers vary considerably across OECD countries, although there is a clear trend toward higher levels of attainment as students progress through the education system. Although a bachelor’s degree (ISCED 6) remains the most common requirement for entering the profession, increasingly many countries now require a master’s degree (ISCED 7), particularly at secondary level, to ensure teachers possess both strong subject knowledge and advanced pedagogical skills. In most OECD countries pre-primary teachers are required to hold at least a bachelor’s degree, although countries such as France, Italy and Portugal require them to have a master’s degree. In contrast, some countries still permit teachers at this level to start with lower levels of attainment, including upper secondary education in Czechia and the Slovak Republic, and post-secondary non-tertiary education in Colombia and Ireland, illustrating the diversity of national pathways into teaching (see Box D5.1). Additionally, in many countries, simply meeting the national minimum educational requirements is not enough to be considered as qualified, as it does not ensure that individuals have the specific pedagogical knowledge or training required for teaching. For instance, in Chile, the minimum educational attainment requirement across all levels of education is a bachelor’s degree but this must specifically correspond to a teaching degree (pedagogía) to satisfy national minimum requirements; other bachelor’s degrees are not considered sufficient. This ensures that minimum attainment requirements are explicitly linked to teacher preparation and subject-specific pedagogy (Table D5.4).
Attainment requirements in pre-primary education vary more widely than in primary or secondary education, reflecting historically fragmented governance structures and multiple routes into the profession. In many countries, pre-primary education staff may enter the workforce through vocational, post-secondary non-tertiary or tertiary pathways, creating greater variations in attainment profiles than at other levels of education. This may reflect the fact that in many countries, pre-primary education has traditionally been seen as offering care rather than a purely pedagogical service, resulting in attainment thresholds that are set below those required for school-level teaching (OECD, 2019[20]).
Countries have had to balance workforce expansion and quality standards in pre-primary. In Germany, for example, states have in recent years made progress in the recognition of foreign credentials but have also relaxed pedagogical licensing regulations, in response to mounting pre-primary staff shortages that risks undermining quality if not accompanied by clear compositional standards within settings (Grgic and Friederich, 2023[21]). While these developments have increased workforce supply, available evidence suggests that the overall qualification structure of the workforce has remained robust despite substantial employment growth, indicating that workforce expansion has not necessarily been accompanied by a decline in qualification levels (Autor:innengruppe Fachkräftebarometer, 2025[22]). This illustrates how attainment gaps in the pre-primary teaching workforce do not just reflect legacy regulatory designs but increasingly also the impact of active policy accommodations to chronic staffing pressures, a pattern with significant implications for the quality and equity of foundational learning for young children (Urban et al., 2012[23]).
At primary and lower secondary level, attainment requirements tend to become both more demanding and more standardised across countries. In primary education, most OECD countries require teachers to hold at least a bachelor’s degree, although countries such as Finland, and Germany require a master’s degree at this level. This trend becomes more pronounced in secondary education. Although a bachelor’s degree remains sufficient in countries such as Australia, Canada and Greece, nearly half of the countries with available data require lower secondary teachers to hold a master’s degree. In some systems, attainment requirements are tiered according to the level taught. For example, Denmark and the Netherlands require a bachelor’s degree for lower secondary teachers but a master’s degree for upper secondary teaching (Table D5.4).
At upper secondary level, attainment requirements display greater diversity, particularly according to programme orientation and subject area. Teachers of general subjects are almost universally required to hold bachelor’s or master’s degrees, whether they teach in general or vocational programmes. However, attainment requirements for technical, practical and vocational subjects are often more flexible. In countries such as Luxembourg, Poland and Sweden, vocational or technical instructors may enter the profession with post-secondary non-tertiary attainment, allowing schools to recruit individuals with substantial industry expertise who may not hold a tertiary degree. This flexibility reflects the importance of occupational experience in vocational education, where practical knowledge is essential for preparing students for the labour market (Figure D5.4).
Note: Different colours are used to reflect the ISCED level of minimum educational attainment required. Data are based on an ad-hoc survey administered in March 2026 to delegates of the INES Working Party.
See Annex 3 for further details on programmes classified as having “various” levels of minimum educational attainment required.
Overall, these varied frameworks illustrate how upper secondary systems balance two competing priorities: the academic professionalisation of teaching and the need to maintain the labour-market relevance of vocational education. Persistent teacher shortages, particularly in science, technology, engineering and mathematics (STEM) and vocational subjects where competition with higher-paying private-sector employment is strong, have further encouraged countries to diversify attainment pathways and introduce second-career routes into teaching (see Chapter 1). Many systems therefore combine academic attainment requirements with practical experience to facilitate the recruitment of industry professionals while preserving educational standards.
Percentage of teachers meeting national educational attainment requirements
Although the vast majority of teachers across OECD countries meet the national minimum educational attainment requirements, there are significant variations across countries and education levels. On average across OECD countries in 2024, 87% of teachers meet current attainment requirements at pre-primary level, 88% at primary level and 89% at lower secondary level. Several countries, including Korea and Poland, report that nearly 100% of teachers at the pre-primary and primary levels meet the required attainment levels. However, these high averages mask substantial disparities elsewhere; for instance, only 35% of teachers in primary education meet the requirements in Sweden and 73% in Germany, while in lower secondary education, it is as low as 41% in Iceland, 74% in Luxembourg, and 63% in Sweden (Table D5.4). These disparities reflect the interaction between rising educational attainment requirements and the need to address teacher shortages through alternative career pathways. This percentage of teachers meeting national education attainment requirements differs from the share of ‘fully qualified teachers’ (see Chapter 1), as meeting these requirements alone is often insufficient to qualify as a teacher and does not necessarily ensure the required pedagogical training or knowledge.
Interpreting these figures requires a clear distinction between teachers who were recruited under current minimum educational attainment requirements and those who started teaching when earlier standards applied. Minimum attainment levels are not static; many OECD countries have progressively raised requirements, for example from a bachelor’s degree to a master’s degree for lower secondary teachers, as Iceland and Sweden have done. In Sweden, a large proportion of more experienced primary and lower secondary teachers hold a degree at ISCED level 6, which was the previous national requirement. It is also possible to qualify as a teacher by complementing subject studies with pedagogical training (KPU, kompletterande pedagogisk utbildning). Some teachers following this pathway have 180 credits and are therefore classified at ISCED level 6 rather than ISCED level 7. A similar situation can be observed in Iceland, where a 2008 reform raised the standard teacher attainment requirement from a bachelor’s degree to a master’s degree. The transition period ended in July 2011, after which only master’s-level graduates could obtain teacher certification. Given the ageing teacher workforce, many current teachers qualified under the previous requirements. These teachers are generally considered qualified and possess a valid teaching certificate. As a result, a substantial share of current teachers hold educational attainments that were fully compliant under previous regulations but fall below new entry standards. These “legacy teachers” remain formally recognised as qualified within national systems, even if they do not meet updated academic thresholds (Table D5.4, Notes; Figure D5.4, Notes). This distinction is particularly important in countries with ageing teaching populations, where a seemingly low share of teachers meeting current attainment requirements may simply reflect past regulatory regimes.
Based on national minimum educational attainment requirements applicable in 2024
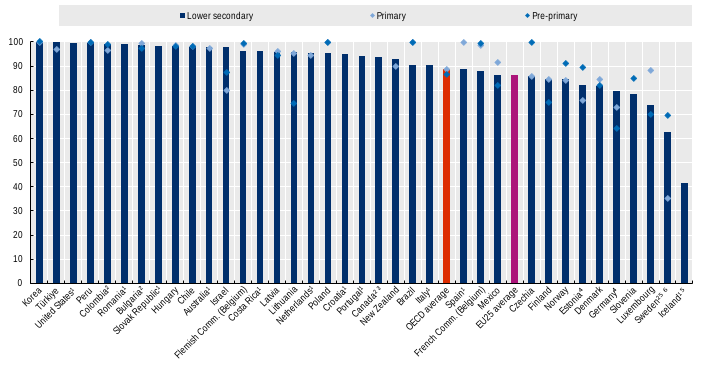
Note: Minimum educational attainment requirements may have changed over time. In some countries, teachers who met previous requirements may no longer meet current minimum educational attainment levels, while still being considered fully qualified due to their experience or according to national regulations.
1. Data are based on TALIS and refer to teachers’ self-reported highest level of formal education.
2. Year of reference differs from 2024.
3. Lower secondary includes pre-primary and primary.
4. Pre-primary includes early childhood educational development programmes (ISCED 01).
5. The minimum attainment requirements for teachers have increased from ISCED level 6 to ISCED level 7 at lower secondary level leading to lower reported shares.
6. Excludes teachers who qualify by complementing subject studies with pedagogical training and hold an ISCED level 6 qualification.
For data, see Table D5.4. The data for this figure can be accessed via https://stat.link/4t97hi.
In systems facing acute recruitment pressures, schools may employ individuals who have not yet completed the required degree or pedagogical training. There is a policy trade-off between maintaining high entry standards and ensuring adequate staffing, with potential implications for long-term workforce quality and preparedness. However, although higher attainment requirements can constrain teacher supply during periods of labour-market pressure, cross-country evidence suggests they are not the primary driver of teacher shortages. Recruitment challenges are observed across systems with both high and moderate minimum attainment requirements thresholds. Countries such as Germany, Finland and Sweden, which require teachers to hold at least a master’s degree, continue to face shortages in specific subjects and regions. However, so too do systems with lower formal thresholds such as Hungary, underscoring the importance of other factors such as training capacity, working conditions, ageing workforces and wider labour-market competition (see Chapter 1).
Most education systems already incorporate significant flexibility into teacher recruitment, even where formal minimum attainment requirements are stringent. Across OECD countries, common mechanisms include temporary appointments, substitute teaching roles, emergency hiring provisions, the recruitment of individuals still completing formal training and the recognition of legacy credentials acquired under previous regulatory frameworks (Eurydice, 2023[24]). Alternative and employment-based pathways have also expanded in response to shortages, particularly for second-career entrants and in high-need areas such as STEM and vocational education (see Chapter 1). Collectively, these practices indicate that the implementation of minimum educational attainment policies is often more flexible in practice than formal regulatory frameworks suggest.
Classroom teachers: Professional personnel primarily responsible for guiding and directing students' learning experiences through the planning, organisation and conduct of group activities. The category includes special education teachers and practitioners in ISCED 0, but excludes teachers’ aides and personnel whose main function is management or administration rather than instruction.
Full-time equivalent teachers (FTE): A standardised unit expressing workloads relative to full-time employment. FTEs are calculated by dividing contractual working hours by the normal annual statutory hours for the reference period. This conversion allows for the expression of diverse working patterns in a single unit for international comparison and ratio calculations.
Minimum educational attainment required to teach refers to the minimum ISCED level of educational attainment officially required by national authorities for entering the teaching profession at a given level of education in 2024.
Part-time teachers: Educational personnel whose contractual working hours are less than 90% of the normal or statutory hours required for a full-time employee in the same role and education level. This classification is regarded as an attribute of the individual employment contract rather than a characteristic of the education programme. A teacher who holds multiple part-time positions in different schools is classified as a full-time teacher if their combined workload exceeds 90% of the statutory working hours
School management personnel: Professional staff responsible for the management and administration of educational institutions. This category includes principals, head teachers and assistant principals at ISCED levels 0-3, as well as deans and department heads at tertiary levels whose principal activity is administrative. It excludes administrative support staff such as secretaries or clerks.
Teachers meeting national educational attainment requirements refers to teachers whose educational attainment meets or exceeds the minimum national educational attainment requirements applicable in 2024 for the level of education they teach.
Working-time intensity: refers to the average proportion of a full-time workload carried by teachers. In this chapter, it is measured through the ratio of FTE teachers to total teacher headcount. Values below 1 indicate the presence of part-time employment within the teaching workforce.
The share of women among teachers is calculated by dividing the headcount of female teachers by the headcount of all teachers. This indicator is computed separately for each level of education, from pre-primary (ISCED 0) to tertiary education (ISCED 5-8).
The share of women in management is calculated by dividing the headcount of female management staff by the headcount of all management staff.
The share of teachers meeting national minimum educational attainment requirements is calculated by first excluding teachers whose educational attainment is unknown from the total headcount, and then dividing the number of teachers meeting the national minimum educational attainment requirement at a given level of education by the resulting total. This approach is adapted from the methodology used to compute SDG Indicator 4.c.1 in order to control for unknown values and to best reflect each country's regulatory context.
Data refer to the 2023/24 academic year and are based on the UNESCO-Institute of Statistics (UIS)/OECD/Eurostat data collection on education statistics administered by the OECD in 2025. Data for some countries may have a different reference year. For more information see Education at a Glance 2026 Sources, Methodologies and Technical Notes (https://doi.org/10.1787/dcf64a14-en)
The UNESCO Institute of Statistics (UIS) provided some data for Argentina, the People’s Republic of China, India, Indonesia, Saudi Arabia, South Africa and Thailand.
References
[22] Autor:innengruppe Fachkräftebarometer (2025), Fachkräftebarometer Frühe Bildung 2025. Weiterbildungs-initiative Frühpädagogische Fachkräfte. Bielefeld, https://doi.org/10.3278/9783763979578.
[6] Brody, D. and H. Ziv (2020), “Hybridized agency among male early childhood workers as a factor in their career decisions”, Early Years, Vol. 40/1, pp. 20-36, https://doi.org/10.1080/09575146.2019.1605335.
[24] Eurydice (2023), Structural Indicators for Monitoring Education and Training Systems in Europe: The Teaching Profession, Publications Office of the European Union, https://doi.org/10.2797/849109.
[3] Gibbons, A. (2020), “The negation of babysitting: Deconstruction and care in early childhood”, Global Studies of Childhood, Vol. 10/4, pp. 358–367, https://doi.org/10.1177/2043610620978507.
[21] Grgic, M. and T. Friederich (2023), “Innovative ways of handling staff shortages in ECEC? Increasing flexibility in the regulatory frameworks for non-traditional and non-German professional staff qualifications”, International Journal of Child Care and Education Policy, Vol. 17/22, https://doi.org/10.1186/s40723-023-00126-3.
[1] Kammermeier, M. et al. (2025), “Feminization of teaching: Gender and motivational factors of choosing teaching as a career”, Frontiers in Education, Vol. 10, https://doi.org/10.3389/feduc.2025.1471015.
[9] Leuze, K. and S. Strauß (2016), “Why do occupations dominated by women pay less? How ‘female-typical’ work tasks and working-time arrangements affect the gender wage gap among higher education graduates”, Work, Employment and Society, Vol. 30/5, pp. 802-820, https://doi.org/10.1177/0950017015624402.
[16] Ministry of National Education (2018), “To be part of the management team”, https://www.education.gouv.fr/etre-personnel-de-direction-6830.
[13] NWO (2021), Aspasia, Nederlandse Organisatie voor Wetenschappelijk Onderzoek, https://www.nwo.nl/sites/nwo/files/media-files/Program%20Brochure%20Aspasia%202020_ENG.pdf.
[8] OECD (2025), Results from TALIS 2024: The State of Teaching, TALIS, OECD Publishing, Paris, https://doi.org/10.1787/90df6235-en.
[7] OECD (2023), Joining Forces for Gender Equality: What is Holding us Back?, OECD Publishing, Paris, https://doi.org/10.1787/67d48024-en.
[15] OECD (2022), Education at a Glance 2022: OECD Indicators, OECD Publishing, Paris, https://doi.org/10.1787/3197152b-en.
[11] OECD (2020), Building a High-Quality Early Childhood Education and Care Workforce: Further Results from the Starting Strong Survey 2018, TALIS, OECD Publishing, Paris, https://doi.org/10.1787/b90bba3d-en.
[20] OECD (2019), Good Practice for Good Jobs in Early Childhood Education and Care, OECD Publishing, Paris, https://doi.org/10.1787/64562be6-en.
[14] OECD (2019), TALIS 2018 Results (Volume I): Teachers and School Leaders as Lifelong Learners, TALIS, OECD Publishing, Paris, https://doi.org/10.1787/1d0bc92a-en.
[5] Quinones, G., M. Barnes and E. Berger (2021), “Early childhood educators’ solidarity and struggles for recognition”, Australasian Journal of Early Childhood, Vol. 46/4, pp. 183-193, https://doi.org/10.1177/18369391211050165.
[19] Seibt, R. and S. Kreuzfeld (2023), “Working time reduction, mental health, and early retirement among part-time teachers at German upper secondary schools - a cross-sectional study”, Frontiers in Public Health, Vol. 11, https://doi.org/10.3389/fpubh.2023.1293239.
[18] Sundberg, R. and E. Hovdhaugen (2026), “Shared Leadership and Governance in Swedish and Norwegian Schools: Implications for Leadership Autonomy in Quality Work”, Nordic Journal of Comparative and International Education (NJCIE), Vol. 10/2, https://doi.org/10.7577/njcie.6467.
[17] UK Government (2023), Headship national professional qualification, Department for Education, https://www.gov.uk/guidance/headship-national-professional-qualification.
[2] UNESCO (2024), Global Report on Teachers: Addressing Teacher Shortages and Transforming the Profession, United Nations Educational, Scientific and Cultural Organization, Paris, https://doi.org/10.54675/FIGU8035.
[12] University of Bern (2024), Federal Programme Equal Opportunities: P-7 Diversity, inclusion and equity in higher education development (2021-2024), https://www.swissuniversities.ch/fileadmin/swissuniversities/Dokumente/Forschung/Chancengleichheit/web_DCC_Broschu%CC%88re_e.pdf.
[23] Urban, M. et al. (2012), “Towards competent systems in early childhood education and care. Implications for policy and practice”, European Journal of Education, Vol. 47/4, pp. 508-526, https://doi.org/10.1111/ejed.12010.
[10] Verzola Vaz, D. and D. Camargo Botassio (2022), “Occupational feminization and pay: the case of Brazil”, Brazilian Review of Econometrics, Vol. 42/1, https://doi.org/10.12660/bre.v42n12022.85018.
[4] Wu, S. (2023), “Critically consider the role of gender in early childhood education.”, Research and Advances in Education, Vol. 2/1, pp. 41-49, https://doi.org/10.56397/RAE.2023.01.07.
The data for the figures and tables in this chapter, can be downloaded via https://stat.link/4t97hi.
To access further data and/or other education indicators, please visit the OECD Data Explorer: http://data-explorer.oecd.org/s/4s.
Data cut-off for the print publication 17 June 2026. Please note that the Data Explorer contains the most recent data.
a – category not applicable; b – break in series; d – contains data from another column; m – missing data; x – contained in another column (indicated in brackets). For further control codes, see the Reader’s Guide.
For further methodological information, see Education at a Glance 2025: Sources, Methodologies and Technical Notes https://doi.org/10.1787/dcf64a14-en).
1. Year of reference differs from 2015: 2016 for Colombia, France and the United Kingdom; and 2017 for Indonesia and Slovenia.
2. Pre-primary includes early childhood educational development programmes (ISCED 01).
3. The data on teachers are expressed in full-time equivalents (FTE) rather than headcounts and cover public and government-dependent private institutions at the pre-primary, primary, lower secondary and upper secondary levels, while only public institutions are included at all other education levels.
4. Year of reference differs from 2024: 2023 for India and South Africa.
The data for this table can be accessed via https://stat.link/4t97hi.
1. Year of reference differs from 2015: 2016 for Colombia, Costa Rica, France and the United Kingdom; 2017 for Canada; 2018 for Denmark and Ireland; and 2019 for Belgium.
2. Data on school management refer to full-time equivalents (FTE) rather than headcounts.
3. Pre-primary includes early childhood educational development programmes (ISCED 01).
4. Upper secondary education includes post-secondary non-tertiary education.
The data for this table can be accessed via https://stat.link/4t97hi.
Based on the ratio of full-time equivalent teachers to total teacher headcount, indicating the average proportion of a full-time workload per teacher.
Note: The FTE-to-headcount ratio for teachers indicates the extent to which teaching capacity is delivered through full-time or part-time employment.
1. Data for primary include lower secondary education; data for secondary relate only to upper secondary education.
2. Year of reference differs from 2015: 2016 for Colombia, Mexico and the United Kingdom; 2017 for Slovenia; and 2018 for Denmark and Greece.
3. Pre-primary includes early childhood educational development programmes (ISCED 01).
4. Secondary education includes post-secondary non-tertiary education.
5. Includes only public and government dependent private institutions.
6. Secondary education includes only general programmes.
The data for this table can be accessed via https://stat.link/4t97hi.
Based on national minimum educational attainment requirements applicable in 2024
Note:
- Data on the minimum educational attainment required for teachers and the share of teachers meeting national qualification standards are primarily based on the UIS TEACH questionnaire, which collects administrative data reported by countries on teachers’ highest level of education and national qualification requirements. For a limited number of countries where TEACH data are not available, information is derived from the OECD Teaching and Learning International Survey (TALIS), based on teachers’ self-reported highest level of formal education. As a result, data for these countries are not strictly comparable with those based on administrative sources and should be interpreted with caution.
- The minimum educational attainment required to teach at upper secondary level primarily refers to general programmes. Qualification requirements may vary depending on programme orientation and subject taught. See Figure D5.4 for further details.
Minimum educational attainment requirements may have changed over time. In some countries, teachers who met previous requirements may no longer meet current minimum educational attainment levels, while still being considered fully qualified due to their experience or according to national regulations.
- The column on the share of teachers meeting minimum national educational attainment requirements at the upper secondary level is web-only. This reflects the need for cautious interpretation, given cross-country differences in such requirements, particularly between general and vocational programmes.
- ISCED 7 refers to a master’s degree or equivalent, ISCED 6 to a bachelor’s degree or equivalent, ISCED 5 to short-cycle tertiary education, ISCED 4 to post-secondary non-tertiary education, and ISCED 3 to upper secondary education.
1. Data are based on TALIS and refer to teachers' self-reported highest level of formal education
2. Year of reference differs from 2024: 2025 for Bulgaria and Sweden; 2023 for Colombia; and 2021 for Canada.
3. Upper secondary education includes post-secondary non-tertiary education.
4. Pre-primary includes early childhood educational development programmes (ISCED 01).
5. The minimum attainment requirements for teachers have increased from ISCED level 6 to ISCED level 7 at lower secondary level leading to lower reported shares.
6. Excludes teachers who qualify by complementing subject studies with pedagogical training and hold an ISCED level 6 qualification.
The data for this table can be accessed via https://stat.link/4t97hi.