In most OECD and partner countries, young men are more likely than young women to lack an upper secondary qualification. On average across OECD countries, 14% of men aged 25-34 have not completed upper secondary education, compared to 11% of women of that age.
As tertiary education has expanded over the past decade, vocational upper secondary attainment has become less common. On average across OECD countries, 25% of 55-64 year-olds have this as their highest educational qualification, compared to 19% of 25-34 year-olds.
The most common level of tertiary educational attainment is a bachelor’s or equivalent, with about 48% of tertiary-educated 25-64 year-olds having a bachelor’s degree as their highest level of education.
Education at a Glance 2026
OECD Indicators

In per cent, 25-64 year-olds

1. Year of reference differs from 2025.
For data, see Table A1.1. The data for this figure can be accessed via https://stat.link/tcxh4.
Context
Educational attainment is a key indicator of human capital and plays an important role in shaping labour-market outcomes and broader well-being. Higher levels of educational attainment are generally associated with stronger employment prospects (see Chapter A3) and higher earnings (see Chapter A4), and have implications for an individual’s work-life balance (see Chapter A6). As economies evolve and skill demands change, education systems face the challenge of equipping learners with the knowledge and skills needed to succeed in both work and society.
Over recent decades, tertiary attainment has increased substantially across OECD countries, while vocational education and training (VET) at the upper secondary and post-secondary non-tertiary levels remains an important component of education systems. Historically, vocational education at the upper secondary and post-secondary levels and tertiary education have often been viewed as distinct or alternative pathways to the labour market, reflecting the fact that most students entering tertiary education follow a general programme at the upper secondary level in many OECD countries. In practice, however, vocational and tertiary pathways often respond to different learner preferences, labour-market needs and institutional contexts, rather than representing competing alternatives. At the same time, the distinction between these pathways is becoming less pronounced in many countries, as tertiary programmes increasingly incorporate applied and work-based learning components and vocationally oriented programmes at the short-cycle tertiary level expand opportunities for progression to higher levels of education (OECD, 2022[1]). Overall, it is imperative to ensure that higher attainment is accompanied by corresponding improvements in skills.
Understanding educational attainment patterns requires moving beyond the assumption that tertiary education is always “better”, and furthermore beyond the idea that vocational and tertiary education are mutually exclusive. Educational pathways differ in their objectives, content and expected outcomes, and their value depends on individual aspirations, further learning opportunities and labour-market conditions. As education systems adapt to changing skill demands, expanding progression opportunities between different levels and orientations of education has become an increasingly important policy objective.
This chapter examines educational attainment across OECD countries, covering below upper secondary, upper secondary and tertiary education and paying particular attention to the distribution of qualifications across different educational levels and programme orientations. Educational attainment statistics provide an important indicator of the skills and qualifications available within a population, helping to inform assessments of educational and labour-market outcomes, economic competitiveness, and social inclusion.
Other findings
Educational attainment and skills proficiency are closely linked across OECD countries. Across OECD countries, more than four in five adults demonstrating high skills across literacy, numeracy and adaptive problem solving hold a tertiary qualification. Meanwhile adults with below upper secondary education make up less than 1% of this high-skilled group.
Although most people with high skills hold a tertiary qualification, not everyone with tertiary attainment has high skills. Around 18% of adults with low skills in all domains hold tertiary qualifications, indicating that formal qualifications alone do not fully capture adults' proficiency levels.
Regional data reveal significant differences in access to education. In Mexico, the share of adults with below upper secondary attainment ranges from 32% in México D.C. to 69% in Chiapas, a gap of 37 percentage points. In Spain, the difference between the Basque Country (20%) and Ceuta (49%) reaches 29 percentage points, while in the Republic of Türkiye the share ranges from 36% in Ankara to 69% in Southeast Anatolia - Middle, corresponding to a gap of 33 percentage points.
Below upper secondary attainment
Completing upper secondary education has become a baseline requirement for successful participation in many modern economies and societies. Adults without an upper secondary qualification face higher risks of unemployment, lower earnings and less flexible working arrangements than their more educated peers (see Chapters A3, A4 and A6). Adults with low educational attainment are also less likely to participate in adult learning and training opportunities, limiting their ability to adapt to changing skill demands throughout their working lives (see Chapter A5).
Despite the expansion of education systems over recent decades, on average across OECD countries, 18% of adults aged 25-64 had not attained an upper secondary qualification in 2025. In Costa Rica and Mexico about 50% of adults or more lack upper secondary attainment (Table A1.1).
Educational attainment has continued to improve among younger generations. Across OECD countries, the share of 25-34 year-olds without upper secondary attainment has fallen from 17% in 2015 to 12% in 2025. Among OECD countries, Mexico recorded the highest share of young adults with below upper secondary attainment in both 2015 and 2025, although it has fallen from 55% in 2015 to 40% in 2025 showing significant progress. At the other end of the scale, Korea recorded the lowest share in both years, with 2% in 2015 and 1% in 2025 (Table A1.2).
In most OECD and partner countries, young men are more likely than young women to lack an upper secondary qualification. On average across OECD countries, 14% of young men aged 25-34 have not completed upper secondary education, compared to 11% of young women. Gender gaps of 8 percentage points or more are observed in Argentina, Brazil, Costa Rica, Estonia, Spain and Portugal. Only in Türkiye, Bulgaria, India, Indonesia, Peru and Romania (among OECD and partner countries) does the share of young women without upper secondary attainment exceed that of young men (Table A1.2).
Reducing the share of adults without upper secondary education remains a key policy priority across OECD countries. Governments have continued to implement policies aimed at preventing early leaving from education and training, supporting second-chance opportunities and strengthening pathways between education, training and employment (see Box A2.1. in Chapter A2 and Chapter B3).
Upper secondary or post-secondary non-tertiary attainment
Upper secondary attainment can be considered a baseline for favourable labour market outcomes, as adults with only below upper secondary often face high unemployment and low earnings over the lifetime (see Chapters A3 and A4). While some countries have achieved very high levels of at least upper secondary attainment and therefore focus on expanding access to tertiary education, other countries have a continued need to expand access to education at both the upper secondary and tertiary levels.
Figure A1.2 shows that trends in the share of younger adults (25-34 year-olds) whose highest qualification is upper secondary or post-secondary non-tertiary education varied across countries between 2015 and 2025. On average across OECD countries, the share of young adults with this level of attainment declined slightly, from 41% in 2015 to 39% in 2025. In some countries, the share increased markedly, particularly in Costa Rica (from 20% to 31%), Mexico (from 24% to 31%), Portugal (from 34% to 43%) and South Africa (from 39% to 49%). By contrast, sizeable declines were observed for example in Croatia (from 64% to 54%), France (from 42% to 34%), Germany (from 58% to 45%), Ireland (from 39% to 29%) and the United Kingdom (from 36% to 28%).
In all OECD countries where upper secondary attainment rates declined over the past decade, tertiary attainment rates increased, suggesting that the drop is due to learners continuing their education beyond upper secondary rather than because of reduced access to educational opportunities. At the same time, in most countries where upper secondary attainment rates increased, below upper secondary attainment rates have been falling, with more people continuing into upper secondary education. Taken together, these trends point to a broad expansion of educational participation at different levels and across programme orientations across almost all OECD and partner countries over the last decade, (Table A1.2). In many countries, the role of upper secondary education, particularly through vocational education and training (VET) pathways, is closely linked to labour market outcomes; this relationship is explored further in Figure A1.3.
Gender gaps in upper secondary attainment have remained fairly consistent among 25-34 year-olds over the last ten years. Across OECD countries, on average, 44% of young men had upper secondary or post-secondary non-tertiary attainment in 2025, 10 percentage points more than the rate for young women (34%). The gap was similar in 2015, at about 9 percentage points (46% for young men and 37% for young women). The gap is the other way round for tertiary attainment, where the average difference between the share of 25-34 year-old women and men with tertiary attainment is 13 percentage points in favour of women (Table A1.2).
In per cent
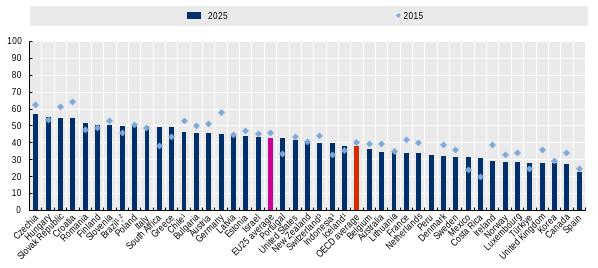
1. Year of reference differs from 2025.
2. Year of reference differs from 2015.
3. A break in 2020 affects the continuity of the data for Switzerland. Please see the Sources, methodologies and technical notes for more information.
For data, see Table A1.2. The data for this figure can be accessed via https://stat.link/tcxh4.
Countries also differ in the extent to which upper secondary education is offered with a vocational orientation and there are substantial differences across countries in the share of adults whose highest attainment is upper secondary vocational education (Table A1.1). As Figure A1.3 shows, older adults are more likely than younger ones to have an upper secondary vocational qualification as their highest level of education in most OECD and partner countries. On average across OECD countries, 25% of 55-64 year-olds have vocational upper secondary attainment, compared to 19% of 25-34 year-olds. The differences are particularly wide in Denmark, Germany, Hungary, Poland and the Slovak Republic, where the share of older adults exceeds that of younger adults by over 20 percentage points. These differences may reflect a combination of factors, including changes in the provision and attractiveness of vocational programmes, as well as expanded opportunities for progression to higher levels of education. Only a few countries show the opposite pattern, with younger adults more likely than older adults to have upper secondary vocational attainment. This is particularly the case in Portugal (19% among 25-34 year-olds compared to 2% among 55-64 year-olds) and Türkiye (12% compared to 6%). In Portugal this pattern is consistent with national reforms expanding the provision of vocational upper secondary education in recent decades (OECD, 2018[2]).
In per cent

1. Year of reference differs from 2025.
For data, see Table A1.3. The data for this figure can be accessed via https://stat.link/tcxh4.
Furthermore, trends suggest that policy priorities, participation patterns and attainment outcomes have evolved over recent years. Recent OECD work has highlighted VET as a key component of education systems and an important pathway for developing skills relevant to the labour market, reflecting increasing policy efforts to strengthen the attractiveness and status of vocational education (OECD, 2023[3]). At the same time, the share of young adults with upper secondary or post-secondary non-tertiary vocational attainment as the highest level attained declined from 25% in 2015 to 23% in 2025 on average across OECD countries. This trend has been consistent for both men and women, with the gender gap at this level remaining at 7 percentage points (Table A1.2, web columns). While this reflects changes in the share of individuals whose highest qualification is vocational education at the upper secondary and post-secondary non-tertiary levels, this is not a clear indication in the overall importance of vocational education. In some countries, declining attainment at upper secondary and post-secondary non-tertiary vocational levels may partly reflect increasing progression into tertiary education, including professionally oriented, applied and higher vocational programmes.
Tertiary attainment
The most common level of tertiary attainment is a bachelor’s degree, with about 48% tertiary-educated 25-64 year-olds having a bachelor’s or equivalent qualification as their highest level of education. This is followed by master’s attainment, with around 34% of tertiary-educated adults holding this degree as their highest qualification. This pattern of attainment reflects strong labour-market demand for highly skilled workers, with bachelor’s and master’s degrees serving as key pathways to employment in knowledge-intensive sectors. In contrast, a relatively low share of tertiary educated adults hold short-cycle tertiary qualifications as their highest educational attainment (16%), while an even smaller share (about 3%) have attained a doctorate (Table A1.1). Although doctoral graduates represent a relatively small share of the population, doctoral education remains essential for research, innovation and the development of advanced skills. Recent OECD analysis also highlights the growing complexity and diversification of academic and research careers, as well as the increasing importance of advanced research and digital competencies across sector (OECD, 2024[4]).
The share of tertiary-educated 25-34 year-olds increased between 2015 and 2025 in almost all OECD countries with comparable data. On average across OECD countries, the share rose from 42% in 2015 to 49% in 2025. Particularly large increases – of 12 percentage points or more – were observed in Chile, Ireland, Luxembourg, Spain, and Türkiye. More moderate increases were recorded in most other OECD countries, while Hungary, Israel and Finland were the only OECD countries to experience either no growth or a slight decrease in tertiary attainment rates over the period (Table A1.2).
Gender differences in tertiary attainment among 25-34 year-olds have seen little improvement over the past ten years. On average across OECD countries, 56% of younger women held a tertiary qualification in 2025, compared to 43% of men. This 13 percentage-point gap favouring women is slightly larger than the 12 percentage-point gap in 2015 (Table A1.2).
Although the overall gender gap has remained relatively stable across OECD countries, trends vary considerably at the national level. In some countries, the tertiary attainment gap between young men and women has widened further over the past decade, increasing by 11 percentage points in Iceland between 2015 and 2024, 9 percentage points in Türkiye and 8 percentage points in Korea. In Türkiye, men and women had almost identical tertiary attainment rates in 2015, but women pulled ahead markedly over the following decade. In contrast, some countries have seen the gap narrow. In Latvia, for example, the gender gap fell by about 9 percentage points, driven mostly by rising tertiary attainment rates among men. However, Latvia had an exceptionally large gender gap in 2015 and still had one of the largest gaps in tertiary attainment across OECD countries by 2025 (Table A1.2).
Educational attainment and skills
Educational attainment is closely associated with the skills adults possess, although higher attainment does not guarantee greater proficiency levels. Drawing on data from the OECD Survey of Adult Skills (PIAAC) (OECD, 2026[5]), Figure A1.4 shows the distribution of the OECD average adults' educational attainment by skill proficiency using a combined measure of proficiency in literacy, numeracy and adaptive problem solving. For more information on the construction of the combined skills measure, see
Methodology section below.
In per cent; 25-64 year-olds; Survey of Adult Skills (PIAAC)

Note: The estimates in this figure are derived from the OECD Survey of Adult Skills. Differences in underlying sources, country composition and population coverage may result in small discrepancies compared to Table A1.1, which is based on the NEAC questionnaire.
For data, see Table A1.4., available online. The data for this figure can be accessed via https://stat.link/tcxh4.
Across OECD countries, more than four out of five adults demonstrating high skills across literacy, numeracy and adaptive problem solving hold a tertiary qualification, while adults with below upper secondary education account for less than 1% of this group. The share of adults holding a tertiary qualification rises sharply when comparing those with medium proficiency levels and those with high levels in at least one domain, increasing from 48% among adults with medium skills in all domains to almost 72% among those demonstrating high skills in at least one domain (Figure A1.4).
Meanwhile, adults with below upper secondary attainment are the least likely to have high skills in at least one domain. Although they make up only 15% of the total population, adults with below upper secondary attainment make up 38% of the population with low skills in all domains. Adults with upper secondary or post-secondary non-tertiary attainment make up the largest share of adults with low skills in all domains, accounting for 44% of this group (Figure A1.4).
Although most people with high skills hold a tertiary qualification, not everyone with tertiary attainment has high skills. Around 18% of adults with low skills in all domains hold tertiary qualifications, indicating that formal qualifications alone do not fully capture adults' proficiency levels (Figure A1.4). In Canada, Denmark, Finland, Israel and Korea, tertiary-educated adults make up more than 25% of the population with low skills across domains – all countries with among the highest levels of tertiary attainment (Table A1.1) and Table A1.4, available online). Together, these results suggest that higher educational attainment does not in itself guarantee high proficiency in foundational skills in adulthood, highlighting the importance of strengthening opportunities for the acquisition and maintenance of these skills across the life course.
Subnational variation in educational attainment
Educational attainment can vary substantially within countries, and these differences often reflect long-standing economic, demographic and geographic disparities within countries. Large cities tend to attract more highly educated individuals because they offer greater access to tertiary education institutions, higher-skilled employment opportunities and more diversified labour markets. By contrast, rural and remote regions often face more limited access to educational opportunities, weaker labour-market demand for highly skilled workers and higher rates of population ageing (OECD, 2024[6]).
Internal migration patterns can further reinforce these regional differences. Younger adults and tertiary graduates are more likely to move towards urban centres in search of education and employment opportunities, contributing to the concentration of highly educated populations in capital regions. Meanwhile, lower educational attainment levels in some rural and economically disadvantaged regions are partly linked to lower incomes, fewer educational pathways and more limited access to services and infrastructure.
The organisation of education systems and labour markets also plays an important role in shaping regional attainment patterns. Countries with strong vocational education and training systems and more balanced regional economic development often exhibit smaller regional disparities, while countries with highly concentrated economic activity may experience larger educational gaps between regions. Regional inequalities in educational attainment are therefore closely linked to broader territorial inequalities in employment opportunities, productivity and economic development (OECD, 2024[6]).
In most OECD countries, overall tertiary attainment rates among 25-64 year-olds vary considerably across subnational regions, with particularly large regional differences in Czechia, Canada and Hungary. The widest differences are in Czechia, where tertiary attainment ranges from 16% in Northwest to 55% in Prague, a gap of 39 percentage points. In Canada, it is 38 percentage points, ranging from 33% in Nunavut to 71% in Ontario, while in Hungary, it ranges from 21% in Northern Hungary to 59% in Budapest, also a difference of 38 percentage points. By contrast, some countries have a more even distribution of tertiary attainment, with narrower gaps between regions. In Slovenia, the gap is only 9 percentage points, ranging from 31% in Eastern Slovenia to 40% in Western Slovenia. In Ireland, it is 10 percentage points, ranging from 53% in Northern and Western to 63% in Eastern and Midland, while in Italy it is 12 percentage points, between Sicily (17%) and Lazio (29%) (Table A1.5, available online).
There are also substantial regional differences in the share of adults with below upper secondary attainment in several OECD countries. Particularly large regional disparities are observed in Canada, Mexico, Portugal and Türkiye. In Canada, the share ranges from 5% in Ontario to 43% in Nunavut, a 38 percentage point difference. Similarly, in Mexico, the share ranges from 32% in México D.C. to 69% in Chiapas, a gap of 37 percentage points. In Türkiye the share ranges from 36% in Ankara to 69% in Southeast Anatolia - Middle, corresponding to a gap of 34 percentage points while in Portugal, the difference between Greater Lisbon (25%) and Autonomous Region of the Azores (57%) is 32 percentage points. Conversely, some countries see more limited regional variation in below upper secondary attainment rates. In Finland, the gap between Northern and Eastern Finland (10%) and Helsinki-Uusimaa (12%) is only 3 percentage points. Similarly, in Lithuania, the difference between the Capital Region (2%) and Central and Western Lithuania Region (5%) is 3 percentage points, similar to that in Slovenia between Western Slovenia (9%) and Eastern Slovenia (12%) (Table A1.5, available online).
Age groups: Adults refer to 25-64 year-olds; younger adults refer to 25-34 year-olds.
Educational attainment refers to the highest level of education successfully completed by an individual.
Levels of education: See the Reader’s Guide at the beginning of this publication for a presentation of all ISCED 2011 levels.
The cognitive skill domains on which PIAAC data are based are literacy, numeracy and adaptive problem-solving:
Literacy in PIAAC Cycle 2 is defined as the ability to access, understand, evaluate and reflect on written texts to achieve one's goals, develop knowledge and potential, and participate in society. This encompasses both traditional print-based texts and digital texts, acknowledging the growing importance of navigating and interpreting information in digital environments. Tasks may involve multiple sources and formats, including continuous (e.g. sentences, paragraphs), non-continuous (e.g. charts, tables) and mixed texts, reflecting a range of genres and contexts.
Numeracy in PIAAC Cycle 2 is accessing, using and reasoning critically with mathematical content, information and ideas represented in multiple ways in order to engage in and manage the mathematical demands of a range of situations in adult life. The assessment covers engagement with mathematical information in both traditional and digital environments, including tasks that require understanding and applying mathematical concepts in real-life contexts. An additional assessment of numeracy components focuses on skills essential for achieving automaticity and fluency in managing mathematical and numerical information.
Replacing the previous domain of problem solving in technology-rich environments, Cycle 2 introduced adaptive problem solving, defined as the capacity to achieve one's goals in dynamic situations where a solution method is not immediately apparent. This requires engaging in cognitive and metacognitive processes to define the problem, search for information and apply a solution across various information environments and contexts. This broader construct reflects the evolving nature of the problem-solving skills needed in today's complex and digital world.
Proficiency levels: In each of the three domains assessed in the OECD Survey of Adult Skills (PIAAC), proficiency is considered as a continuum of ability involving the mastery of information-processing tasks of increasing complexity. The results are represented on a 500-point scale. To help interpret the results, the reporting scales have been divided into “proficiency levels” defined by particular score-point ranges. Six proficiency levels are defined for literacy and numeracy (Levels 1 through 5 plus below Level 1). Each proficiency level is described in terms of the characteristics of the types of tasks that can be successfully completed by adults with proficiency scores in the range of scores that defines a level. Short descriptions of the types of tasks related to each level are provided below, while more details can be found in Tables 2.4, 2.5 and 2.6 in the PIAAC international report (OECD, 2024[7]).
Below Level 1: Basic tasks involving simple text or numerical information.
Level 1 (scores equal to or higher than 176 points): Tasks requiring the identification of information in short texts or simple mathematical operations.
Level 2 (scores equal to or higher than 226 points): Tasks involving integration of information from multiple sources or application of basic mathematical concepts.
Level 3 (scores equal to or higher than 276 points): Tasks requiring interpretation and evaluation of complex texts or more advanced mathematical reasoning.
Level 4 (scores equal to or higher than 326 points): Tasks involving complex reasoning and problem-solving with intricate texts or mathematical information.
Level 5 (scores equal to or higher than 376 points): Tasks requiring the synthesis and critical evaluation of complex information or advanced mathematical concepts.
Table A1.4 (available online) and Figure A1.4 featured the use of combined skills domains. These composite skill profiles were constructed using respondents’ plausible values in the three PIAAC cognitive domains: literacy, numeracy and adaptive problem solving. For each of the plausible values, scores were first classified into three proficiency levels using standard PIAAC thresholds: low (below 226 points), medium (226–325 points) and high (326 points or above). The three domain-specific proficiency levels were then combined to create a detailed 8-category skills profile capturing the distribution of low, medium and high proficiency across domains. The categories ranged from respondents with low skills in all three domains to those with high skills in all three domains, with intermediate categories distinguishing different combinations of skill strengths and weaknesses (e.g. low skills in two domains and medium skills in one domain or medium skills in two domains and high skills in one domain).
Educational attainment profiles are based on annual data on the percentage of the adult population (25-64 year olds) in specific age groups who have successfully completed a specified level of education.
In OECD statistics, recognised qualifications from ISCED 2011 level 3 programmes that are not of sufficient duration for ISCED 2011 level 3 completion are classified at ISCED 2011 level 2 (see the Reader’s Guide). Where countries have been able to demonstrate equivalencies in the labour-market value of attainment formally classified as the “completion of intermediate upper secondary programmes” – such as achieving five good General Certificates of Secondary Education (GCSEs) or equivalent in the United Kingdom (note that each GCSE is offered in a specific school subject) – and “full upper secondary attainment”, attainment of these programmes is reported as ISCED 2011 level 3 completion in the tables that show three aggregate levels of educational attainment (UNESCO-UIS, 2012[8]).
Most OECD countries include people without formal education under the international classification ISCED 2011 level 0. Averages for the category “less than primary educational attainment” are therefore likely to be influenced by this inclusion.
See the OECD Handbook for Internationally Comparative Education Statistics (OECD, 2018[9]) and Education at a Glance 2026 Sources Methodologies and Technical Notes ([link to be added]) for more information.
With regard to PIAAC data, the educational attainment variable is based on education levels (EDLEVEL3), following the International Standard Classification of Education (ISCED) 2011, and grouped into below upper secondary (ISCED 1, 2 and 3 short), upper secondary (ISCED 3 and 4) and tertiary (ISCED 5, 6, 7 and 8). Where possible, foreign qualifications are included as the closest corresponding level in the respective national education systems and doorstep interviews on education (DI_Q04) were included in the educational attainment variable. The distribution across skill domains is based on plausible values for literacy (PVLIT), numeracy (PVNUM) and adaptive problem-solving (PVAPS) scores, educational attainment (EDLEVEL) and demographic variables such as age (adults aged 25 to 64).
Data on educational attainment for most countries are taken from OECD databases, which are compiled from National Labour Force Surveys by the OECD Labour Market, Economic and Social Outcomes of Learning (LSO) Network. Data on educational attainment for Argentina, India and Indonesia are taken from the International Labour Organization (ILO) database.
Data on subnational regions for selected indicators are available in the OECD Regional Statistics Database (OECD, 2026[10]).
Data on proficiency levels are based on the Survey of Adult Skills (PIAAC)(2023) (OECD, 2026[5]). PIAAC is the OECD Programme for the International Assessment of Adult Competencies. See About the Survey of Adult Skills at the beginning of this publication for additional information.
References
[10] OECD (2026), Educational attainment - Regions, OECD Data Explorer, https://stats.oecd.org/Index.aspx?DataSetCode=REGION_EDUCAT.
[5] OECD (2026), PIAAC data and methodology, https://www.oecd.org/en/about/programmes/piaac/piaac-data.html.
[7] OECD (2024), Do Adults Have the Skills They Need to Thrive in a Changing World?: Survey of Adult Skills 2023, OECD Skills Studies, OECD Publishing, Paris, https://doi.org/10.1787/b263dc5d-en.
[6] OECD (2024), OECD Regions and Cities at a Glance 2024, OECD Publishing, Paris, https://doi.org/10.1787/f42db3bf-en.
[4] OECD (2024), “The state of academic careers in OECD countries: An evidence review”, OECD Education Policy Perspectives, No. 91, OECD Publishing, Paris, https://doi.org/10.1787/ea9d3108-en.
[3] OECD (2023), Spotlight on Vocational Education and Training: Findings from Education at a Glance 2023, OECD Publishing, Paris, https://doi.org/10.1787/acff263d-en.
[1] OECD (2022), Pathways to Professions: Understanding Higher Vocational and Professional Tertiary Education Systems, OECD Reviews of Vocational Education and Training, OECD Publishing, Paris, https://doi.org/10.1787/a81152f4-en.
[2] OECD (2018), Education Policy Outlook 2018: Putting Student Learning at the Centre, OECD Publishing, Paris, https://doi.org/10.1787/9789264301528-en.
[9] OECD (2018), OECD Handbook for Internationally Comparative Education Statistics: Concepts, Standards, Definitions and Classifications, OECD Publishing, Paris, https://doi.org/10.1787/9789264304444-en.
[8] UNESCO-UIS (2012), International Standard Classification of Education (ISCED) 2011, UNESCO-UIS, Montreal, https://unesdoc.unesco.org/ark:/48223/pf0000219109.
The data for the figures and tables in this chapter can be downloaded via. https://stat.link/tcxh4.
To access further data and/or other education indicators, please visit the OECD Data Explorer: http://data-explorer.oecd.org/s/4s.
Data cut-off for the print publication 17 June 2026. Please note that the Data Explorer contains the most recent data.
a – category not applicable; b – break in series; c – there are too few observations to provide reliable estimates; d – contains data from another column; m – missing data; r – values are below a certain reliability threshold and should be interpreted with caution x – contained in another column (indicated in brackets). For further control codes, see the Reader’s Guide.
For further methodological information, see Education at a Glance 2026: Sources, Methodologies and Technical Notes (https://doi.org/10.1787/dcf64a14-en).
Percentage of 25–64-year-olds with a given level of education as the highest level attained
Note: Data refer to ISCED 2011 for all countries, except Argentina and India, which use ISCED-97. Total might not add up to 100% for the averages because of missing data for some levels for some countries. Data for Argentina, India and Indonesia are from the International Labour Organization (ILO). Columns with data on the completion of intermediate lower secondary programmes, completion of intermediate upper secondary programmes, and all levels of education are available for consultation online.
1. Year of reference differs from 2025: 2024 for Brazil and Chile; 2023 for Iceland and IndonesiaThe data for this Table can be accessed via https://stat.link/tcxh4.
Percentage of 25–34-year-olds with a given level of education as the highest level attained
Note: Data refer to ISCED 2011 for all countries, except Argentina and India, which use ISCED-97. Data for Argentina, India and Indonesia are from the International Labour Organization (ILO). Columns showing totals for men and women, and for vocational upper secondary or post-secondary non-tertiary attainment are available for consultation online.
1. Year of reference differs from 2025: 2024 for Brazil and Chile; 2023 for Iceland and Indonesia.
2. Year of reference differs from 2015: 2016 for Brazil.
3. A break in 2020 affects the continuity of the data for Switzerland. See Education at a Glance 2026: Sources, Methodologies and Technical Notes (https://doi.org/10.1787/dcf64a14-en)
The data for this Table can be accessed via https://stat.link/tcxh4
Percentage of 25-34 year olds with a given level of education as the highest level attained
Note: Data refer to ISCED 2011 for all countries, except Argentina and India, which use ISCED-97. Data for Argentina, India and Indonesia are from the International Labour Organization (ILO). Columns showing data for 55-64 year-olds are available for consultation online. Percentage of each age group with a given level of education as the highest level attained. The data for this Table can be accessed via https://stat.link/tcxh4 1. Year of reference differs from 2025: 2024 for Brazil and Chile; 2023 for Iceland and Indonesia.