Upper secondary education is the dominant pathway after lower secondary education. On average across countries with available data, 92% of students are enrolled in further education one year after completing lower secondary education. Of these, 88% are enrolled in upper secondary education, while the remainder are in other forms of further education.
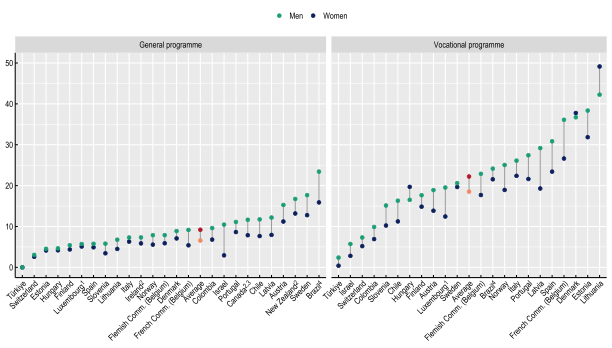
Men are more likely than women to leave upper secondary education without a qualification, particularly those in vocational programmes. Two years after the expected graduation date, average dropout rates in vocational education reach 22% for men and 18% for women, compared with 9% for men and 7% for women in general education.
Post-completion pathways are heavily shaped by institutional and cultural norms. 65% or more of upper secondary graduates in Austria, Finland and Sweden do not immediately enrol in further education, while the share is substantially higher in Denmark, at around 85%. Conversely, direct progression to a bachelor’s or master’s degree is relatively common in Estonia, the Flemish Community of Belgium, Italy and Lithuania, where around half to three-fifths of upper secondary graduates transition immediately into these programmes.
Education at a Glance 2026

Context
The transition from lower to upper secondary education is a critical junction that sets the stage for future educational success. Smooth transitions are essential for ensuring that students remain engaged and progress linearly toward graduation. A smooth transition into upper secondary education is characterised by students progressing on time, making informed educational choices aligned with their interests and abilities, and receiving the support needed to remain engaged and successfully complete their studies. Such transitions foster both educational success and students’ overall well-being (OECD, 2023[1]).
When students start their upper secondary education is often influenced by factors such as prior grade repetition, which directly contributes to delayed entry and a higher risk of non-completion later in the educational journey. Transition pathways are also shaped by system-level features. The distribution of students into general or vocational programmes reflects the degree of stratification within education systems and may influence access to subsequent educational opportunities. Similarly, some systems offer preparatory or bridging years to support academic readiness or transitions between programmes. Understanding how these structural features affect the timing and pathways of entry can help identify policies that promote on-time progression, persistence and successful completion.
Completing upper secondary education is an important milestone in students’ educational pathways and a key objective of education systems. It provides young people with the knowledge, skills and qualifications needed to participate fully in society, access further learning opportunities and make successful transitions into employment. As a result, upper secondary completion is widely regarded as a minimum benchmark for educational attainment in modern economies. Monitoring completion rates therefore provides valuable insights into the extent to which education systems support students in progressing successfully through education and attaining this essential qualification. However, improvements in completion rates do not necessarily translate into better learning outcomes. Recent results from the Programme for International Student Assessment (PISA) show that student performance has stagnated or declined in many OECD countries, highlighting the importance of considering both educational attainment and student achievement when assessing education system performance.
Behind overall completion rates, however, there can be substantial differences in outcomes across student groups. Factors such as delayed entry into upper secondary education, immigrant background, parental educational attainment and other socio-economic characteristics are associated with differences in students’ likelihood of completing their studies. In particular, entering upper secondary education after the theoretical starting age is often linked to lower completion rates, reflecting the cumulative effects of earlier educational challenges. These differences in outcomes can reveal persistent inequalities in educational opportunities and attainment, highlighting the need for policies that support students with diverse backgrounds and needs. Understanding such patterns requires high-quality longitudinal data that track students over time and combine information on educational pathways with students’ backgrounds and experiences. Such data can help identify critical transition points, support early intervention and inform more targeted and effective policy responses (Varsik, 2025[2]).
The transition from upper secondary education to further education, training or employment represents another key stage in young people’s educational and professional trajectories. Those completing upper secondary education do not follow a uniform path thereafter. They may continue into tertiary education, pursue additional vocational qualifications, enter the labour market or combine work and further study. The timing and direction of these transitions are shaped by a range of factors, including the structure of education systems, labour-market opportunities, tertiary admission requirements and broader social and cultural norms. As a result, post-completion pathways vary considerably across countries, reflecting different approaches to supporting young people’s progression into further learning and employment.
In per cent

1. Individuals in the "not enrolled" category include those who are enrolled in programmes other than general or vocational upper secondary education.
2. Year of reference differs from 2024.
3. Data only cover public institutions.
For data, see Table B3.1.The data for this figure can be accessed via https://stat.link/tva6w2.
Other findings
On average across participating countries, 85% of students who enter general upper secondary programmes are either at the theoretical age for entry or below it, compared to only 65% of those entering vocational programmes, reflecting structural factors such as prior grade repetition or the use of optional preparatory years before committing to a pathway.
Women are more likely than men to complete upper secondary education on time in nearly all systems, with 78% graduating within the expected time, compared to 72% of men. This gender gap is particularly pronounced in Norway, where the difference between men and women amounts to 15 percentage points.
Outcomes two years after the expected timeframe reveal notable differences in system efficiency, with total completion at 90% or more in Canada, Colombia, Ireland, Switzerland and Türkiye. By contrast, completion rates remain below 80% in Austria, Brazil and Denmark, suggesting over one-fifth of those starting upper secondary education will leave without the relevant qualification.
Entering upper secondary education after the theoretical age is a powerful predictor of non-completion, with late entrants graduating at significantly lower rates than their on-time peers. In Brazil, Italy, Latvia, Norway and Spain, the completion gap between on-time and delayed entrants is around 30 percentage points or more, highlighting the long-term impact of early academic delays.
Note
This chapter presents the results of data collected through an ad-hoc survey on upper secondary completion rates, which is planned to be conducted biennially. The survey aims to explore students' transition pathways by following entrants from the same cohort through national administrative registries or longitudinal surveys. As not all countries are able to provide such data, country coverage is lower than the full set of OECD countries. Moreover, coverage varies across analyses depending on the availability of data for the different breakdowns collected. The survey also gathered extensive qualitative information on policies and institutional practices, including admission arrangements, student support measures, pathways between education levels and labour-market links. These contextual data were used to strengthen the analysis by helping to explain cross-country differences and interpret the quantitative results.
The students included in this survey are those who were new entrants to an upper secondary programme and who were full-time national students at the time they entered the programme. Restricting it to first-time entrants to upper secondary education excludes adult education programmes and students enrolling in upper secondary education for a second time after their initial schooling. The year of reference (2024) corresponds to a period two years after the theoretical end of the programmes these students entered (N+2), 2023 to one year after the theoretical end (N+1) and 2022 to the theoretical end (N). The year of entry varies among countries, as it depends on the duration of the programme.
Entry into upper secondary education
Entry into upper secondary education is a critical stage in students’ educational trajectories, shaping subsequent learning opportunities, educational attainment and career prospects. Students who are able to transition smoothly into programmes that align with their interests, aspirations and abilities are more likely to remain engaged, achieve positive learning outcomes and successfully progress through the education system. Conversely, delayed progression, grade repetition and barriers to access can disrupt educational pathways and increase the risk of disengagement and early school leaving (OECD, 2023[3]). Ensuring equitable access to upper secondary education and supporting successful transitions are therefore essential for promoting student well-being, improving educational outcomes and facilitating successful labour-market integration.
Reducing early leaving from education and training is also a key priority at the European level. Under the European Education Area framework (2021-30), EU Member States committed to reducing the share of early leavers to below 9% by 2030. To support this objective, the European Commission monitors and promotes policies across several key areas such as early warning systems, anti-bullying measures, teacher training, targeted support for at-risk learners, multidisciplinary support teams and strengthened career guidance. Together, these measures aim to improve student well-being, engagement and successful completion of upper secondary education (European Commission / EACEA / Eurydice, 2023[4]).
An interactive online platform provides complementary contextual information on upper secondary education pathways. Through a series of interactive visualisations and country-level indicators, users can explore transitions into upper secondary education, the structure and characteristics of upper secondary programmes, completion requirements and outcomes, and students’ destinations after graduation. The platform combines qualitative information on programme duration, starting age, selection mechanisms, graduation criteria and transition pathways with quantitative indicators on participation, progression, completion and post-completion outcomes.
The platform can be accessed at the Dashboard on Upper Secondary Education Systems.
Transition from lower to upper secondary education
Across OECD countries and economies with available data, transition rates from lower secondary education to further education programmes remain high. On average, 92% of students enrol directly in some form of further education, without a break in their studies, after completing lower secondary education. Of these, 88% transition to upper secondary education, while the remaining 5% enrol in other forms of further education. However, overall transition rates vary considerably, ranging from 71% in Luxembourg to 99% in Israel. Among the 22 countries and economies with available data, 16 report overall transition rates of at least 90%, including 10 where rates exceed 95%. Similarly, transition rates specifically into upper secondary education are high in most systems, confirming that upper secondary education is the normative continuation of students’ educational pathways across OECD countries (Table B3.1).
In many countries, these high transition rates are supported by compulsory education policies extending into upper secondary education. Among the 22 countries and economies with available data, at least one year of upper secondary education falls within the scope of compulsory education in 14 systems. Although compulsory education ends before upper secondary education in Lithuania and Sweden, the full duration of upper secondary education is compulsory in Chile, Colombia, the Flemish and French communities of Belgium. Nevertheless, the relationship between compulsory education and transition rates is not always straightforward. For example, Sweden records a high transition rate of 97% despite upper secondary education not being compulsory, whereas the rate in Colombia is 84% even though all years of upper secondary education are compulsory. This suggests that factors beyond compulsory education policies, such as progression requirements, grade repetition and transition arrangements, also shape students’ progression into upper secondary education (Table B3.1).
Some countries continue to face challenges in ensuring a smooth progression into upper secondary education. Lower transition rates in Colombia (84%), the French Community of Belgium (87%), Latvia (88%) and Luxembourg (71%), reflect larger shares of students completing lower secondary education in these countries either repeating the final grade of lower secondary education or not being enrolled in formal education. Relatively high rates of students repeating lower secondary grades in Colombia (9%), the French Community of Belgium (11%) and Luxembourg (20%) contribute to delayed transitions into upper secondary education. In Luxembourg, lower transition rates are also linked to the relatively high share of those completing lower secondary education not being enrolled in any further education (9%), partly reflecting cross-border mobility, as some families leave the country or students continue their studies abroad and therefore cannot be tracked in the national education system (Table B3.1). In Latvia, lower transition rates may partly reflect examination requirements at the end of lower secondary education. To support smoother transitions, Latvia recently introduced a reform allowing students who fail one centralised examination to enter vocational education and training programmes while retaking the failed subject during their first year, reducing the need to repeat an entire school year (OECD, 2025[5]).
Although approximately half of students transition into general upper secondary programmes (54% on average), significant cross-country differences exist in the distribution of students across educational pathways. In Austria, Bulgaria, the Flemish Community of Belgium, Hungary, Poland and Slovenia, at least half of students enter vocational programmes immediately after lower secondary education. In contrast, in countries such as Chile and New Zealand, over 90% of students transition into general education, reflecting differences in how upper secondary education is structured (Table B3.1). In Chile, all students initially enrol in a general programme during the first two years of upper secondary education before selecting a specific pathway for the remaining two years leading to an upper secondary qualification (OECD, 2023[6]). New Zealand offers a common upper secondary pathway at entry, with no differentiation by programme orientation or school. Students can then combine elements of both general and vocational learning within their programmes of study, rather than following separate general and vocational pathways (OECD, 2023[7]).
In a few countries, a notable share of students completing lower secondary education enrol in programmes classified as “other programmes” rather than general or vocational upper secondary education. In Austria, where 14% of students enrol in other programmes, this mainly refers to the Polytechnische Schule, a one-year pre-vocational orientation programme that completes the ninth year of compulsory education and helps students prepare for further education or training pathways (OeAD, 2026[8]). Denmark also has a distinctive transition model, with 54% of students enrolling in other programmes, primarily the optional tenth grade. This additional year after compulsory lower secondary education allows students to strengthen their academic skills, explore career interests and gain greater maturity before choosing a formal upper secondary pathway. The programme is intended to support smoother transitions into both general and vocational upper secondary education through guidance and practical learning experiences (Field et al., 2012[9]). Similarly, in Sweden, 11% of students are enrolled in introductory programmes that support students who do not meet the eligibility requirements for national upper secondary programmes. While such programmes can help students strengthen foundational skills and prepare for further study, they may also create an additional transition step that can reduce the likelihood of progressing to and completing an upper secondary qualification (Eurydice, 2025[10]).
Mechanisms for assessing learning outcomes by the end of lower secondary education
Across surveyed education systems, student learning outcomes at the end of lower secondary education are widely assessed, although the methods and purposes of assessment vary considerably. Many countries combine external examinations with internal school-based assessments. For example, the Republic of Türkiye uses teacher assessments to identify students' learning needs, support teaching and learning, and determine school achievement scores, which are an important criterion for placement into upper secondary institutions that do not admit students through the central examination and a tie-break criterion for those that do. Latvia combines national examinations with passing grades to both certify completion of lower secondary education and determine eligibility for upper secondary entry. Countries such as Estonia, France and Poland rely more heavily on standardised examinations linked to certification or progression. In France, the Diplôme national du brevet combines written and oral examinations with continuous assessment, while Poland requires students to complete a written eighth-grader exam and Estonia uses national tests to determine graduation eligibility.
By contrast, Chile, Finland and Sweden place greater emphasis on teacher-led and school-based assessment practices. Finland does not have a national leaving examination at the end of lower secondary education, relying instead on teacher assessments guided by the national curriculum, while national evaluations are conducted only on a sample basis for system monitoring. Similarly, Chile tracks student achievement through school-based assessments and promotion records, and the national SIMCE (Sistema de Medición de la Calidad de la Educación) assessments are not linked to certification or progression. In Sweden, national tests are marked internally by teachers to support consistent evaluation against national goals.
Education systems use assessments at the end of lower secondary education for multiple purposes. Many countries and economies use the results to determine eligibility for entry into upper secondary education or placement into specific academic and vocational pathways, as is the case in Bulgaria, England (United Kingdom), Estonia, Hungary, Norway and Türkiye. In others, assessments primarily certify completion of lower secondary education, including in the French Community of Belgium, Italy and Poland.
At the same time, countries increasingly use assessment data to support system monitoring and improve teaching and learning, and in several systems, assessment systems are designed primarily for monitoring educational performance at the system level rather than determining individual student progression. Colombia’s Saber 9°, Germany’s IQB-Bildungstrend, New Zealand’s assessment arrangements and Spain’s external evaluations in Grades 6 and 10 are mainly used for statistical monitoring and policy development, without direct consequences for students’ certification or transition into upper secondary education. Korea, Spain (through its Grade 4 and 8 diagnostic evaluations) and Türkiye also use assessment results diagnostically to identify learning needs and adapt instruction. In addition, in Türkiye, findings obtained from national monitoring studies such as the Monitoring and Evaluation of Academic Skills Study (ABİDE) are used to monitor student achievement at the system level, identify areas for improvement in curricula and their implementation, and inform evidence-based education policies. By contrast, Brazil and Costa Rica report that they collect no systematic information on learning outcomes at this stage.
Academic requirements for entry to upper secondary education
The extent to which students are required to achieve a defined academic standard before entering upper secondary education can influence how smoothly they transition from lower secondary education. While achievement requirements may help ensure students are prepared for more advanced study, highly selective standards can create barriers to progression.
Across countries and economies, approaches in transition to upper secondary education vary considerably. Some systems require students to meet specific academic thresholds or obtain certification at the end of lower secondary education. For example, in Sweden, students must achieve passing grades in Swedish, English and mathematics, together with additional subjects (depending on whether they enter a vocational or general programme). Similarly, in Türkiye, students are required to successfully complete lower secondary education in order to progress to upper secondary education. In particular, students must achieve a minimum score of 70 out of 100 in Turkish and 50 out of 100 in other subjects. Students who do not meet these requirements are required to repeat the grade.
Other systems place greater emphasis on universal entitlement to continue education after compulsory schooling. In Norway, all students who complete lower secondary education are entitled to at least one upper secondary programme regardless of academic performance, while in Korea progression mainly depends on meeting attendance requirements in lower secondary education. France and the French Community of Belgium also follow a more automatic progression model linked to compulsory education structures.
Other countries adopt more a decentralised approach. In Canada, there are no national entrance examinations and admission criteria vary across provinces and school boards, while in Finland individual institutions may set their own grade thresholds or entrance examinations if demand exceeds available places.
Remedial pathways at entry to upper secondary education
Education systems use different mechanisms to support students who do not meet the entry requirements for upper secondary education. Nordic countries often rely on bridging programmes: in Finland, the one-year TUVA programme (Tutkintokoulutukseen valmentava koulutus - Preparatory education for upper secondary qualifications) supports students in improving grades and developing study skills needed for upper secondary education. Other systems focus on remedial support within compulsory education, such as Türkiye's Support and Remedial Courses (Destekleme ve yetiştirme kursları-DYK).
Some systems also offer alternative or vocational pathways for students struggling in mainstream education. In Hungary, programmes such as Dobbantó (Springboard) and Műhelyiskola (workshop school) provide more flexible learning environments for students who have fallen behind or face difficulties in traditional school settings. Similarly, Germany and Switzerland commonly use pre-vocational or pre-apprenticeship programmes to support students who are not yet ready to enter full upper secondary education.
In some systems, students’ academic performance determines the type of upper secondary programmes they can attend, rather than access to upper secondary education altogether. In countries like Israel, Luxembourg and Türkiye, for example, students who do not meet the highest academic thresholds may be excluded from selective academic pathways but are generally still guaranteed a place in non-selective general or vocational education programmes. Together, these approaches reflect efforts to maintain students’ participation in education while providing multiple pathways to support progression into upper secondary education.
Guidance and counselling strategies during transition
Countries employ a wide range of guidance and counselling approaches to support students’ transition into upper secondary education and manage the complexity of selecting the right educational pathway. In many systems, guidance is embedded into the curriculum and supported by national frameworks. Austria integrates career guidance into the lower secondary curriculum, while in Finland guidance counselling is a compulsory subject combining individual counselling, group activities and work-life orientation. Spain regulates guidance through national legislation, with school counselling departments providing personalised recommendations, and Korea designates dedicated career teachers who are responsible for students' careers. Türkiye also operates a structured guidance and psychological counselling system regulated by the Ministry of National Education. Poland requires students to take a minimum of 10 hours of mandatory career guidance classes in Grades 7 and 8.
Several countries complement counselling services with assessment tools and digital platforms (OECD, 2026[11]). In Spain, a formal competence assessment (consejo orientador) providing personalised recommendations about their future pathway is issued to every student in the 8th and the 10th school year, prior to decision on general or vocational pathways. Hungary uses national career orientation tools and examinations to assess students’ interests and skills, Türkiye offers digital career guidance inventories, and Finland provides online services to support education and career planning.
Parental and external involvement also play an important role. In Hungary, career guidance discussions are integrated into parent-teacher meetings, while Sweden frequently organises guidance meetings involving parents. Austria incorporates external actors such as the Public Employment Service, and parental engagement is also common in Denmark and France.
By contrast, some systems leave guidance largely to schools or do not provide measures specifically targeted at the transition from lower to upper secondary education. In the Flemish Community of Belgium, guidance is managed at school level, while in Canada approaches vary across provinces and territories. Ireland reports that, due to the absence of a formal distinction between lower and upper secondary education, specific transition measures are not applicable.
New entrants to upper secondary education by age
Delayed entry into upper secondary education serves as a critical indicator of how frequently students end up taking less linear paths through education. In most systems, the theoretical entry age is 15 or 16 years old but it ranges from 14 years in Chile, the Flemish Community of Belgium, Hungary and Italy to 17 years in Lithuania. On average across participating countries, 76% of students enter upper secondary programmes at or below the theoretical entry age. In some systems, many students start upper secondary education later than the theoretical age, often due to grade repetition during primary or lower secondary education. For instance, 60% of students in Colombia, 69% in the French Community of Belgium and 56% in Luxembourg enter upper secondary education at or below the theoretical entry age, and in these systems the share of students who end up repeating the last grade of lower secondary education ranges from 9% to 20%. In other systems, however, delayed entry is more of a structural feature designed to support student readiness and orientation than a consequence of academic difficulty. Denmark provides a notable example: only 39% of students enter upper secondary programmes at or below the theoretical entry age, largely because more than half of students (54%) enrol in another programme after lower secondary education, primarily the optional tenth grade (discussed above), which aims to strengthen academic foundations and clarify career choices before students commit to a formal upper secondary pathway (Table B3.1) and Table B3.5, available online).
Delayed entry rates are also related to the orientation of upper secondary programmes. On average across participating countries, 85% of students enter general upper secondary programmes at or below the theoretical age and in several countries, including Estonia, Italy, Lithuania, Norway, Slovenia and Sweden, the rate is over 95%. In contrast, the average is only 65% for vocational programmes. This disparity suggests that vocational pathways more often accommodate students with non-linear educational trajectories, whether due to prior grade repetition, delayed transitions or periods of disengagement from education (Table B3.5 and Figure B3.1a., available online).
The contrast between programme orientations is particularly pronounced in some systems. In Estonia, 98% of students enter general programmes on time compared to 69% of those starting vocational programmes. This reflects the fact that vocational pathways in Estonia tend to attract students with weaker prior academic achievement and a greater risk of delayed progression or non-completion (Musset et al., 2019[12]). Most of these delayed entrants are only one year over the theoretical age – just 6% of all Estonian entrants to upper secondary vocational programmes are two or more years older. There are also wide differences in Denmark, where 63% of students enter general programmes on time compared to only 10% in vocational programmes, partly reflecting the widespread use of preparatory or transitional routes before vocational entry. Vocational entrants in Denmark also tend to be substantially older than their peers in other countries, with 73% entering two or more years above the theoretical age (Table B3.5, available online).
Countries where on-time entry is both high and relatively consistent across programme orientations, such as Lithuania (99% in general and 88% in vocational education), Slovenia (96% and 89%) and Sweden (97% and 94%), may have more integrated transition mechanisms and lower levels of stratification between general and vocational pathways (Table B3.5, available online). These patterns are closely related to later completion outcomes.
Completion of upper secondary education
Requirements to complete upper secondary education
Completion requirements for upper secondary education vary significantly across countries, reflecting different priorities regarding academic achievement, accountability and access to higher education. In many systems, students gain their upper secondary qualification based on a combination of internal school-based assessment, external examination and attendance, although the emphasis placed on each component differs. A recent study of 71 upper secondary certificates across 38 systems identified that assessment most commonly combines external exams with internal school-based assessment certificates. Some certificates are entirely internally-assessed (19 certificates) and others rely only on external examinations (OECD, 2026[13]). For example, Austria combines a final thesis, standardised external examinations and oral school-based examinations within its “three-pillar” model (Government of Austria, 2025[14]). France also emphasises external assessment through the baccalauréat, where final examinations account for 60 percent of the final grade and continuous internal assessment contributes 40 percent (Government of France, 2025[15]). Bulgaria requires students to pass two compulsory State Matriculation Examinations (Eurydice, 2026[16]).
Other systems place greater emphasis on credit and course completion rather than high-stakes examinations. In Canada, students graduate by completing a required number of credits, with requirements differing across provinces and sometimes including provincial examinations. Japan follows a similar approach, requiring students to complete more than 74 units in most of the programmes for graduation. Attendance also forms an important component in some countries. Chile requires an attendance rate of at least 85%, while Korea mandates attendance for two-thirds of total school days. However, the absence of standardised examinations for upper secondary completion does not necessarily imply the absence of high-stakes examinations. In several systems, students may sit separate examinations for entry into higher education. For example, in Korea, admission to many tertiary programmes is strongly influenced by performance on the College Scholastic Ability Test (CSAT), a national university entrance examination.
Some countries distinguish between completing upper secondary and qualifying for higher levels of education through dual certification systems. This reflects a broader pattern observed across education systems: external setting and marking are more common where certificates and grades play an important role in selection for post-secondary destinations, while school-based assessment and marking are more prevalent where upper secondary certificates have a limited role in higher education admissions (OECD, 2026[13]). In Finland, students in general programmes receive both a school leaving certificate based on teacher assessment and a matriculation examination certificate used for higher education admission. Poland follows a comparable model, where students receive a school leaving certificate upon completing upper secondary education, while access to higher education requires completion of the nationally set Matura examination.
Vocational upper secondary education shares several features with general education but places greater emphasis on practical training and professional qualification. Mandatory work-based learning is common across vocational systems. Norway requires apprenticeships in most vocational programmes, while Estonia requires practical training to account for at least 35% of total study time. Several countries also require external professional certification or practical aptitude assessments, such as Austria’s externally administered apprenticeship examination and the Slovak Republic’s occupational skills assessments.
Some countries integrate academic and vocational requirements within the same framework. In Hungary, vocational students in the Technikum pathway must complete both the general Matura examination and a vocational skills assessment, while Sweden combines vocational and academic learning through mandatory work-based learning. Overall, vocational pathways tend to place greater emphasis on practical competence and labour-market preparation, although many countries increasingly combine academic and vocational elements.
On-time completion
Timely completion of upper secondary education is an important indicator of education system efficiency, as it reflects whether students progress through the system without grade repetition, prolonged disengagement, delayed transitions to further education or the labour market, or dropping out. Delayed completion is often associated with weaker school engagement and a higher risk of non-completion (Lyche, 2010[17]; Rumberger, 2011[18]). This is particularly important because leaving school without an upper secondary qualification is associated with poorer labour-market outcomes and poses a major challenge for education systems. Across OECD countries, the employment rate among 25-34 year-olds is 59% for those without upper secondary attainment, compared with 79% for those with upper secondary or post-secondary non-tertiary attainment (see Chapter A3). In addition, workers aged 25-64 year-olds without upper secondary qualifications earn, on average, 17% less than those who have completed upper secondary education (see Chapter A4).
Across countries with available data, on average, 75% of students who were expected to graduate in 2024 completed upper secondary education on time. Rates vary considerably, surpassing 85% in Colombia, Ireland, Israel and Türkiye, but falling below 60% in Austria, Denmark, the French Community of Belgium and Luxembourg (Table B3.2).
As discussed above, countries differ considerably in the design of their upper secondary certification systems and graduation requirements, including the extent to which they rely on external examinations, internal assessment, credit accumulation and work-based learning. These institutional arrangements can form part of the broader context in which students progress through upper secondary education. Students in systems where a larger share of students take external examinations tend to perform better in PISA mathematics, reading and science. However, these differences are no longer statistically significant after accounting for students’ and schools’ socio-economic background, suggesting that wider socio-economic and systemic factors play a more important role in shaping student outcomes than certification structures alone (OECD, 2026[13]). Systems with a stronger emphasis on external examinations also tend to report lower levels of growth mindsets (referring to students' belief that their abilities and intelligence can be developed through effort, learning, and persistence) among students, highlighting the importance of balancing standardised assessment with more diverse forms of evaluation that support broader learning behaviours and student development (OECD, 2026[13]).
A consistent cross-country pattern is the gender gap in on-time completion. In all countries with available data except Denmark, women are more likely than men to complete upper secondary education within the theoretical duration. On average across countries and economies, 78% of women complete on time compared with 72% of men. This gap is particularly pronounced in the French Community of Belgium, Italy and Norway, where women outperform men by more than 10 percentage points, while completion rates are nearly identical between genders in Finland, Ireland and Sweden (Table B3.2). Many factors can potentially contribute to these differences. Among others, boys tend to perform less strongly in reading, which can affect achievement across multiple subjects and could contribute to lower completion rates (OECD, 2023[19]).
However, not completing upper secondary education within the theoretical duration does not necessarily mean not completing at all, as many students complete their studies after an additional period of time. Consequently, gender gaps in completion rates tend to narrow when completion is measured several years after the expected completion date (see Chapter B3 in (OECD, 2023[20])).
Completion within and after the expected timeframe
The first year after the expected graduation date is the most important period for students who have not completed upper secondary education to catch up. On average across countries and economies with available data, completion rates increase by 6 percentage points between the end of the theoretical duration (N) and one year later (N+1), compared with only 3 percentage points between N+1 and N+2. In the French Community of Belgium, for example, completion rates increase by 17 percentage points between N and N+1, but by only 4 percentage points between N+1 and N+2. A similar pattern is observed in Denmark, where the corresponding increases are 15 and 3 percentage points. These suggests that, for most students who do not complete on time, one additional year is generally enough to meet the remaining graduation requirements (Table B3.3, and Figure B3.2).
However, cross-country differences in these patterns reflect variation in progression rules, opportunities for re-engagement and the flexibility of pathways. In several systems, completion rates do not change much in the year after the end of the theoretical duration, indicating relatively linear educational pathways in which student outcomes are largely determined once they have passed their expected graduation date. In Ireland and Lithuania, for instance, there is virtually no increase in completion rates between N and N+1(Table B3.3, and Figure B3.2).
In contrast, a second additional year remains important in some systems characterised by more flexible progression pathways or prolonged student participation. In Luxembourg, completion rates increase by a further 8 percentage points between N+1 and N+2, while Austria records an additional gain of 6 percentage points. These patterns may reflect systems where students remain enrolled for longer periods in order to meet graduation requirements. In Austria, for example, students must obtain a positive final report card before they are eligible to sit the Matura examination (Table B3.3, and Figure B3.2).
Cohort of students who were expected to complete upper secondary education in 2022 based on the theoretical duration of programmes, in per cent

1. Data are only available for 2022.
2. Data only include information related to new entrants to general upper secondary programmes.
3. Data for 2023 are missing.
4. Data only cover public institutions.
5. Year of reference differs from 2024.
For data, see Table B3.3. The data for this figure can be accessed via https://stat.link/tva6w2.
Completion after the expected timeframe by age
As suggested by the entry patterns discussed above, the age at which students enter upper secondary education is a strong predictor of eventual completion. On average across countries with available data, 88% of students who enter at or below the theoretical entry age complete upper secondary education by the end of the theoretical programme duration plus two years. Completion rates among these students exceed 95% in countries such as Colombia, Israel and Türkiye. By contrast, completion rates are substantially lower among students who enter one or more years late, averaging 66% across countries and economies with available data (Table B3.6, available online). While these differences may partly reflect pre-existing differences between students who experience delayed progression and those who do not, the pattern is consistent with evidence showing that students who have repeated a grade tend to exhibit weaker academic outcomes than non-repeaters (Ikeda and García, 2014[21]).
The size of this gap varies considerably across education systems. In Brazil, Italy, Latvia, Norway and Spain, the difference in completion rates between students entering on time and those entering late around 30 percentage points or more. Estonia and Lithuania also show gaps of around 40 percentage points, although results for late entrants should be interpreted cautiously in these countries, as they account for less than 10% of the cohort. In contrast, Switzerland shows a much smaller gap (around 10 percentage points), suggesting more flexible progression arrangements and stronger second-chance pathways (Table B3.6 and Figure B3.2a, available online). Box B3.2 examines two other factors related to students’ backgrounds that might lower their completion rates: parental educational attainment and immigration status.
Some systems have introduced targeted policies to support students with delayed educational trajectories. Brazil, for example, implemented Correção de Fluxo Escolar (school flow correction) programmes from the mid-1990s onwards to address widespread age-grade distortion (distorção idade-série) caused by grade repetition and interrupted schooling. These accelerated learning programmes enabled over-age students to complete multiple grades before re-entering age-appropriate cohorts. By the 2000s, nearly all Brazilian states had adopted some form of flow correction policy, with variants continuing in several state and municipal systems throughout the 2010s (Bruns, Evans and Luque, 2011[22]; Cenpec, 2026[23]).
National completion rates can mask substantial disparities across student groups. Parents’ educational attainment and immigrant status remain strongly associated with students’ likelihood of completing upper secondary education, even in systems with relatively high overall completion rates. Differences in family educational background, access to academic support, language proficiency and familiarity with education systems can all shape students’ progression and completion. Understanding these disparities is important for identifying groups at greater risk of non-completion and for designing targeted policy responses.
Completion rates by parents’ educational attainment
Parents’ educational attainment continues to be a strong determinant of success in upper secondary education. Across all countries with available data, students whose parents have completed tertiary education are significantly more likely to graduate within two years of the end of theoretical duration than those whose parents have below-tertiary attainment (Figure B3.3, Panel A).
Cohort of students who were expected to complete upper secondary education in 2022 based on the theoretical duration of programmes, in per cent

1. Only information on the attainment level of the mother is available in the Flemish Community of Belgium.
2. Completion rates for students with an immigrant background should be interpreted with caution, as they make up less than 10% of their cohort.
For data, see Table B3.6 (available online). The data for this figure can be accessed via https://stat.link/tva6w2.
The differences in completion rates between students whose parents lack tertiary attainment and those from tertiary-educated backgrounds are wider in Denmark and Norway (14 percentage points lower), and Finland (17 percentage points lower). In contrast, the gap is only 3 percentage points in Israel and 4 percentage points in Switzerland (Figure B3.3, Panel A). This suggests that these systems are more effective at decoupling student outcomes from family educational history. In Switzerland, the strong integration of vocational education and training with the labour market, including well-established apprenticeship pathways and close employer involvement, may support smoother transitions and completion among students from diverse socio-economic backgrounds (OECD, 2025[24]).
Completion rates by students’ immigrant background
Immigrant background represents another significant axis of inequity, with immigrant students facing substantial hurdles in graduating from upper secondary education in most countries with data available. In Denmark, Finland, Norway and Sweden, completion rates for immigrant students are at least 11 percentage points lower than for their non-immigrant peers. These disparities highlight the challenges of integrating students who may face language barriers or have entered the host country’s school system late in their educational trajectory. Israel stands as a notable exception to this trend, achieving parity with a 95% completion rate for both immigrant and non-immigrant students (Figure B3.3, Panel B).
Upper secondary systems in Nordic countries such as Denmark, Finland, Norway and Sweden are characterised by relatively differentiated pathways and substantial student choice about programme orientation and progression. The systems with greater flexibility and autonomy may place greater demands on students’ capacity to navigate educational transitions and make informed educational choices. In such contexts, family educational support and familiarity with the education system may play a particularly important role in shaping students’ educational trajectories (Perico E Santos, 2023[25]).
To address these inequities, countries have implemented various targeted measures. For instance, Finland uses preparatory programmes like TUVA to help students, including those with immigrant backgrounds, develop the language proficiency and study skills required for a full upper secondary qualification. Other systems focus on reducing the financial "pull-out" factors that disproportionately affect disadvantaged cohorts, such as Brazil’s use of conditional cash transfers and graduation bonuses specifically targeted at low-income students in public schools (see Box B3.3). The expansion of community-based support and educational mediators, as seen in Bulgaria and Latvia, also aims to bridge the gap between schools and marginalised families to ensure that students’ backgrounds do not predetermine educational completion. The Netherlands monitors early school leavers through Regional Contact and Coordination Offices (RMCs), and uses targeted language support to help immigrant students remain engaged in education. Alternative pathways also allow students who do not initially meet graduation requirements to complete their qualifications later.
Status of students at the end of theoretical duration plus two years
Considering where students are two years after the theoretical end of their upper secondary programme (N+2) provides a broader picture of how education systems balance completion, continued enrolment and dropping out. Total completion rates at N+2 reach or exceed 90% in Canada, Colombia, Ireland, Slovenia, Switzerland and Türkiye (Figure B3.4). However, these rates refer only to students who entered upper secondary education and should therefore be interpreted alongside participation rates. In some countries, high completion rates may partly reflect more selective entry into upper secondary education. For example, while Colombia records high completion rates among upper secondary entrants, the transition rate from lower secondary education to further education is 84%, indicating that not all young people continue into upper secondary education (Table B3.1.). By contrast, other systems face greater challenges in supporting students to complete once they have entered upper secondary education. Completion rates are below 80% in Austria, Brazil and Denmark, where larger shares of students are either still enrolled in education without graduating or have left education without completing (Figure B3.4).
The share of students who remain enrolled two years after they would be expected to graduate highlights systems where students continue their studies for longer periods before meeting graduation requirements. For instance, in Austria, Finland and Luxembourg, between 6% and 7% of the cohort remain in education at this point (Figure B3.4). In some systems, this may reflect demanding certification structures, while in others it may indicate more flexible progression pathways that allow students additional time to complete outstanding requirements, repeat academic years or change programmes during upper secondary education.
High dropout rates are particularly notable in Brazil (20%) and Denmark (21%) (Figure B3.4). These patterns may partly reflect the complexity of graduation requirements and the challenges students face in navigating multiple academic or vocational pathways. In Brazil, students must complete both the nationally defined core curriculum and a specialised itinerary, while also meeting attendance and performance requirements. Another factor to consider is that the group classified as neither graduated nor enrolled have not necessarily all dropped out. In some cases, students may have left the education system covered by the data but remain enrolled elsewhere. For example, in the Flemish Community of Belgium, students recorded as no longer enrolled in Flemish education may have subsequently enrolled in education programmes in the French Community. This group may also include students who completed upper secondary education but did not obtain a full qualification. This is the case in Sweden, where an upper secondary diploma is awarded only to students who pass certain compulsory subjects. Graduation is conditional on achieving passing grades in core subjects as well as meeting programme-specific requirements. Students who do not meet these requirements receive a study certificate, which corresponds to ISCED attainment levels 342 or 352, rather than an upper secondary qualification (OECD/Eurostat/UNESCO Institute for Statistics, 2015[26]).
Cohort of students who were expected to complete upper secondary education in 2022 based on the theoretical duration of programmes, in per cent

1. Year of reference differs from 2024.
2. Data only include information related to new entrants to general upper secondary programmes.
3. Data only cover public institutions.
4. Not graduated and not enrolled category includes students who are still in education.
For data, see Table B3.3. The data for this figure can be accessed via https://stat.link/tva6w2.
Dropout rates by gender and programme orientation
Gender differences remain a persistent feature of educational disengagement, with men more likely than women to leave upper secondary education without a qualification. On average across countries with available data, 14% of men have left upper secondary education without a qualification by the end of the theoretical duration plus two years (N+2), compared with 10% of women. The gender gap is particularly pronounced in Estonia (9 percentage points), Latvia (8 percentage points) and Italy (7 percentage points) (Table B3.7, available online).
More men than women drop out of upper secondary education regardless of programme orientation, but the gap is wider in vocational pathways, suggesting that gendered patterns of disengagement are amplified within vocational education. At N+2, the average drop out rate in vocational education is 22% for men and 18% for women, compared with 9% and 7% in general education. In the French Community of Belgium and Latvia, dropout rates for men in vocational programmes are at least 9 percentage points higher than for their female peers. There are also wide gaps in vocational pathways in Estonia, Luxembourg, Norway and Spain (Figure B3.5).
A few countries display more limited gender differences within vocational education, or even a reversal of the gender gap. In Denmark, Hungary and Lithuania, drop out rates among women in vocational programmes exceed those among men. In Lithuania, almost half of women enrolled in vocational upper secondary programmes leave education without completing, compared with 42% of men (Figure B3.5). However, these figures should be interpreted with caution due to the relatively small number of women enrolled in vocational programmes. Lithuania has recently introduced reforms aimed at strengthening the attractiveness of vocational education through improved career guidance, clearer progression pathways and stronger links to employment and tertiary education. Reforms to the Matura examination also seek to introduce more flexible and competency-based assessment approaches that better reflect vocational learners’ skills and learning pathways (OECD, 2023[27]).
The considerably higher dropout rates – for both genders – in vocational education compared to general programmes partly reflect differences in student composition, as such programmes often enrol a higher share of students with weaker prior academic performance, previous grade repetition, lower socio-economic backgrounds or weaker attachment to school, all of which are associated with a greater risk of dropping out (OECD, 2023[20]). In contrast, systems with strong and well-integrated vocational education and training structures, such as Switzerland, maintain comparatively low dropout rates across both programme orientations (Figure B3.5). Vocational education and training can play an important role in supporting overall completion by providing a broader range of learning pathways that accommodate diverse students’ interests, needs and aspirations.
Cohort of students who were expected to complete upper secondary education in 2022 based on the theoretical duration of programmes, in per cent
1. Data only cover public institutions.
2. Data only include information related to new entrants to general upper secondary programmes.
3. Dropouts include students who are still in education.
4. Year of reference differs from 2024.
For data, see Table B3.7 (available online). The data for this figure can be accessed via https://stat.link/tva6w2.
Gender differences in dropout rates for general education are also apparent in several countries. Brazil records the highest dropout rate among men in general upper secondary education, at 23%, and, alongside Israel, has the largest gender gaps within this orientation, at 8 percentage points. In several systems, including Austria and Norway, gender gaps are evident across both general and vocational pathways, suggesting that differences in persistence and engagement are not confined to a single programme orientation but reflect broader structural or behavioural patterns across upper secondary education (Figure B3.5).
Dropping out is rarely the result of a single event, but rather the outcome of a cumulative process of disengagement (Rumberger, 2011[18]; Varsik, 2025[2]). Students leave education for a combination of personal, school-related and system-level reasons that often reinforce one another. Poor academic performance, absenteeism and low motivation are common risk factors, frequently linked to socio-economic background and earlier educational experiences. School environments and practices can also contribute to disengagement, particularly when students feel unsupported. At the system level, policies such as grade repetition or limited vocational opportunities may further increase students’ risks of dropping out (Lyche, 2010[17]; Varsik, 2025[2]). As a result, effective prevention strategies need to address both immediate warning signs and the broader conditions that gradually push students out of education.
Mechanisms to reduce dropout rates and improve retention
Countries are adopting comprehensive strategies to reduce dropout rates in upper secondary education, combining legal obligations, targeted funding, early identification of at-risk students, financial support and flexible learning pathways. One common policy approach is the extension of compulsory participation in education or training. In France, training became mandatory for 16–18-year-olds in 2020 and can be fulfilled through schooling, apprenticeships, civic service or employment-oriented training pathways. Austria and Italy similarly require participation in education or training until the age of 18, while Finland extended compulsory education to age 18 in 2021 with the aim of strengthening equity and improving attainment levels. England also requires young people to remain in education, training or work-based learning until their 18th birthday (OECD, 2024[28]).
A second group of measures focuses on personalised and targeted support for students and schools at greater risk of disengagement. France’s REP (Réseau d'Éducation Prioritaire ("Priority Education Network")) and REP+ (Réseau d'Éducation Prioritaire Renforcé ("Enhanced/Reinforced Priority Education Network")) networks, Spain’s PROA+ (Programa para la Orientación, Avance y Enriquecimiento Educativo ("Programme for Educational Guidance, Progress and Enrichment")) programme and Ireland’s DEIS (Delivering Equality of Opportunity in Schools) initiative provide additional resources to schools serving disadvantaged communities, with a focus on mentoring, pedagogical support and family engagement. Several countries have also introduced individualised guidance systems. Sweden assigns a mentor to each student to monitor attendance and academic progress, Austria operates a dedicated youth coaching programme for students at risk of dropping out, and Bulgaria employs educational mediators to strengthen links between schools and families.
Early warning systems have also become a central element of retention strategies. These systems use attendance, behavioural and academic indicators and artificial intelligence (AI) tools to identify students at risk of dropping out and enable earlier intervention. Chile’s SAT (Sistema de Alerta Temprana (“Early Warning System”)) combines attendance, socio-economic and performance data. In the United States, most districts use early warning systems of some kind, some of which are AI-based (OECD, 2023[29]). Hungary operates a mandatory early school-leaving warning system. In Türkiye, students' attendance, academic performance and dropout risk are regularly monitored, while school-based Prevention, Intervention and Guidance Commissions identify at-risk students and provide targeted support. Following a 2016 reform, vocational training centres were incorporated into compulsory education, enabling students who leave upper secondary education to continue their studies through these centres or open education high schools and complete an upper secondary diploma. The Flemish Community of Belgium requires schools to intervene after repeated unjustified absences. Several systems increasingly incorporate digital monitoring tools and predictive models, including Finland’s AI-HOKS (Artificial Intelligence–supported Personal Competence Development Plan) pilot for vocational education and training (VET) students and New Zealand’s predictive models for identifying youth at risk of becoming neither employed nor in education or training (NEET).
Financial support mechanisms are also widely used to reduce the economic pressures associated with school participation and completion. Spain offers scholarships and grants to support retention, while Bulgaria, Hungary and Türkiye provide transport support, free textbooks or scholarships. Korea combines free upper secondary education with additional benefits for students from financially vulnerable backgrounds.
Several countries have also introduced more flexible and modular pathways to address high dropout rates in vocational education. Spain’s 2022 VET reform expanded modular learning and strengthened “Basic VET” as an alternative pathway for students at risk of dropping out, allowing easier re-entry and movement across programmes. Estonia introduced preparatory studies for students who do not meet lower secondary thresholds and extended the obligation to learn until age 18. Italy developed regional vocational training pathways offering more practice-oriented alternatives to traditional academic pathways. These approaches seek to prevent temporary disengagement from becoming permanent non-completion by providing students with more flexible routes to qualification. Box B3.3 looks at improvements in completion rates among some countries and economies over the past 15 years.
Upper secondary completion rates two years after the end of the theoretical duration (N+2) have improved across many countries with available data over time, reflecting efforts to strengthen retention, reduce dropout rates and support progression through upper secondary education (Figure B3.6).
Cohorts of students who were expected to complete upper secondary education in 2008 and 2022 based on the theoretical duration of programmes, in per cent

1. Year of reference differs from 2010.
2. Year of reference differs from 2024.
3. Data only include information related to new entrants to general upper secondary programmes.
For data, see Table B3.3 and Table B3.8 (available online).. The data for this figure can be accessed via https://stat.link/tva6w2.
Several countries have recorded particularly large increases in completion rates over the past 15 years, although the reference year for the earlier observation differs across countries. Lithuania recorded the largest improvement, with completion rates at the end of theoretical duration rising from 64% to 87%. Substantial gains were also observed in Brazil, where completion rates increased from 65% to 79%, and in Chile, where they rose from 74% to 88%. Latvia and Norway also recorded increases of around 9 percentage points over the period (Figure B3.6).
Countries and economies with already comparatively high completion rates in earlier years generally experienced smaller changes over time. In Slovenia, completion rates remained consistently high, suggesting that stable upper secondary structures and a well-integrated vocational education and training system already supported strong retention outcomes. Similarly, completion rates remained high and relatively stable in Colombia, the Flemish Community of Belgium and Sweden (Figure B3.6).
Denmark often appears as an outlier in comparative analyses of upper secondary completion, particularly with regard to vocational education (Figure B3.6). Interpreting these results requires an understanding of the structure and recent reforms of the Danish VET system. A major reform introduced in 2014 aimed to make vocational education more attractive and better adapted to younger students by simplifying programme structures, strengthening academic requirements and creating a clearer and more coherent youth education environment. However, the reform also introduced higher entry requirements and more demanding progression expectations, which may have contributed to lower completion rates among some student groups in the years immediately following implementation. In addition, transitional effects associated with programme restructuring and changes in student composition may have influenced completion patterns. As a result, declining completion rates observed in the figure should not necessarily be interpreted as evidence of declining system performance, but rather in the context of substantial changes to the design and expectations of the VET system.
Differences between programme orientations remain a persistent feature across countries over time. In most systems, general education recorded larger improvements in completion rates than vocational education. Lithuania experienced one of the largest increases in general education, rising from around 48% to over 77% over a period of nearly 15 years. Brazil, Chile and Sweden also recorded increases of at least 11 percentage points in general programmes. By contrast, only Brazil, Latvia and Norway recorded increases of more than 1 percentage point in vocational completion rates, while several other countries experienced declines. In Sweden, for example, vocational completion rates fell by 11 percentage points over the period (Table B3.3 and Table B3.8, available online). These findings underline the importance of sustained policy efforts aimed not only at increasing access to upper secondary education, but also at strengthening progression, retention and successful completion, particularly within vocational pathways.
Some of these developments may reflect broader structural reforms in upper secondary education, and interpreting these trends therefore requires consideration of wider policy and system-level developments. In Latvia and Lithuania, reforms aimed at modernising vocational education and strengthening links between vocational and general pathways may have contributed to improved completion outcomes. In Brazil, improvements in completion coincide with policies combining financial incentives with curricular reform. Bolsa Família links financial support to school attendance, while the Pé-de-Meia programme provides payments and graduation bonuses for low-income upper secondary students. In parallel, the New Upper Secondary Education framework introduced more flexible learning pathways and elective components aimed at increasing student engagement and retention. Chile strengthened retention through attendance monitoring, early warning initiatives and targeted support for vulnerable students, alongside reforms designed to improve progression within upper secondary education. Together, these examples illustrate how countries have combined financial support, curricular flexibility and targeted interventions to address long-standing patterns of educational disengagement and improve upper secondary completion rates over time. These improvements likely reflect a combination of policy efforts, broader economic growth and changes in labour market demand that have increased the value of upper secondary qualifications and strengthened incentives for young people to remain in education.
However, higher completion rates do not necessarily reflect improvements in student learning. Although rising completion rates may reflect stronger student support, engagement and progression through the education system, they may also be influenced by changes in assessment, certification or progression requirements. This distinction is important, as recent PISA results show that learning outcomes have stagnated or declined in many OECD countries, highlighting that gains in educational attainment are not always accompanied by improvements in students’ learning outcomes (OECD, 2023[19]).
Post-completion pathways
The transition from upper secondary education to further education, training or employment is influenced by a combination of education system structures, national requirements, labour-market demands and cultural norms. Students' post-secondary trajectories are shaped not only by their qualifications but also by wider social and institutional arrangements, including compulsory military or civic service, gap-year practices, labour-market dynamics and formal transition mechanisms. These factors may either accelerate or delay progression into higher education and employment, contributing to cross-national variation in transition pathways.
Transition patterns across levels of education
Patterns in where students go after graduating from upper secondary education vary considerably across countries and reflect differences in education system design and progression opportunities. One year after graduation, around 9% of upper secondary graduates across participating countries have re-entered either general or vocational upper secondary education. In the Flemish Community of Belgium and Slovenia, close to 20% of upper secondary graduates enrol in vocational upper secondary programmes. This reflects systems in which vocational pathways are organised as multi-stage routes, allowing students to acquire additional qualifications or strengthen their prospects for tertiary education (OECD, 2023[30]; OECD, 2023[31]). Conversely, in New Zealand, around 85% of upper secondary graduates who remain in education enrol in a general upper secondary programme (Table B3.4). This pattern reflects the structure of the National Certificate of Educational Achievement (NCEA), where Level 2 is generally considered sufficient for upper secondary completion, but Level 3 is frequently pursued to meet university entrance requirements and expand tertiary education opportunities (OECD, 2023[7]).
Another transition pathway is enrolment in post-secondary non-tertiary and short-cycle tertiary programmes. On average, 13% of upper secondary graduates are in one of these programmes one year after graduation. The role of post-secondary non-tertiary and short-cycle tertiary education in graduate transitions varies considerably across countries; they are well established in some systems but play only a limited role in others. This transition is particularly common in Austria, France, Hungary and Spain, where at least one-quarter of upper secondary graduates follow these pathways (Table B3.4). In Austria and Hungary, post-secondary vocational programmes provide specialised professional qualifications closely aligned with labour-market needs. In France, programmes such as the Brevet de technicien supérieur (BTS) and the Bachelor universitaire de technologie (BUT) attract many upper secondary graduates from technological and vocational pathways by combining vocational preparation with opportunities for further tertiary progression. Similarly, Spain's higher VET programmes (Formación Profesional de Grado Superior) offer a strong labour-market orientation while also facilitating access to tertiary education. These examples illustrate how countries with strong VET traditions use post-secondary non-tertiary and short-cycle tertiary education as flexible pathways linking upper secondary education, employment and further study.
In per cent

1. Not enrolled category includes students enrolled in general or vocational upper secondary programmes.
2. Students enrolled in post-secondary non-tertiary or short-cycle tertiary education exclude those enrolled in bachelor's or master's degree programmes.
3. Data only include the graduates from general upper secondary programmes.
For data, see Table B3.4. The data for this figure can be accessed via https://stat.link/tva6w2.
Direct progression to bachelor's and master's programmes is the most common transition pathway. Across participating countries, 35% of upper secondary graduates enrol in these programmes in the year after completion. This pattern is particularly prominent in Estonia, the Flemish Community of Belgium, Italy and Lithuania, where more than half of upper secondary graduates continue directly into these programmes. In these systems, tertiary education is closely integrated with upper secondary completion, making direct progression the dominant route for many students (Table B3.4).
Gender differences are evident across transition pathways. On average across participating countries, 39% of women who completed upper secondary education enrol in bachelor's or master's programmes within one year of graduation, compared with 31% of men. This pattern is observed in all participating countries and is particularly pronounced in Austria, Canada, France and Lithuania, where the gender gap in tertiary enrolment exceeds 12 percentage points. Gender differences are less marked in other educational pathways. Men are slightly more likely to enrol in vocational upper secondary programmes and in post-secondary non-tertiary or short-cycle tertiary education. These patterns are especially pronounced in countries with strong vocational progression routes, such as Slovenia for vocational upper secondary education and France for post-secondary non-tertiary and short-cycle tertiary programmes, where the gender gap is around 10 percentage points (Figure B3.7).
Non-enrolment and delayed transitions and their institutional drivers
A substantial share of students leave formal education shortly after graduating from upper secondary education. On average across participating countries, 42% of upper secondary graduates are not enrolled in any formal education one year later. This pattern is particularly common in Austria, Denmark, Finland, Norway and Sweden, where the share is more than 60%. Men are more likely than women to follow this pathway (45% compared to 39% on average), with the largest gender gaps observed in Austria, Norway and Switzerland (Table B3.4).
However, non-enrolment should not be interpreted as disengagement from education, training or work. Several institutional and cultural factors explain why some upper secondary graduates have not taken up further formal education or have postponed enrolment. Direct entry into the labour market remains a central transition pathway. Data from Norway and Sweden show most graduates who are no longer enrolled are employed: 90% in Norway and 79% in Sweden, with only a small share outside the labour force (Table B3.4, relevant data available online). A direct transition to employment is especially common among graduates from vocational programmes and reflects the labour-market orientation of many VET systems. In Hungary, for example, direct employment is the expected outcome for graduates of vocational schools (szakképző iskola), whereas graduates of technical schools (technikum) are more likely to use their qualifications as a pathway to tertiary education. These examples illustrate that, in many systems, leaving formal education after upper secondary completion is part of a planned transition into work rather than an indication of inactivity.
To support transitions and widen educational opportunities, several countries have developed bridging mechanisms that facilitate progression into tertiary education. In Chile, for instance, private preparatory institutions (preuniversitarios) play a significant role in helping students prepare for the national higher education admission examination (PAES). These institutions operate outside the formal education system but are widely used by students seeking entry into competitive tertiary programmes.
Mandatory military or civic service is another factor that can delay progression to further education. In Austria, military service is compulsory for male citizens and typically takes place around the age of 18 or 19, often postponing entry into tertiary education. Similar patterns are observed in Switzerland, where military service must be completed between the ages of 19 and 25 and many students choose to fulfil this obligation before beginning tertiary studies. Military or civic service also remains a common transitional experience in Finland and Denmark. Since these obligations primarily apply to men, they may contribute to the higher shares of men who are not enrolled in education immediately after completing upper secondary education. In Korea and Türkiye, in contrast, while military service is compulsory for male citizens, there is no requirement to enlist immediately after completing upper secondary education; the majority of male students fulfil their military obligation before or after graduating from tertiary education. As a result, military service should not be regarded as a factor delaying initial entry into tertiary education, although it can affect the timing of graduation and subsequent entry into the labour market.
The impact of military service on educational transitions varies across countries, however. In Chile, military service is compulsory through a lottery-based mechanism when voluntary recruitment targets are not met, but students enrolled in tertiary education may defer or be exempted from service. Sweden follows a different approach, operating a selective model of conscription in which only around 10% of young people are called to serve. As a result, military service has a more limited influence on overall transition patterns.
Gap-year practices and tertiary admission systems also influence transition timelines. Taking a gap year is common in Denmark, Estonia, Germany and Sweden, where young people often use this period for employment, travel, voluntary activities or career exploration before committing to further study. In Denmark, taking one or more gap years after upper secondary general education is common practice. These practices can contribute to higher levels of non-enrolment immediately after upper secondary education, even among students who intend to pursue tertiary education at a later stage.
In Finland, delayed entry into tertiary education is closely linked to the competitive nature of higher education admissions. Enrolment caps (numerus clausus) apply across all higher education fields, and many students do not gain admission on their first attempt. As a result, students frequently postpone entry, attend preparatory courses or apply repeatedly before securing a place. Gap years are also observed in Switzerland, particularly among graduates from general education pathways, although they are not actively encouraged. In England (United Kingdom) and New Zealand, by contrast, gap years remain less common than direct progression into education or employment.
Dropout rates refer to the share of students who leave the specified level of education without graduating from a first qualification at the level.
External examinations: External examination refers to the exams that are set, marked, or regulated by an external authority such as a ministry of education, a national examination board, or a regional education authority, outside the student’s own school staff/management.
Programme orientation can refer either to the programme in which the student originally entered upper secondary education or to the programme from which the student graduated. Both types of analysis are included in the chapter. Data include only programmes sufficient for level completion. Two programme orientations are considered in the analysis:
general programmes (ISCED-P 343 and 344)
vocational programmes (ISCED-P 353 and 354).
The reference year for the survey is 2024 and it refers to two years after the end of the theoretical duration of the programmes analysed. For example, if a programme has a duration of two years, the cohort reported must have entered upper secondary education in the academic year 2020/21. Their status is then recorded by the end of the theoretical duration of the programme (academic year 2021/22) and two years later (academic year 2023/24).
The share of students who are still in education corresponds to those still pursuing the original qualification or that have transferred to another programme but have not yet completed it.
School-based assessments are designed and implemented by teachers to monitor, support, and evaluate student learning within the classroom.
The theoretical duration of studies is the regulatory or common-practice time it takes a full-time student to complete a level of education. Completion is measured within three timeframes: by the end of the theoretical duration (N = 2022), by the end of the theoretical duration plus one year (N+1 = 2023) and by the end of the theoretical duration plus two years (N+2 = 2024). The theoretical duration always refers to the programme in which the student originally entered upper secondary education. This means that even if a student transfers to a different programme with a different duration they will still be registered according to the programme in which they originally entered the level. Please see, Education at a Glance 2026 Sources, Methodologies and Technical Notes (https://doi.org/10.1787/dcf64a14-en), for information on each country’s theoretical duration for general and vocational upper secondary programmes.
The transition rate from lower to upper secondary education is calculated as the number of students enrolled in upper secondary or other educational programmes one year after enrolling in the final grade of lower secondary education, divided by the total number of students enrolled in the final grade of lower secondary education.
The completion rate is calculated as the number of graduates divided by the number of entrants, measured at the end of the programme's theoretical duration (N), one year later (N+1) and two years later (N+2). In this analysis, N refers to 2022.
For countries that submit longitudinal data it is also possible to calculate the share of students still in education and the share of students who have neither graduated nor are still enrolled – both of which are calculated for the timeframes of N and N+2. Both shares are calculated by dividing the number of students in the given situation or timeframe (N, N+1 or N+2) by the number of new entrants at the start of the programme.
For countries and economies that submitted transition data one year after graduation, the share of enrolled students for each ISCED level and the share of graduates who are not enrolled were calculated by dividing the number of individuals in the given category by total number of graduates one year before.
For more information see the OECD Handbook for Internationally Comparative Education Statistics (OECD, 2018[32]) and Education at a Glance 2026 Sources, Methodologies and Technical Notes (https://doi.org/10.1787/dcf64a14-en)
Data on completion rates refer to the academic year 2023/24 and were collected through a special survey undertaken in 2025. Data for some countries may have a different reference year. For more information see Education at a Glance 2026 Sources, Methodologies and Technical Notes (https://doi.org/10.1787/dcf64a14-en)..
References
[22] Bruns, B., D. Evans and J. Luque (2011), Achieving World-Class Education in Brazil: The Next Agenda, Directions in Development, World Bank, Washington, DC, https://doi.org/10.1596/978-0-8213-8854-9.
[23] Cenpec (2026), Correção de Fluxo Escolar (School Flow Correction), https://www.cenpec.org.br/projeto/correcao-de-fluxo-escolar/ (accessed on 1 June 2026).
[4] European Commission / EACEA / Eurydice (2023), Structural Indicators for Monitoring Education and Training Systems in Europe – 2023: Early Leaving from Education and Training. Eurydice report., Publications Office of the European Union, Luxembourg, https://doi.org/10.2797/06916 (accessed on 1 June 2026).
[16] Eurydice (2026), Assessment in general upper secondary education: Bulgaria, https://eurydice.eacea.ec.europa.eu/eurypedia/bulgaria/assessment-general-upper-secondary-education.
[10] Eurydice (2025), Education and Training in Sweden, https://national-policies.eacea.ec.europa.eu/youthwiki/chapters/sweden/61-general-context (accessed on 9 June 2026).
[9] Field, S. et al. (2012), A Skills beyond School Review of Denmark, OECD Reviews of Vocational Education and Training, OECD Publishing, Paris, https://doi.org/10.1787/9789264173668-en.
[14] Government of Austria (2025), Die Zentralmatura (Centralised Matura), Federal Ministry of Education, Science and Research, https://www.bmb.gv.at/Themen/schule/schulpraxis/zentralmatura.html.
[15] Government of France (2025), Le baccalauréat général, Ministry of National Education, Higher Education and Research, https://www.education.gouv.fr/reussir-au-lycee/le-baccalaureat-general-10457.
[21] Ikeda, M. and E. García (2014), “Grade repetition: A comparative study of academic and non-academic consequences”, OECD Economic Studies, Vol. 2013/1, pp. 269-315, https://doi.org/10.1787/eco_studies-2013-5k3w65mx3hnx.
[17] Lyche, C. (2010), “Taking on the completion challenge: A literature review on policies to prevent dropout and early school leaving”, OECD Education Working Papers, No. 53, OECD Publishing, Paris, https://doi.org/10.1787/5km4m2t59cmr-en.
[12] Musset, P. et al. (2019), Vocational Education and Training in Estonia, OECD Reviews of Vocational Education and Training, OECD Publishing, Paris, https://doi.org/10.1787/g2g9fac9-en.
[8] OeAD (2026), School Upper Secondary, Pre-Vocational School, PVS(Politechnische Schule), Austria’s Agency for Education and Internationalisation, https://bildungssystem.oead.at/en/school-upper-secondary/translate-to-english-polytechnische-schule (accessed on 1 June 2026).
[11] OECD (2026), Observatory on Digital technologies in Career guidance for Youth (ODiCY), https://www.oecd.org/en/toolkits/odicy.html?orderBy=mostRelevant&page=0 (accessed on 9 June 2026).
[13] OECD (2026), The Theory and Practice of Upper Secondary Certification, OECD Publishing, Paris, https://doi.org/10.1787/b3fea5ba-en.
[5] OECD (2025), Education at a Glance 2025: Latvia, OECD Publishing, Paris, https://www.oecd.org/en/publications/education-at-a-glance-2025_1a3543e2-en/latvia_cf017b16-en.html (accessed on 1 June 2026).
[24] OECD (2025), Vocational Education and Training Systems in Nine Countries, OECD Reviews of Vocational Education and Training, OECD Publishing, Paris, https://doi.org/10.1787/1a86eb6c-en.
[28] OECD (2024), Education at a Glance 2024: OECD Indicators, OECD Publishing, Paris, https://doi.org/10.1787/c00cad36-en.
[6] OECD (2023), Chile, OECD Education GPS, https://gpseducation.oecd.org/Content/MapOfEducationSystem/CHL/CHL_2011_EN.pdf (accessed on 1 June 2026).
[20] OECD (2023), Education at a Glance 2023: OECD Indicators, OECD Publishing, Paris, https://doi.org/10.1787/e13bef63-en.
[30] OECD (2023), Flemish Region (Belgium), OECD Education GPS, https://gpseducation.oecd.org/Content/MapOfEducationSystem/BFL/BFL_2011_EN.pdf (accessed on 1 June 2026).
[7] OECD (2023), New Zealand, OECD Education GPS, https://gpseducation.oecd.org/Content/MapOfEducationSystem/NZL/NZL_2011_EN.pdf (accessed on 1 June 2026).
[29] OECD (2023), OECD Digital Education Outlook 2023: Towards an Effective Digital Education Ecosystem, OECD Publishing, Paris, https://doi.org/10.1787/c74f03de-en.
[19] OECD (2023), PISA 2022 Results (Volume I): The State of Learning and Equity in Education, PISA, OECD Publishing, Paris, https://doi.org/10.1787/53f23881-en.
[3] OECD (2023), Policy pointers for equitable, effective and personalised upper secondary transitions, OECD Publishing, Paris, https://doi.org/10.1787/ac6c2095-en (accessed on 1 June 2026).
[1] OECD (2023), “Policy pointers for equitable, effective and personalised upper secondary transitions”, OECD Education Spotlights, No. 7, OECD Publishing, Paris, https://doi.org/10.1787/ac6c2095-en.
[31] OECD (2023), Slovenia, OECD Education GPS, https://gpseducation.oecd.org/Content/MapOfEducationSystem/SVN/SVN_2011_EN.pdf (accessed on 1 June 2026).
[27] OECD (2023), Strengthening Upper Secondary Education in Lithuania, OECD Publishing, Paris, https://doi.org/10.1787/a69409d7-en.
[32] OECD (2018), OECD Handbook for Internationally Comparative Education Statistics: Concepts, Standards, Definitions and Classifications, OECD Publishing, Paris, https://doi.org/10.1787/9789264304444-en.
[26] OECD/Eurostat/UNESCO Institute for Statistics (2015), ISCED 2011 Operational Manual: Guidelines for Classifying National Education Programmes and Related Qualifications, OECD Publishing, Paris, https://doi.org/10.1787/9789264228368-en.
[25] Perico E Santos, A. (2023), “Managing student transitions into upper secondary pathways”, OECD Education Working Papers, No. 289, OECD Publishing, Paris, https://doi.org/10.1787/663d6f7b-en.
[18] Rumberger, R. (2011), Dropping Out: Why Students Drop Out of High School and What Can Be Done About it, Harvard University Press.
[2] Varsik, S. (2025), “Transitions through education and into the labour market: Exploring educational outcomes and equity gaps using international surveys”, OECD Education Working Papers, No. 324, OECD Publishing, Paris, https://doi.org/10.1787/18be3c52-en.
The data for the figures and tables in this chapter can be downloaded via https://stat.link/tva6w2
To access further data and/or other education indicators, please visit the OECD Data Explorer: http://data-explorer.oecd.org/s/4s
Data cut-off for the print publication 17 June 2026. Please note that the Data Explorer contains the most recent data.
1. Ending age of compulsory education varies between 16 and 18 across provinces.
2. Data only cover public institutions.
3. Year of reference differ from 2024: 2023 for Brazil.
The data for this figure can be accessed via https://stat.link/tva6w2.
Cohort of students who were expected to complete upper secondary education in 2024 based on the theoretical duration of programmes
1. Data only include information related to new entrants to vocational upper secondary programmes.
2. Data only include information related to new entrants to general upper secondary programmes.
3. Data only cover public institutions.
4. Year of reference differ from 2024: 2023 for Brazil.
The data for this figure can be accessed via https://stat.link/tva6w2.
Cohort of students who were expected to complete upper secondary education in 2022 based on the theoretical duration of programmes
Note: The students included in this survey are those who were new entrants to an upper secondary programme and who were full-time national students at the time they entered the programme. The year of reference (2024) corresponds to a period two years after the theoretical end of the programmes these students entered, 2023 to one year after the theoretical end and 2022 to the theoretical end. The year of entry varies among countries, as it depends on the duration of the programme. Data on drop-out rates by gender and programme orientation are available for consultation online.
1. Data only include information related to new entrants to vocational upper secondary programmes.
2. Data only include information related to new entrants to general upper secondary programmes.
3. Year of reference differ from 2022: 2020 for Japan.
4. Data only cover public institutions.
5. Year of reference differ from 2024: 2023 for Brazil.
The data for this figure can be accessed via https://stat.link/tva6w2.
Any ISCED or non-ISCED programme
Note: Columns giving the totals for men and women and the labour-force status of individuals who are not enrolled in education are available for consultation online.
1. Data only include the graduates from general upper secondary programmes.
The data for this figure can be accessed via https://stat.link/tva6w2.