Based on official regulations or agreements, teachers in public educational institutions in OECD countries and economies are required to teach on average 965 hours per year at pre-primary level, 770 hours at primary level, 710 hours at lower secondary level (general programmes) and 678 hours at upper secondary level (general programmes).
The way teachers' total working time is divided between teaching and non-teaching activities, and the distribution of working hours taking place within the school or elsewhere, varies widely across countries.
Non-teaching tasks are part of teachers’ workloads and there is wide variation across countries as to which tasks are mandatory or voluntary for teachers. Tasks and activities that are considered voluntary in a larger proportion of countries are also those for which teachers are provided an allowance or additional payment in a larger proportion of countries. For example, few countries require teachers to mentor new teachers; and an allowance or additional payment is generally offered to teachers for volunteering to do so.
Education at a Glance 2026

Context
Although statutory working and teaching hours only partly determine teachers’ actual workloads, they do offer valuable insights into the demands placed on teachers in different countries. Teaching hours and the extent of non-teaching duties may also affect the attractiveness of the teaching profession (see Chapter 1, Teacher shortages and the attractiveness of the teaching profession). Together with salaries (see Chapter D3) and average class sizes (see Chapter D2), this chapter presents some key measures of the working lives of teachers.
The proportion of teachers’ statutory working time spent teaching indicates how much time they have available for non-teaching activities, such as lesson preparation, correction, in-service training and staff meetings. A greater share of statutory working time spent teaching may indicate that a smaller share of working time is devoted to tasks such as assessing students and preparing lessons, as stated in regulations. It could also indicate that teachers perform these tasks in their own time and hence work longer hours than their statutory working hours.
In addition to class sizes and the ratio of students to teaching staff (see Chapter D2), students’ hours of instruction (see Chapter D1 of Education at a Glance 2025 (OECD, 2025[1])) and teachers’ salaries (see Chapter D3), the amount of time teachers spend teaching also has implications for the financial resources that countries need to allocate to education (see Chapter C7 of Education at a Glance 2023 (OECD, 2023[2])).
Net statutory teaching time in hours per year, in public institutions

Note: Please refer to the source table for information on whether the data refer to typical, minimum or maximum hours.
1. Actual teaching time (in Latvia except for pre-primary level).
2. Reference year differs from 2023. Refer to the source table for details.
3. Average planned teaching time in each school at the beginning of the school year.
For data, see Table D4.1. The data for this figure can be accessed via https://stat.link/ud51n.
Other findings
Across countries and economies, required teaching time in public institutions varies more widely at the pre-primary level than at any other level, ranging from 505 hours in Mexico to 1 445 hours in Iceland.
Lower secondary teachers spend 42% of their working time on teaching on average, ranging from less than 32% in Bulgaria and the Republic of Türkiye, to 58% or more in Israël, Lithuania, Luxembourg and Scotland (United Kingdom). Teachers in most countries are required to perform various non-teaching tasks during their working time, such as lesson planning/preparation, marking students’ work and communicating or co-operating with parents or guardians.
In 21 OECD countries and economies, teachers’ statutory working time includes working during students’ school holidays in at least one level of education. In most of these countries, working time during school holidays is required to be spent on specific activities, such as preparation for the next school term, or individual and/or collective professional development activities.
Teaching time of teachers
Across pre-primary, primary and secondary levels, countries vary considerably in their annual statutory teaching time – the number of hours per year a full-time teacher in a public school is required to teach. Differences in how teaching time is regulated and/or reported across countries may explain some of the differences in statutory teaching time between countries (for more information see Education at a Glance 2026 Sources, Methodologies and Technical Notes, (https://doi.org/10.1787/dcf64a14-en).
Statutory teaching time in public institutions varies more at the pre-primary level than at any other level among OECD countries and economies with data available. On average, pre-primary teachers are required to teach 965 hours per year, spread over 40 weeks or 193 days. The number of teaching days ranges from 162 days per year in France to 225 days in Germany. Annual teaching hours range from 505 hours or less per year in Mexico to 1 445 hours in Iceland. These wide variations result from the combination of differences in the number of days of teaching and in the number of teaching hours per day. For example, pre-primary teachers teach an average of 2.7 hours per day over 190 days in Mexico, but 6.6 hours per day over 219 days in Iceland (Table D4.1 and Figure D4.1).
Primary school teachers are required to teach an average of 770 hours per year in public institutions. In most countries and economies with available data, teaching time ranges from about 2.4 to 6.2 hours a day, with an OECD average of more than 4 hours per day. There is no set pattern to how teaching time is distributed throughout the year. For example, primary school teachers in the Netherlands teach 940 hours per year, 112 hours more than in Spain (828 hours). However, as teachers teach on more days per year in the Netherlands than in Spain (200 days compared to 176 days), teachers in both countries teach nearly 5 hours a day on average (Figure D4.1).
Lower secondary school teachers in general programmes in public institutions are required to teach an average of 710 hours per year. Teaching time ranges from under 500 hours in Bulgaria, Poland and Thailand, to over 1 000 hours in Chile and Costa Rica (Table D4.1 and Figure D4.1). However, while reported hours refer to the minimum time teachers are required to teach in Thailand, they refer to the maximum teaching time in Chile (see Box D4.2 and Table D.D4.3 in Education at a Glance 2026 Sources, Methodologies and Technical Notes (https://doi.org/10.1787/dcf64a14-en). Where official documents in some countries define a minimum or maximum number of teaching hours, teaching hours can be adjusted to meet the specific needs of individual schools.
A teacher in general upper secondary education in public institutions has an average teaching workload of 678 hours per year. Teaching time ranges from fewer than 500 hours per year in Bulgaria, Iceland, Japan, Poland and Thailand to more than 1 000 hours in Chile and Costa Rica (Figure D4.1). Teachers in Bulgaria, Japan, Korea, Norway, Poland, Thailand and Türkiye teach for less than 3 hours per day, on average, compared to 6 hours or more in Costa Rica (Table D4.1).
In some countries teaching time requirements may differ at the subnational level (Box D4.1), or throughout a teacher’s career, or according to their qualification level (Box D4.2). Several countries reduce some new teachers’ teaching workload during their induction programmes. Some countries also encourage older teachers to stay in the profession by reducing their teaching hours. For example, in Chile, Portugal and Spain, teachers may have a reduced teaching workload based on their number of years in the profession and/or age.
There are regional differences in teachers’ statutory teaching and working time in the four countries reporting subnational data (Belgium, Canada, the United Kingdom and the United States). The number of weeks of teaching (at pre-primary, primary and lower and upper secondary levels) is the same across subnational entities with available data in Belgium and the United Kingdom but varies across provinces in Canada (ranging from 36 to 40 weeks in 2025) and states in the United States (from 34 to 37 weeks in 2021). However, equal number of weeks of teaching at the subnational level can mask differences in teaching time in terms of days or hours of teaching at the subnational level.
The four countries show different patterns of variation at the subnational level. In Belgium, neither the number of days of teaching nor the number of hours vary much (in relative terms) between the Flemish and French Communities, except for teaching time at the pre-primary level (a difference of 9%, from 704 hours in the Flemish Community to 766 hours in the French Community). In the United Kingdom, the number of days of teaching varies by less than 3% between subnational entities with available data (by 5 days), but teaching hours vary much more widely. Teaching time is 48% longer in Wales (1 265 hours) than in Scotland (855 hours). There is greater variation in Canada in both dimensions: the number of teaching days varies by 6% at primary and lower secondary levels, and 9% at the upper secondary level, while teaching time varies by 45% at the primary level (from 700 hours in New Brunswick to 1 018 hours in Manitoba) rising to 65% for lower and upper secondary general programmes (from 615 hours in Québec to 1 018 hours in Manitoba). In contrast, in the United States, the number of days of teaching varies by 6-8% (from 169 days at the primary level to 183 days in general programmes at the upper secondary level) but teaching hours vary much more. At the primary level, teaching time in Michigan (993 hours), the state with the longest teaching hours, is 29% higher than teaching time in Maine (770 hours). For lower and upper secondary general programmes, the difference is 37-38% (from less than 760 hours in New Hampshire at lower secondary level and in Oregon at upper secondary level, to 1 038 hours in Mississippi at lower secondary level and Alabama at upper secondary level) and exceeds 50% at the pre-primary level (from 665 hours in Oregon to 1 018 hours in Alabama).
However, caution is necessary when comparing information at the subnational level: there can be differences in the regulations between countries and between subnational regions within countries, and also differences in how data are reported and varying data availability for subnational regions within countries. For example, these figures refer to typical teaching time for the subnational regions of Belgium, but to estimated teaching time (based on self-reported information from teachers) for the different states in the United States.
Source: (OECD, 2026[3]) Education at a Glance Database, http://data-explorer.oecd.org/s/4sg.
Differences in teaching time by level of education
Teaching time tends to decrease as the level of education increases, which may be due to teaching at higher levels requiring more subject specialisation and preparation from teachers as well as a larger non-teaching workload (for example, due to examinations). In most countries and economies, the number of statutory teaching hours (in public institutions) at the pre‑primary level is greater than at the upper secondary level (general programmes). The exceptions are Brazil, Chile and Scotland (United Kingdom), where teachers are required to teach the same number of hours at all levels of education, and Colombia, Costa Rica, Mexico and Thailand, where upper secondary school teachers are required to teach more hours than pre-primary school teachers (Table D4.1).
The largest difference in teaching time requirements is between the pre-primary and primary levels of education. On average across the countries and economies with data for both levels, pre-primary teachers are required to spend about 36% more time in the classroom than primary teachers. In Bulgaria, Croatia, Czechia, Estonia, Iceland, Latvia and Slovenia, pre-primary school teachers are required to teach more than twice the number of hours per year as primary school teachers (Table D4.1).
Primary school teachers teach 9% more hours per year on average than lower secondary school teachers. The difference reaches or exceeds 30% in the Netherlands, Romania and Türkiye whereas there is no difference in Brazil, Chile, Czechia, Hungary, Iceland, Scotland (United Kingdom), Slovenia and Thailand. In contrast, the teaching workload for primary school teachers is lighter than for lower secondary teachers – by 3-7% in Bulgaria, Costa Rica, Estonia and Lithuania; 14% in Latvia; 17% in Croatia; and 23% in Mexico (Table D4.1).
In most countries and economies, the teaching hours in lower and upper secondary levels are similar (5% different or less). However, lower secondary teachers teach at least 25% more hours per year than their upper secondary counterparts in Iceland and in Norway (Table D4.1).
In this chapter, data on the working conditions of teachers refer to full-time fully qualified teachers in the reference year, as defined for each country. Although there are minimum qualification requirements (usually a tertiary qualification) to enter the teaching profession and become fully qualified teachers (see Chapter D6 in Education at a Glance 2023 (OECD, 2023[2])), some countries set other (higher or lower) qualification levels associated with different levels of compensation (see Chapter D3). In some countries, teachers’ qualifications may influence their teaching hours. In these cases, the data on teaching time refer to typical qualification levels, that is to say the most prevalent qualification teachers hold. For example, in France, general secondary teachers can have two different tertiary qualifications (certification or agrégation) which have different teaching requirements, and the teaching time cited for secondary teachers refers to those with certification, the most prevalent qualification at this level.
Data on teaching time refer to net contact time as stated in the regulations of each country. The international data collection exercise ensures that similar definitions and methodologies are used when compiling data from all countries. For example, teaching time is converted into hours (of 60 minutes) to avoid differences resulting from the varying length of teaching periods between countries.
Official documents might regulate teaching time as a minimum, typical or maximum time, and these differences may explain some of the differences reported between countries. Although most data refer to typical teaching time, about one-third of countries and economies report either maximum or minimum values for teaching time. Some other countries report an average. For example, teaching time for Latvia is reported as typical value, but this is statutory data for pre-primary level and actual data for primary and secondary levels (see Table D.D4.3 in Education at a Glance 2026 Sources, Methodologies and Technical Notes (https://doi.org/10.1787/dcf64a14-en)).
Statutory teaching time in this international comparison excludes preparation time and periods of time formally allowed for breaks between lessons or groups of lessons. However, at pre-primary and primary levels, short breaks (of ten minutes or less) are included in the teaching time when the classroom teacher is responsible for the class during these breaks (for example, at the primary level in Austria, France, Hungary, Italy, Korea, the Netherlands, Peru, Poland, Romania, the Slovak Republic, Spain and Switzerland).
To enhance data comparability, professional development days (including attending conferences) and student examination days are excluded from teaching hours. At each level of general education, about two-thirds of the countries and economies with available information were able to exclude the number of days spent on these activities when reporting statutory teaching time (see Table D.D4.4 in Education at a Glance 2026 Sources, Methodologies and Technical Notes (https://doi.org/10.1787/dcf64a14-en)). However, in the rest of the countries, regulations do not always specify the number of days devoted to some of these activities and/or whether teachers are required to conduct these activities outside of scheduled teaching times, making it difficult to estimate and exclude them from teaching time.
Less than one-third of countries and economies cannot exclude professional development days from reported teaching time: the regulations specify some days of professional development activities for all teachers, but the impact on reported teaching time is difficult to estimate as the number of days and how they are organised during the school year may vary across schools or subnational entities. Similarly, more than one‑quarter of countries and economies with available information cannot exclude student examination days from teaching time at each level of general education. Although the regulations may include some guidelines about the number of student examination days, they are not clear about whether scheduled teaching time is reduced by the time devoted to examinations, and if so, by how much. Overall, not excluding the time devoted to professional development and student examination may result in annual teaching time being overestimated by a few days in these countries.
In some cases, some professional development activities and student examinations may result in the overestimation of teaching time, even if countries are not asked to exclude them from teaching hours. Examples include professional development activities required for specific groups of teachers only (when regulations do not explicitly forbid them from participating during their scheduled teaching time) and compulsory standardised student assessments which are conducted for only a few hours of the school day. The complexity of estimation and the fact that only some teachers participate in these activities make it difficult to standardise reporting practices across all countries in order to exclude these activities from teaching time.
More detailed information on the reporting practices on teaching time and working time is available in Education at a Glance 2026 Sources, Methodologies and Technical Notes (https://doi.org/10.1787/dcf64a14-en).
Actual teaching time
Statutory teaching time, as reported by most of the countries in this chapter, refers to teaching time as defined in regulations. However, individual teachers may spend more or less time teaching than the statutory hours, for example, because of overtime, leave (in addition to statutory leave) or because statutory teaching time is defined in terms of minimum or maximum hours. Actual teaching time is the annual average number of hours that full‑time teachers spend teaching a group or a class of students, including overtime and other activities ranging from keeping order to administrative tasks, and therefore provides a clearer picture of teachers’ actual teaching workload.
While only a few countries were able to report both statutory and actual teaching time, these data suggest that actual teaching time can differ from the statutory requirements. For example, lower secondary teachers in Lithuania actually taught 2% less hours in 2024 than their 2025 statutory teaching time, while those in Poland taught 22% more hours (see Table D.D4.6 in Education at a Glance 2026 Sources, Methodologies and Technical Notes (https://doi.org/10.1787/dcf64a14-en), and the OECD Data Explorer (http://data-explorer.oecd.org/s/4s)).
Differences between statutory and actual teaching time may result from overtime due to teacher absences or shortages. The nature of the data can also contribute to differences, as figures on statutory teaching time refer to official requirements and agreements, whereas actual teaching time is based on administrative registers, statistical databases, representative sample surveys or other representative sources (for more details, see Education at a Glance 2026 Sources, Methodologies and Technical Notes (https://doi.org/10.1787/dcf64a14-en)).
Working time of teachers
In the majority of countries and economies, full-time teachers’ working time is partly determined by the statutory teaching time specified in working regulations. In addition, teachers in most countries are also formally required to work a specific number of hours per year, as stipulated in collective agreements or other contractual arrangements. This may be specified either as the number of hours teachers must be available at school for teaching and non-teaching activities (working time required at school), or as the total number of working hours. Both correspond to official working hours as specified in contractual agreements, and countries differ in how they allocate time for each activity. These teaching and working time requirements are adjusted for part-time teachers (Box D4.3).
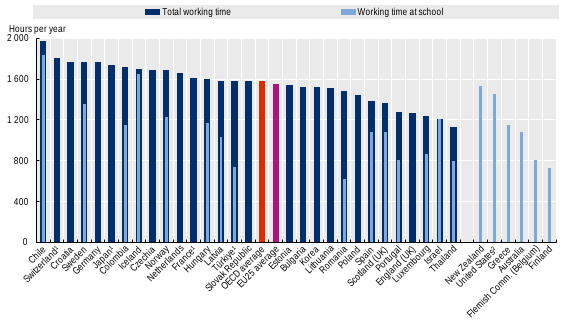
Nearly half of countries and economies specify teachers’ working time required at school for at least one level of education. In more than one-third of the 18 countries with available data for both pre-primary and upper secondary levels, the number of hours teachers are required to be available at school differs by less than 5% between these levels. Among the remaining countries and economies, pre-primary teachers’ working time required at school is at least 20% more than their upper secondary counterparts in the Flemish Community of Belgium, Hungary, Luxembourg, Portugal, Sweden and Türkiye, and the difference exceeds 38% in Latvia and Romania. Greece and Israel are the only countries where upper secondary teachers are required to be working at school for at least 3% more hours than their pre-primary counterparts. Despite these large differences in working time required at schools between pre-primary and upper secondary levels, total statutory working time is the same for both levels in Hungary, Romania and Türkiye (Table D4.2).
Statutory working time in hours per year, in general programmes in public institutions
1. Teachers' working time requirements refer to those of civil servants.
2. Reference year differs from 2023. Refer to the source table for details.
For data, see Table D4.2. The data for this figure can be accessed via https://stat.link/ud51n.
In some countries, the regulations only specify teachers’ total annual statutory working time (at school and elsewhere), but not the working time required at school. This is the case for all levels of education in about one-quarter of OECD countries and economies (Bulgaria, Croatia, Czechia, England [United Kingdom], Japan, Korea, Lithuania, the Netherlands, Poland, the Slovak Republic and Switzerland) and for some levels of education in Estonia (primary and secondary), France (secondary), the French Community of Belgium (pre-primary and primary) and Germany (at primary and secondary level) (Table D4.2 and Figure D4.2).The variations across countries in teachers’ annual working hours can be partly due to whether their total working time covers the periods when students are on school vacations. For example, at general upper secondary level, total working time for teachers in Israel, who are not required to work during school vacations, is 1 217 hours, compared to 1 807 hours in Switzerland, where teachers work up to 4 weeks (174 hours) during school vacations (Figure D4.3). In 21 countries and economies, teachers’ statutory working time includes working during students’ school holidays in at least one level of education. In most of these, teachers are required to spend the working time during school holidays on specific activities, such as preparation for the next term, or individual and/or collective professional development activities (see Table D.D4.5 in Education at a Glance 2026 Sources, Methodologies and Technical Notes, (https://doi.org/10.1787/dcf64a14-en)).
Non-teaching time
Although teaching time is a substantial component of teachers’ workloads, other activities such as assessing students, preparing lessons, correcting students’ work, in-service training and staff meetings should also be taken into account when analysing the demands placed on teachers in different countries. The amount of time available for these non-teaching activities varies across countries; a larger share of statutory working time spent teaching may indicate that a smaller share of time is devoted to these activities or that they are done outside the statutory working time.
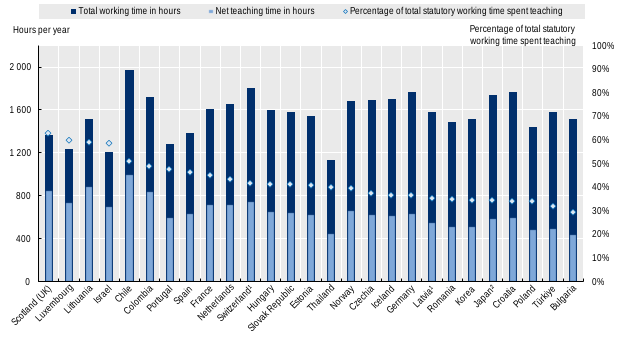
Even though teaching is their core activity, teachers spend most of their working time on non-teaching activities in many countries. In the 27 countries and economies with data for both teaching and total working time for lower secondary teachers, 42% of teachers’ working time is spent on teaching on average, with the proportion ranging from less than 32% in Bulgaria and Türkiye, to 58% or more in Israel, Lithuania, Luxembourg and Scotland (United Kingdom) (Figure D4.3).
Although the proportion of working time spent teaching tends to increase with the number of teaching hours per year, there are some differences among countries. For example, Luxembourg and the Netherlands have a similar number of teaching hours at lower secondary level (739 hours per year in Luxembourg and 720 hours in the Netherlands), but 60% of teachers’ working time is spent on teaching in Luxembourg, compared to 43% in the Netherlands. In some other countries, teachers devote similar proportions of their working time to teaching, despite having considerably different teaching hours. For example, in both Croatia and Poland, lower secondary teachers spend about 34% of their working time teaching, but have 604 teaching hours per year in Croatia, compared to 486 hours in Poland (Figure D4.3).
A few countries and economies have no formal requirements about the amount of time teachers spend on non-teaching activities, at least at some levels of education. This is the case in countries that only define the number of teaching hours per year, and not their annual working hours (at school or elsewhere), such as Austria (primary and secondary levels), Brazil, Costa Rica, the French Community of Belgium (lower and upper secondary levels), Italy and Mexico (Table D4.2). However, this does not mean that teachers are given total freedom over how they carry out other tasks. In Italy, teachers are required to perform up to 80 hours of scheduled non-teaching collegial work at school per year. Of these 80 hours, up to 40 hours are dedicated to meetings of the teachers’ assembly, staff planning meetings and meetings with parents, with the remaining 40 hours dedicated to class councils (Table D.D4.5 in Education at a Glance 2026 Sources, Methodologies and Technical Notes, (https://doi.org/10.1787/dcf64a14-en)).
Annual net teaching and total statutory working hours, in general programmes in public institutions
Note: Please refer to source tables for information on whether the data refer to typical, minimum or maximum hours.
1. Actual teaching time.
2. Average planned teaching time in each school at the beginning of the school year.
Countries and other economies are ranked in descending order of the percentage of total statutory working time spent teaching.
For data, see Figure D4.2 and Table D4.2. The data for this figure can be accessed via https://stat.link/ud51n.
Non-teaching tasks and responsibilities
Non-teaching tasks are a part of teachers’ workloads and working conditions. The non‑teaching activities required by legislation, regulations or agreements between stakeholders (e.g. teachers’ unions, local authorities and school boards) do not necessarily reflect teachers’ actual participation in non-teaching activities, but they provide an insight into the breadth and complexity of teachers’ roles, and may explain part of the stress related to the teachers’ workloads (Box D4.3).
Teachers do not necessarily spend their working time in the way statutory arrangements suggest. Data from the Teaching and Learning International Survey 2024 (TALIS 2024) allows the actual time lower secondary teachers spend on different tasks to be identified and the prevalence of stress associated with those tasks assessed.
Workload, stress and salaries are key determinants of teachers' job satisfaction and ultimately of the attractiveness of the teaching profession. High levels of stress and disproportionate workloads compared to other workers can discourage potential candidates from entering the profession and encourage current teachers to leave (see Chapter 1), while competitive salaries (see Chapter D3) and manageable working conditions help retain experienced teachers and attract new candidates.
Allocation of actual working time
Across all OECD countries, lower secondary teachers report teaching as their main activity, although it accounts for less than half of their workload. On average, they reported spending 43% of their total actual working time1 teaching (OECD, 2025[4]). The share is similar to that derived from statutory data. Teaching only exceeds half the self-reported working time of teachers in Finland and the French Community of Belgium. Lesson planning (14% of working time on average) and marking students’ work (9%) are the next most time-consuming activities. Teachers also report spending about 6% of their working time on administrative tasks on average, ranging from about 4% or less in France and Romania, to over 9% in Japan and about 14% in Korea.
Across most OECD countries and economies, average teaching time does not differ significantly by teachers' years of experience (Table 3.12 in (OECD, 2025[4])). Where differences do exist, novice teachers (those with up to five years of teaching experience) are more likely to report spending a larger share of working time teaching than experienced teachers (with more than ten years of experience). This is the case in 11 OECD countries and economies, while the opposite pattern is observed in only 6. Novice and experienced teachers do appear to organise their non-teaching time differently. On average across OECD countries, novice teachers spend over half an hour more per week on lesson planning than their experienced peers and in 12 OECD countries and economies, this gap widens to between one and two additional hours per week. Although there is no significant difference in the time novice and experienced teachers spend on marking and correcting on average across OECD countries, in the 15 OECD countries and economies where differences do emerge, experienced teachers report spending more time on this task than novice ones, with the difference exceeding one hour in Israel, Lithuania, Portugal and Romania.
Workload and source of stress
The relationship between teaching workload and stress is complex. The volume and distribution of working time provide only a partial picture of teachers' workload. Some activities tend to weigh more heavily than others on teachers' self‑reported stress, and the tasks perceived as most stressful are not always the most time-consuming. These pressures can have broader consequences for how teachers organise their professional lives, potentially leading to them adjusting their working arrangements, including opting to teach part time (see Chapter D5).
On average across OECD countries, the share of teachers who reported experiencing “a lot” of stress in their work increased slightly from 17.4% in 2018 to 18.8% in 2024 (Table 2.4 in (OECD, 2025[4])). However, in some countries and economies there are much larger increases, of 7-11 percentage points in Australia (+9.8 points), Estonia (+10.7 points), Japan (+7.2 points) and Norway (+8.1 points) and exceeding 15 percentage points in Alberta (Canada) (+15.4 percentage points). In 2024, particularly high shares were reported in Australia (34.0% of teachers), Estonia (28.5%), Hungary (28.5%), New Zealand (32.9%) and the United States (29.6%). Administrative workload also appears to be a major source of pressure. Across the OECD, more than half of teachers (51.7%) report that having too much administrative work is a source of stress “quite a bit” or “a lot”, with particularly high shares in Australia (69.0% of teachers), the Flemish Community of Belgium (75.5%), Portugal (79.3%), Spain (64.3%) and South Africa (66.1%) (Table 3.16 in (OECD, 2025[4])).
On average across OECD countries, 31% of lower secondary teachers identify the number of teaching hours as a source of stress. The share exceeds 50% in Brazil, Portugal, Saudi Arabia and South Africa. Teaching hours generally weighs equally on teachers regardless of their experience level, but where differences do emerge, experienced teachers tend to be more likely than novice teachers to report higher levels of stress, with an average gap of around 4 percentage points across OECD countries (Table 3.16 in (OECD, 2025[4])).
Marking students’ work is a source of stress for 40% of teachers across OECD countries, ranging from around 25% in Finland and Iceland to over 70% in Portugal. Experienced teachers were more likely to report stress from this than novice teachers across most OECD countries, a difference that exceeded 14 percentage points in Costa Rica and Denmark. The reverse pattern emerges only in Alberta (Canada), Colombia, Japan and the United States, where a greater share of novices report stress from this aspect of their work than their more experienced colleagues (Table 3.16 in (OECD, 2025[4])).
Other responsibilities, including being held accountable for student achievement, maintaining classroom discipline and addressing parents’ or guardians’ concerns, are equally likely to be identified as sources of stress by teachers, even though they are less time consuming than the activities identified above.
Source: OECD (2025[4]), Results from TALIS 2024: The State of Teaching, https://doi.org/10.1787/90df6235-en
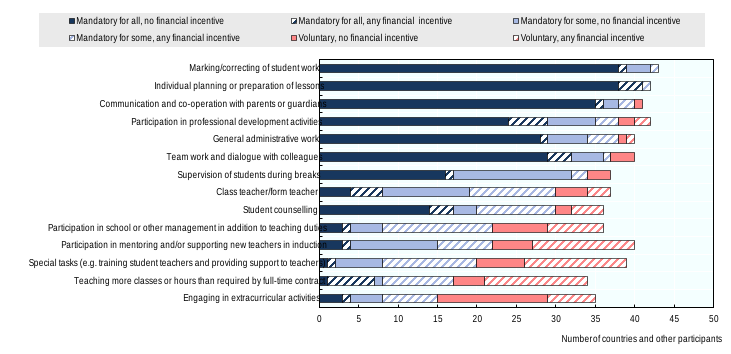
As with other employees, individual teachers often have no choice about whether or not to perform certain tasks. According to national regulations for general lower secondary teachers, individual planning or preparing lessons and marking and correcting student work are two non‑teaching tasks that are mandatory for teachers during their statutory working time in at least 40 out of the 46 countries and economies with available data. Communicating and co‑operating with parents is also mandatory in 36 countries and economies. General administrative work and teamwork and dialogue with colleagues are also required in at least 29 countries and economies, and can be decided at the school level in at least 5 other countries with available data (Table D4.3, available online).
Responsibilities such as serving as a class or form teacher, participating in mentoring programmes or supporting new teachers in induction programmes, and participating in school or other management in addition to teaching duties are common among lower secondary teachers. These responsibilities are either mandatory for teachers or mandatory at the discretion of schools in more than half of countries. Full-time classroom teachers in general lower secondary education are either required or asked to perform student counselling in more than two-thirds of countries and economies with available information. However, not all teachers are eligible to carry out student counselling in some countries. For example, in Israel, only teachers with a master’s degree or higher can perform this duty (Table D4.4, available online).
Teachers can also take on responsibilities voluntarily. In at least 20 countries and economies, individual lower secondary teachers in general programmes may choose to engage in extracurricular activities or undertake special tasks. Teaching more classes or hours than their full-time contract requires is also a voluntary decision by teachers in more than one-third of countries and economies (Table D4.4, available online).
Participation in professional development activities is considered an important responsibility of teachers at all levels of education, as it is mandatory for all teachers at all levels in at least 27 countries and economies and is required at the discretion of individual schools in at least 8. Only three countries (Israel, Norway and Portugal) allow teachers to participate in professional development activities at their own discretion at all levels (Table D4.4, available online). Regardless of these requirements, a large majority of teachers in OECD countries participate in professional development activities (OECD, 2025[4]).
In general, requirements to perform certain tasks and responsibilities do not vary much between levels of education. However, there can be some differences, reflecting the changing needs of students at different levels of education. For example, supervising students during breaks is mandatory for teachers more widely at pre-primary level (25 countries and economies), than at primary (23), lower secondary (17) and upper secondary (16) (Table D4.3, available online).
Differences in task requirements between countries could help explain differences in the proportion of statutory working time teachers spend on non-teaching tasks and responsibilities. For example, Japan is one of the 11 countries where engaging in extracurricular activities is mandatory at the discretion of schools at lower secondary level (Table D4.4, available online), and lower secondary teachers in Japan reported spending the highest proportion of their actual working time on this responsibility (10%) among OECD countries (OECD, 2025[4]).
Regardless of whether they are mandatory or not, teachers may receive some compensation for performing additional tasks and responsibilities, either in the form of reduced teaching time or through allowances or remuneration on top of their base salaries according to different criteria (see Chapter D3 for the criteria for additional payments). At lower secondary level, as at other levels of education, the number of countries awarding teachers an allowance or additional payment varies depending on the tasks and responsibilities concerned. Tasks and activities that are considered voluntary in a larger proportion of countries are also those for which teachers are provided an allowance or additional payment in a larger proportion of countries. For example, few countries require teachers to mentor new teachers, and an allowance or additional payment is generally offered to teachers for volunteering to do so (Figure D4.4).
Number of countries and other economies, in general programmes in public institutions
Note: "Mandatory for some" indicates that the specified task or responsibility is mandatory at the discretion of individual schools or in some subnational entities. "Financial incentive" indicates the task results in an allowance or additional payments for teachers.
Tasks and responsibilities are listed in decreasing order of the number of countries and other economies where the specified item is mandatory to some extent.
For data, see Tables D4.3 and D4.4 (available online). The data for this figure can be accessed via https://stat.link/ud51n.
Tasks related to teaching such as individual planning or preparing lessons, marking and correcting student work, and communicating and co-operating with parents are rarely compensated. At lower secondary level, performing these tasks results in an additional payment or allowance in at most three countries (less than 10% of those where these tasks are either mandatory or voluntary). However, more than three‑quarters of countries and other economies (where tasks are mandatory or voluntary) offer financial compensation to teachers at lower secondary level for teaching more classes or hours than their full-time contract requires (Figure D4.4 and Table D4.4, available online). This may be explained by the fact that this task is directly related to teachers’ main role; their statutory conditions clearly define the number of hours they are expected to teach, so they need to be compensated for any additional hours of teaching.
Participation in school or other management activities can result in additional compensation for teachers in more than half of the countries and economies with available data. In some, their teaching time might be reduced to balance the workload between teaching and other responsibilities, in addition to financial compensation (Figure D4.4 and Table D4.4, available online).
This chapter analyses teaching and working time of teachers in public institutions, focusing on full-time teachers to ensure the comparability of information across countries. However, a significant proportion of teachers work on a part-time basis, and the share of part-time teachers varies significantly across countries (see Chapter D5).
Furthermore, teachers can vary in their degree of part-time work. In 17 out of 35 countries, the largest proportion of part-time teachers work 70-90% of the statutory working time of a full-time teacher. However, working less than half of the full-time statutory hours is also common, and this is even the most common form of part-time work in eight countries (Table 7.43 in (OECD, 2025[4])). This means that teachers’ working time can still vary significantly even between two countries with a similar share of part-time teachers.
Note: Results are based on teachers' responses and refer to teachers’ employment status in the school where they completed the survey.
1. Estimates should be interpreted with caution due to higher risk of non-response bias.
Source: (OECD, 2025[4]),Table 7.47 in Results from TALIS 2024: The State of Teaching (https://doi.org/10.1787/90df6235-en).
Part-time work can be voluntary, if teachers choose to work fewer hours, or it can be involuntary, if teachers would like to work longer hours but are offered only a part-time contract. According to TALIS 2024 (Tables 7.47 and 7.50 in (OECD, 2025[4])), over one-third of all teachers working part time across OECD countries are doing so involuntarily2 (see Chapter 1).
Differences in part-time working by age
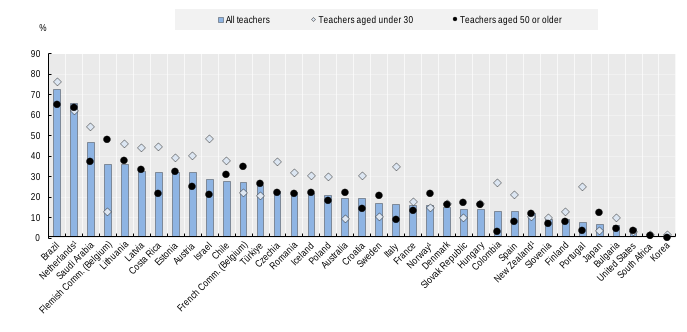
The attractiveness of the teaching profession can also differ by age, which may also explain differences in the share of part-time teachers by age groups. Figure D4.5 compares shares of the part-time teachers at lower secondary level for older (50 or older) and younger teachers (under 30) with the overall share for teachers of all ages (note that in the TALIS data used for this figure, part-time teachers refer to those working part-time at the school where the teacher responded to the TALIS survey). The share of part-time teachers among those under 30 is 5 percentage points higher than among all teachers in 17 out of 35 countries. This difference exceeds 15 percentage points in Israel, Italy and Portugal. In contrast, the proportion of part-time teachers is at least 5 percentage points lower for younger teachers than for all teachers in Australia, the Flemish Community of Belgium and Sweden.
Among teachers aged 50 or older, the rate of part-time working tends to be similar to the general teacher population. The share of older teachers working on a part-time basis is at least 5 percentage points higher than for all teachers in four countries, and at least 5 percentage points lower in seven countries. In the rest of the countries, the share of part time employment among these two age groups differs by less than 5 percentage points.
Part-time work can also take the form of part-year employment, which refers to a full-time working arrangement for only part of the year, and not working for the remainder. The TALIS survey does not collect data on part-year employment of teachers but collects information on teachers with fixed-term contracts that could be a proxy for estimating the number of part-year teachers. Since fixed-term contracts might be used as a trial evaluation period, younger teachers would be expected to have higher rates of fixed-term contracts. Fixed-term contracts can also be chained seamlessly or directly transformed into permanent contracts, leading to full-time employment.
According to TALIS 2024, 19% of teachers in the schools surveyed are on fixed-term contracts (Table 7.37 in (OECD, 2025[4])). Working only part of the year might reflect difficulties in securing full-time employment. Nearly half of all teachers on a fixed-term contract could be considered to be so involuntarily (defined as having a fixed-term contract but valuing job security highly). In almost all countries except Latvia, Lithuania and Korea, the share of young teachers on fixed-term contract is at least 5 percentage points higher than all teachers. Japan is the only country where the share of older teachers on fixed term contracts is significantly higher than all teachers. In all other countries the difference is either close to zero or negative, indicating that younger teachers are more likely in almost all countries to work on a fixed term contract.
As teachers’ salaries usually increase with the number of years of experience, and so indirectly with their age, part-time work arrangements can affect the measure of teachers’ relative salaries (defined as the ratio between their salaries and those of tertiary-educated workers) if the extent of part-time work is distributed unevenly across age groups (see Chapter D3).
Actual teaching time is the annual average number of hours that full-time teachers teach a group or class of students. It includes all extra hours, such as overtime. Data on these hours can be sourced from administrative registers, statistical databases, representative sample surveys or other representative sources.
The number of teaching days is the number of teaching weeks multiplied by the number of days per week a teacher teaches, minus the number of days on which the school is closed for holidays.
The number of teaching weeks refers to the number of weeks of instruction excluding holiday weeks.
Statutory teaching time is defined as the scheduled number of 60-minute hours per year that a full-time teacher teaches a group or class of students, as set by policy, their employment contracts or other official documents. Teaching time can be defined on a weekly or annual basis. Annual teaching time is normally calculated as the number of teaching days per year multiplied by the number of hours a teacher teaches per day (excluding preparation time). It is a net contact time for instruction, as it excludes periods of time formally allowed for breaks between lessons or groups of lessons and the days that the school is closed for holidays. At pre-primary and primary levels, short breaks between lessons are included if the classroom teacher is responsible for the class during these breaks.
Total statutory working time refers to the number of hours that a full-time teacher is expected to work as set by policy. It can be defined on a weekly or annual basis. It does not include paid overtime. According to a country’s formal policy, working time can refer to:
the time directly associated with teaching and other curricular activities for students, such as assignments and tests
the time directly associated with teaching and other activities related to teaching, such as preparing lessons, counselling students, correcting assignments and tests, professional development, meetings with parents, staff meetings, and general school tasks.
Working time required at school (of teachers) refers to the time teachers are required to spend working at school, including teaching and non-teaching time.
When interpreting differences in teaching hours among countries, net contact time, as used here, does not necessarily correspond to the teaching load. Although contact time is a substantial component of teachers’ workloads, preparing for classes and the necessary follow-up, including correcting students’ work, also need to be included when making comparisons. Other relevant elements, such as the number of subjects taught, the number of students taught and the number of years a teacher teaches the same students, should also be taken into account.
For more information please see the OECD Handbook for Internationally Comparative Education Statistics 2018 (OECD, 2018[5]) and Education at a Glance 2026 Sources, Methodologies and Technical Notes, (https://doi.org/10.1787/dcf64a14-en) for country-specific notes.
Data are from the 2025 OECD-INES-NESLI Survey on Working Time of Teachers and refer to the school year 2024/25 (statutory information) or school year 2023/24 (actual data), unless otherwise indicated.
References
[3] OECD (2026), Education and Skills, OECD Data Explorer, http://data-explorer.oecd.org/s/5q (accessed on 2 July 2026).
[1] OECD (2025), Education at a Glance 2025: OECD Indicators, OECD Publishing, Paris, https://doi.org/10.1787/1c0d9c79-en.
[4] OECD (2025), Results from TALIS 2024: The State of Teaching, TALIS, OECD Publishing, Paris, https://doi.org/10.1787/90df6235-en.
[2] OECD (2023), Education at a Glance 2023: OECD Indicators, OECD Publishing, Paris, https://doi.org/10.1787/e13bef63-en.
[5] OECD (2018), OECD Handbook for Internationally Comparative Education Statistics 2018: Concepts, Standards, Definitions and Classifications, OECD Publishing, Paris, https://doi.org/10.1787/9789264304444-en.
The data for the figures and tables in this chapter can be downloaded via https://stat.link/ud51nx.
To access further data and/or other education indicators, please visit the OECD Data Explorer: http://data-explorer.oecd.org/s/4s
Data cut-off for the print publication 17 June 2026. Please note that the Data Explorer contains the most recent data.
Number of statutory teaching weeks, teaching days and net teaching hours in public institutions over the school year
Note: Data on vocational programmes at lower secondary level (Columns 4, 10 and 16) are available for consultation online.
1. Typical teaching time (teaching time required from most teachers when no specific circumstances apply to teachers).
2. Maximum teaching time.
3. Minimum teaching time.
4. Average planned teaching time in each school at the beginning of the school year.
5. Actual teaching time (in Latvia, except for pre-primary level).
6. Year of reference 2021.
The data for this table can be accessed via https://stat.link/ud51n.
Teachers' statutory working time at school and total working time in public institutions over the reference year
Note: Data on vocational programmes at lower secondary level (Columns 4 and 10) are available for consultation online.
1. Total working time requirements refer to those of civil servants.
2. Year of reference 2021.
The data for this table can be accessed via https://stat.link/ud51n.
← 1. TALIS collects data on both total weekly workload, reported as a single figure, and disaggregated estimates of hours spent on specific tasks. The survey does not constrain teachers’ responses, so the sum of disaggregated time spent on individual tasks (e.g. teaching, planning, marking and correcting, communicating with parents, etc.) can exceed the reported total workload. To analyse the distribution of working time across different activities, this chapter looks at the task-based data as a share of the sum of time devoted to all tasks among teachers working full-time (pages 108-109 (OECD, 2025[4])).
← 2. In TALIS involuntary part-time work refers to teachers working part-time even though not considering job flexibility as highly important. On average, involuntary part-time work is 7% among all teachers (full-time and part-time), and 19% of teachers work part-time. Then more than one-third (7/19) of teachers working part-time are doing so involuntarily.