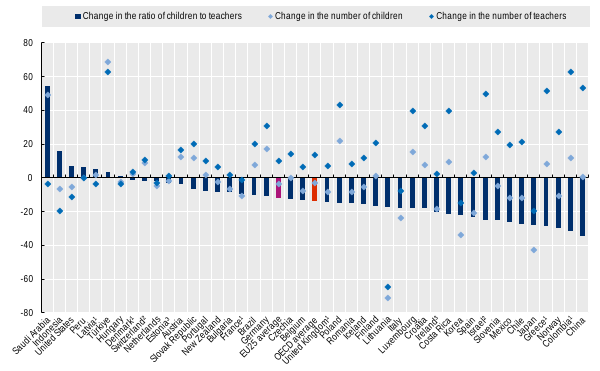
Between 2015 and 2024, the ratio of children to teachers in pre-primary education fell by an average of 14% across OECD countries. This improvement resulted from a 14% increase in the number of teachers combined with a 2% decline in student enrolment.
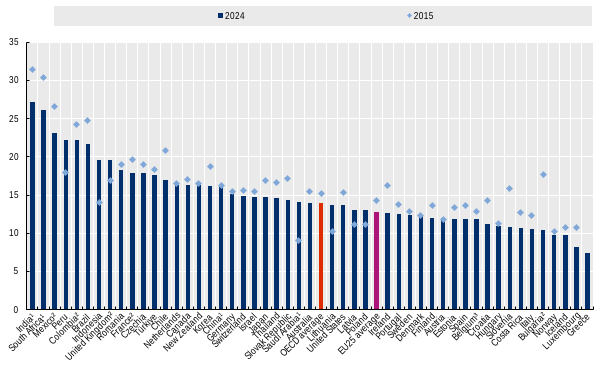
In primary education, the average student-teacher ratio across OECD countries fell slightly from 15:1 in 2015 to 14:1 in 2024. There is substantial cross-country variation in primary staffing in 2024, with ratios ranging from as low as 7:1 in Greece and 8:1 in Luxembourg to as high as 22:1 in Colombia and 23:1 Mexico.
In lower secondary education, class size and student-teacher ratios are moderately positively correlated, although they reflect different dimensions of teaching resources. For example, Japan and the United States have similar student-teacher ratios (12:1 and 14:1), but average class sizes differ markedly, at 32 and 21 students respectively.
Education at a Glance 2026

In per cent
1. Year of reference differs from 2015.
2. Public institutions only.
3. Pre-primary includes early childhood educational development programmes (ISCED 01).
For data, see Data Explorer. The data for this figure can be accessed via https://stat.link/po9vrb.
Context
Class sizes and student-teacher ratios are two key indicators closely monitored by policymakers, as both have a significant impact on educational expenditure, particularly through the cost of teacher salaries. These metrics provide important insights into the allocation of resources within education systems and their potential influence on the quality of the learning environment.
This chapter examines these indicators across multiple educational levels, from early childhood education (ECE) to tertiary education. At each stage, the nature of teacher-student interactions changes to reflect differences in pedagogical approaches and developmental needs. In ECE settings, for instance, the presence of auxiliary staff such as teachers’ aides is common, supporting both instructional and caregiving roles and significantly influencing the child-to-staff ratio.
In light of current challenges – including demographic shifts, teacher shortages and budget constraints – it is essential to monitor these indicators and their evolution over time. These factors influence both the quality of education and the ability of systems to meet the diverse needs of students, requiring ongoing attention to ensure sustainable human resource planning.
Other findings
Across OECD countries, student-to-teacher ratios remained relatively consistent across education levels, from an average of 14:1 in primary, 13:1 in lower and upper secondary and 15:1 in tertiary education. While these averages suggest overall consistency, national ratios vary significantly between educational stages, reflecting diverse institutional structures and policy priorities in the allocation of teaching staff.
Average class sizes in primary education remained stable at 21 students across all institutions between 2015 and 2024, although diverging trends emerged in specific national contexts. In Israel and the United Kingdom, for instance, class sizes in the private sector rose while those in the public sector remained relatively stable.
Class sizes increase on average to 23 students in lower secondary education, reflecting the transition from a generalist primary model to the subject-specialised instruction of secondary school. This upward trend is observed in the majority of countries, most notably in Costa Rica and Thailand, although some systems such as Australia and the United Kingdom show a decrease between these levels.
Note
Student-teacher ratios and class sizes measure very different characteristics of the educational system. Student-teacher ratios compare the number of students to the number of teachers at a given level of education and in similar types of institutions. This indicator provides information on the level of teaching resources available in a country relative to its student population, reflecting the human resources allocated, whether directly or indirectly, to children's education. This ratio is of importance from both administrative and economic standpoints as it is closely related to the amount of money spent per student.
In contrast, class sizes measure the average number of students that are grouped together in a classroom, which has greater significance from a psychological standpoint and is a more direct measure of the teaching resources brought to bear on a student’s development. At higher levels of education, an individual student will often attend several different classes, depending on the subject area. This makes class sizes difficult to define and compare at these levels. Therefore, this indicator is limited to primary and lower secondary education.
Student-teacher ratios and class sizes are essential indicators of the human resource investment in education. They provide a proxy for the intensity of the instructional relationship and the capacity of teachers to offer individualised support to their students (OECD, 2024[1]). For policymakers, these metrics are central to balancing educational quality with fiscal sustainability, as teachers’ salaries represent the largest share of educational spending (see Chapter D3). Furthermore, staffing levels influence teachers’ working conditions and student engagement, directly impacting the overall effectiveness and equity of school systems. As demographic shifts and teacher shortages continue to affect the organisation and allocation of teaching resources, monitoring how these ratios evolve is vital for sustainable human resource planning.
Staffing of early childhood education
Early childhood education and care (ECEC) profoundly influences children's educational, cognitive, behavioural and social development, both in the short and long term. As a foundational stage for lifelong learning and well-being, high-quality ECEC contributes to reducing inequalities and promoting inclusion from an early age. The quality of ECEC systems is influenced by a complex interplay of factors, including curriculum and pedagogy, staff education and training, workforce composition, staff-to-child ratios, and monitoring mechanisms at the system and setting level. These elements serve as key policy levers to enhance service quality and foster more equitable and inclusive environments (OECD, 2025[2]). Although no single indicator can fully capture the complexity of ECEC quality and the interactions between children and staff, workforce composition and staff-child ratios provide valuable insights into two essential dimensions of quality. The analysis that follows focuses on early childhood education (ECE), i.e. ECEC services that meet the criteria for ISCED level 0 (see Definitions section).
Child-to-staff and child-to-teacher ratios
The ratios of children to teachers and children to contact staff both provide insight into staff intensity but capture different aspects of provision. The child-to-teacher ratio refers to the number of children per qualified teacher, while the child-to-contact-staff ratio covers all staff members who work directly with children, including both teachers and teachers’ aides. It is important to distinguish between the two, as they can lead to very different interpretations of staff availability in ECEC settings.
The intensity of staffing in early childhood educational development programmes (ISCED 01) is primarily driven by the developmental needs of children under the age of 3, who require more sensitive and individualised interaction (COFACE Families Europe, 2023[3]). On average across OECD countries, there are 10 children for every teacher at this level, but when all contact staff are taken into consideration, the ratio drops to an average of 5 children per staff member. These averages conceal significant variation across countries: the child-to-teacher ratio ranges from 3:1 in Iceland to as high as 47:1 in OECD partner country Peru. These differences often reflect different organisational models. Some systems rely on a small number of teachers leading teams of auxiliary staff. In the United Kingdom, for example, teachers’ aides account for 91% of contact staff, resulting in a child-to-staff ratio of 3:1 despite a much higher child-to-teacher ratio of 32:1. Conversely, in countries like Lithuania, where the child-to-teacher ratio is a relatively low 8:1, teachers’ aides make up a smaller share of the workforce, at only 39% (Table D2.1).
Child-to-teacher ratios in early childhood educational development programmes are slightly higher in private institutions than in public ones overall across OECD countries, although the differences between the two sectors remain relatively small. On average across OECD countries, public institutions report a ratio of 9 children per teacher, compared to 11 children per teacher for private institutions. However, differences between public and private institutions vary widely at the national level. For instance, in the United Kingdom, the ratio in public settings is 25:1 compared to 33:1 in private ones, while in Chile, public institutions maintain a very low ratio of 2:1 against 8:1 in the private sector. Conversely, in Peru the trend is sharply reversed, with public institutions reporting 72 children per teacher compared to 13 in private settings. These variations often reflect distinct national approaches to ECE organisation. For instance, public provision may be subject to stricter minimum staffing regulations, while the private sector often operates under different funding models or workforce requirements (Table D2.1).
In pre-primary education (ISCED 02), which typically serves children from age 3 until they start primary school, staffing ratios are generally higher than in early childhood educational development, reflecting the transition toward more formalised pedagogical approaches. On average across OECD countries, the child-to-teacher ratio in pre-primary education is 13:1, while the ratio of children to all contact staff is 9:1. Cross-country differences remain substantial, with child-to-teacher ratios ranging from 5:1 in Iceland to 22:1 in France and 33:1 in the United Kingdom. Teachers’ aides in pre-primary education make up an average of 37% of contact staff, which is lower than the 49% in ISCED 01 programmes on average across OECD countries. This reduced reliance on auxiliary staff at the pre-primary level may reflect the fact that older children generally require less intensive care and supervision than younger children (Table D2.1).
Differences in staffing patterns between public and private institutions tend to be smaller at pre-primary level than in early childhood educational development provision. On average across OECD countries, the child-to-teacher ratio is the same for both public and private institutions, at 13:1. This may reflect the more formalised nature of pre-primary education, where regulatory frameworks and staffing requirements tend to be more comparable across sectors. Nevertheless, significant disparities persist at the national level. In Colombia, public institutions report 29 children per teacher compared to just 11 in the private sector, whereas in France, the trend is reversed with public settings maintaining a lower ratio (21:1) than private ones (27:1) (Table D2.1). These differences may reflect different national policy priorities and the degree to which private institutions receive public funding or are integrated into the formal school system. Unlike early childhood educational development, pre-primary systems are often more closely aligned with primary school structures, which can lead to more standardised staffing formulas in the public sector, while some private providers may use lower ratios as a specific pedagogical or market-based choice.
Trends in child-to-teacher ratios
The allocation of human resources to pre-primary education has seen notable changes over the past decade, with the child-to-teacher ratio falling by 14% across the OECD between 2015 and 2024 (Figure D2.1). This downward trend reflects the fact that the teaching workforce has grown while student enrolment has fallen slightly. Specifically, the number of teachers increased by 14% on average, while the number of children enrolled fell by 2%. In several OECD countries, declining birth rates and broader demographic changes have contributed to lower enrolment pressures, creating opportunities to reduce child-to-teacher ratios despite ongoing challenges related to teacher shortages and workforce ageing (OECD, 2024[4]). In some countries, the number of teachers in pre-primary education has grown substantially faster than the number of children enrolled, contributing to marked declines in child-to-teacher ratios. In Croatia, national reforms aimed at expanding access to early childhood education and facilitating the recruitment of additional kindergarten staff (Euridyce, 2026[5]) meant the number of teachers increased by around 31% while enrolment only increased by 8%. Similarly, in Greece, the teaching workforce expanded by 52% as enrolment grew by 9% following the progressive extension of compulsory pre-primary education (EASNIE, 2026[6]).
However, the downward trend was not universal, as several countries experienced increasing child-to-teacher ratios during the same period. These increases occur when the number of students grows faster than the number of teachers, or when teacher numbers contract while enrolment remains stable or grows. In the United States, the ratio rose by 7% as the number of teachers fell by 11%, a decline that exceeded the 5% drop in student numbers (Figure D2.1).
Primary school teachers play a pivotal role in children’s cognitive, emotional and social development (Jowett et al., 2023[7]; Rucinski, Brown and Downer, 2018[8]). In most OECD countries, primary schools typically follow a generalist model, where a single teacher covers several subjects with the same group of students, allowing for sustained interactions and stronger relational continuity. This daily proximity enables teachers to respond more effectively to individual learning needs and foster a supportive classroom climate. Lower student-to-teacher ratios in primary education can enhance these interactions by giving teachers more time and flexibility to engage with each student (Werler and Tahirsylaj, 2020[9]).
On average across OECD countries, the ratio of students to teaching staff in primary education was 14:1 in 2024, a slight decrease from the 15:1 recorded in 2015. Despite this relative stability, there is considerable variation between countries, reflecting diverse national policy priorities and demographic contexts (OECD, 2024[4]). In 2024, student-teacher ratios ranged from fewer than 10 students per teacher in Greece (7:1), and Luxembourg (8:1) to as many as 22 in Colombia and Peru or 23 in Mexico. Most countries cluster between 11:1 and 16:1, suggesting a widespread policy aim to maintain staffing levels that support relational continuity and sensitive interactions during children’s foundational years of cognitive and emotional development (Figure D2.2).
Over the past decade, trends highlight significant shifts in human resource allocation across several systems. The most pronounced declines in student-teacher ratios occurred in Bulgaria, where the ratio fell from 18:1 to 10:1, and in Mexico from 27:1 to 23:1. These reductions typically reflect faster growth in the teaching workforce than in student enrolment. In contrast, a small number of countries experienced increasing ratios during this period. For example, in Lithuania, Peru and the United Kingdom, the ratio rose by 3 or more students per teacher. Such increases may reflect challenges in teacher recruitment or shifts in demographic trends that outpace growth in the teaching workforce (Figure D2.2).
1. Year of reference differs from 2024.
2. Year of reference differs from 2015.
3. The reform of the modular structure in adult education (Flemish Community), introduced in 2023-2024, changed the reporting methodology for student enrolments in adult education programmes, resulting in a break in the time series.
For data, see Table D2.2. The data for this figure can be accessed via https://stat.link/po9vrb.
The student-to-teacher ratio in primary education is particularly significant due to the generalist nature of the teaching model. Lower ratios allow more time and flexibility to respond to individual learning needs and foster a supportive classroom climate. Conversely, higher ratios – such as those observed in Brazil (22:1), India (27:1), Mexico (23:1) and South Africa (26:1) – may limit the opportunities for such individualised attention (Figure D2.2). Student-to-teacher ratios are therefore closely monitored as an indicator of the human resources allocated to education systems. However, reducing these ratios often requires substantial investment through increased teacher recruitment and salary expenditures, making it one of the costliest education policy options and raising broader questions about how resources can be allocated most effectively across competing educational priorities.
Staffing of lower and upper secondary education
Teachers in lower secondary education often act as a bridge between the generalist approach of primary education and the subject specialisation of upper secondary levels. They support students during early adolescence, a critical period for social and emotional development, while introducing more structured academic expectations. In some educational systems, lower secondary teachers are trained to teach multiple subjects and maintain continuous interactions with a consistent group of students, which can help strengthen teacher-student relationships and provide stability as students adapt to more complex school environments. Recent research has shown that such sustained interactions contribute positively to students’ social participation and sense of belonging (Schürer, van Ophuysen and Marticke, 2025[10]).
Upper secondary teachers, in contrast, are typically subject specialists who work with older students preparing for higher education or the labour market. Their instructional role is more academic or vocational, depending on the educational track, and their relationships with students tend to be more formal and content focused. Given the segmented nature of upper secondary education – where teachers often see many different student groups each day – opportunities for individualised support are more limited. In this context, student-teacher ratios can influence the capacity of teachers to provide personalised guidance and monitor learning effectively.
On average across OECD countries, the student-to-teacher ratio at lower secondary level is 13:1, a figure which has remained stable since 2015. However, there is significant cross-country variation in OECD and partner countries, ranging from 28:1 in South Africa and 31:1 in Mexico to 8:1 in Croatia, Greece and Norway. Notable changes in staffing intensity have occurred over the last decade, like in Bulgaria, where the ratio fell from 13:1 in 2015 to 9:1 in 2024. Some countries like the Slovak Republic experienced the opposite trend, with the ratio rising from 12:1 to 16:1 over the same period. Changes such as these typically reflect differences in the pace of growth of the teaching workforce relative to student enrolment (Table D2.2).
At upper secondary level, the student-to-teacher ratio is also 13:1 on average across OECD countries, but this masks different arrangements of teaching resources within national systems. Several OECD countries report a lower ratio at upper secondary level than at lower secondary; most strikingly in Mexico, where it falls significantly, from 31:1 in lower secondary to 22:1 in upper secondary. Conversely, in Finland, the ratio nearly doubles, from 9:1 in lower secondary to 17:1 in upper secondary (Table D2.2). This reflects Finland’s inclusion-oriented education model, where extensive support services, special-needs provision and individualised learning require higher staffing levels at lower secondary level. The Teaching and Learning International Survey (TALIS) 2024 found that over half of Finnish teachers work in schools with substantial special-needs populations, and collaborative support structures are widespread (OECD, 2025[11]).
Although average ratios at this level have also been almost stable between 2015 and 2024, individual OECD countries have faced different pressures. In Latvia, the student-to-teacher ratio in upper secondary education increased from 10:1 to 14:1, and in Lithuania and Poland, it rose by 2 students per teacher. In contrast, Chile saw a reduction in the ratio from 23:1 to 18:1 at upper secondary level, while in Türkiye the ratio fell by 3 students per teacher (Table D2.2).
Staffing of post-secondary education
Post-secondary non-tertiary
Post-secondary non-tertiary education often serves as a bridge between upper secondary and tertiary education or the labour market, resulting in a diversity of programme structures and staffing arrangements across countries. These programmes frequently combine theoretical instruction with vocational or work-based learning components, which can influence student-to-teacher ratios depending on the level of practical training and individual supervision required. The analysis of student-to-teacher ratios and their trends at post-secondary non-tertiary level should be interpreted with caution, as programmes at this level remain highly heterogeneous across countries and, in some cases, enrol only very small numbers of students. In countries such as Bulgaria, Colombia, Luxembourg and the Netherlands, post-secondary non-tertiary programmes are relatively limited in scope, which can lead to particularly volatile or atypical ratios. In contrast, this level of education is more developed in countries such as Germany, Greece, Hungary, New Zealand and Poland, where student-to-teacher ratios may provide a more stable picture of programme organisation (OECD, 2026[12]).
On average across OECD countries, the student-to-teacher ratio at this level was 18:1 in 2024, an increase from 17:1 in 2015. Poland reports one of the highest student-to-teacher ratios among OECD countries at 60:1 (Table D2.2). This comparatively high ratio may partly reflect the organisation of szkoła policealna programmes, which are largely vocationally oriented, frequently attended by adult learners and often delivered through flexible or part-time forms of provision (Eurydice, 2025[13]; Cedefop and Educational Research Institute, 2023[14]).
Tertiary
In tertiary education, the student-to-teacher ratio provides a measure of the academic resources available to students in increasingly diverse and complex learning environments. The ratios are shaped by a broad spectrum of tertiary teaching models, with research-intensive and laboratory-based instruction typically requiring lower ratios than large-scale undergraduate lectures (OECD, 2025[15]). On average across OECD countries, the ratio stands at 15:1, a similar level as in 2015 at 16:1. This average, however, masks considerable variation across systems; Luxembourg reports the lowest ratio at 4:1, while Greece is an outlier with a ratio of 54:1. High staffing ratios are also prominent in partner countries such as Brazil (29:1) and Peru (28:1). Between 2015 and 2024 there have been some notable shifts: Brazil experienced an increase in its ratio from 23:1 to 29:1, whereas Lithuania saw its ratio fall from 16:1 to 11:1, reflecting more effective expansion of the teaching workforce relative to student enrolment (Table D2.2).
Class sizes
While student-to-teacher ratios provide a system-level measure the overall teaching resources available, class sizes are a more direct measure of students’ day-to-day learning environment and their interactions within the classroom. Class sizes continue to be a key concern for schools, education authorities and policymakers and can influence school choice among parents. Smaller classes are generally perceived as enabling teachers to provide more individualised attention, reduce the time they spend on classroom management and align their instruction better to students’ learning needs. Although the overall evidence on the direct impact of class size on student performance remains mixed (OECD, 2016[16]), many systems continue to prioritise it as a policy lever to support teaching and learning, particularly for disadvantaged students, with evidence suggesting that smaller classes may provide more targeted support for students in disadvantaged contexts (Charpentier, 2026[17]).
In response to these concerns, countries have implemented a range of policies aimed at addressing class sizes, especially in contexts of educational disadvantage. In France, class sizes have been reduced in early primary education in schools located in priority education areas, as part of a broader effort to address educational inequality (Blouet, Charpentier and Odin-Steiner, 2020[18]). Ireland has adopted similar measures through its Delivering Equality of Opportunity in Schools (DEIS) programme, which includes lower staffing ratios in schools serving disadvantaged communities (Government of Ireland, 2020[19]). These strategies reflect a shared policy rationale that smaller classes may help improve learning conditions and support equity.
Over the past decade, many education systems have been influenced by two concurrent trends: a decline in the school-age population and increasing concerns about teacher shortages (see Chapter 1, Teacher shortages and the attractiveness of the teaching profession). Although these dynamics may seem to offset each other – fewer students could imply reduced pressure on staffing needs – the relationship is more complex. In many countries, declining student numbers have coincided with the ageing of the teaching workforce, creating significant replacement needs despite lower enrolment. Combined with difficulties in recruiting and retaining qualified teachers, particularly in rural areas and in specific subject areas, and in some cases a tight labour market that increases competition for qualified workers, this has limited the extent to which demographic change has translated into lower staffing requirements (see Box 2 and Table 7 of Chapter 1). As a result, average class sizes have generally remained stable and, in some contexts, have even increased despite declining enrolment.
On average across OECD countries, the average class size at the primary level remained remarkably stable between 2015 and 2024, at 21 students per class for all institutions. This overall stability extends to both public and private sectors, with public institutions averaging 21 students per class and private institutions averaging 20 students over the period. However, this aggregate stability masks significant cross-country differences and contrasting national trends. While many education systems maintained relatively stable average class sizes, notable reductions were observed in Brazil, France and Denmark. Across public and private institutions combined, average class sizes decreased from 23 to 20 students in Brazil, from 24 to 21 students in France, and from 22 to 19 students in Denmark. Conversely, Lithuania and Mexico experienced increases, with Lithuania’s average rising from 16 to 19 students per class and Mexico’s from 22 to 23 (Table D2.3).
The trends for both public and private institutions combined largely reflect changes in the public sector, which accounts for the vast majority of primary enrolment in most OECD countries. In Brazil, for instance, the overall decline in class size was primarily driven by the public sector, where the average fell from 24 to 21 students. In Lithuania, the increase in the national average was almost entirely a result of public sector trends, where class sizes rose from 16 to 19, while the private sector remained relatively stable (Table D2.3).
In some countries, private sector trends diverged significantly from the public sector. In Latvia, the overall average class size rose, from 16 to 18 students per class, while private institutions experienced a substantial increase from 9 to 12. A similar divergence was observed in the United Kingdom, where the average class size in private primary schools rose from 23 to 25, even as those for public institutions remained stable at 27 (Table D2.3).
Across OECD countries, average class sizes increase as students progress from primary to lower secondary education, from 21 to 23 students per class. This upward trend is observed in the majority of countries, with the most pronounced increase in Costa Rica and Thailand, where the average class size grows respectively by 16 and 13 students between the two levels. However, this pattern is not universal; in Australia, Hungary and the United Kingdom, the average number of students per class actually falls as students move into lower secondary education (Table D2.3).
There is significant variation across countries, particularly at the lower secondary level where average class sizes range from 18 students in Croatia, Latvia and Poland to 31 in Chile, 32 in Japan and 36 in Thailand. On average across OECD countries, the average class size in lower secondary education remained stable at 23 students per class between 2015 and 2024. This aggregate stability masks significant cross-country differences, with Korea experiencing a reduction from 30 to 26 students, as well as the United States with a decrease from 27 to 21 students, while the United Kingdom saw a striking increase from 19 to 24 students per class (Table D2.3).
As is the case at primary level, national trends in class sizes are predominantly shaped by the public sector, which accounts for the largest share of lower secondary enrolment. In Korea and Mexico, the overall reduction in class size was mirrored in both public and private institutions, suggesting system-wide impacts of policy reforms or demographic shifts. Similarly, in the United Kingdom, national increases were driven by both sectors, with classes in public institutions increasing from 20 to 25 students and those in private institutions from 18 to 23. However, in some contexts, the private sector exhibited divergent patterns. In Latvia, while public class sizes rose moderately from 15 to 17, the private sector saw a sharp increase from 12 to 20 students per class. Such variations suggest that while public policy often sets the broad trend, private institutions may respond independently to different funding models or pedagogical priorities (Table D2.3).
Class sizes and student-teacher ratios
In lower secondary education, student-teacher ratios and average class sizes provide complementary insights into the allocation of teaching resources. While student-teacher ratios measure the total number of teachers relative to the student population, class sizes capture how students are actually grouped for instruction. Figure D2.3 illustrates a moderate positive correlation between these two indicators, suggesting that systems with more students per teacher often also employ larger class groupings. However, the relationship is not uniform because class size also depends on how teaching time and instruction time are organised. For example, a system may combine relatively high student-to-teacher ratios with smaller classes if teachers spend more time teaching or if students receive fewer instruction hours. Conversely, lower ratios do not necessarily translate into small classes when teachers have reduced teaching loads, when instruction time is extensive, or when additional staff are used for specialised support rather than regular classroom teaching. National policy choices regarding teacher working time, student instruction hours, and the use of teaching assistants or specialist teachers therefore shape the extent to which student-to-teacher ratios translate into actual class sizes.
The variation across countries is substantial, reflecting different ways of organising teaching resources and classroom instruction. Japan and the United States report broadly similar student-teacher ratios in lower secondary education with 12:1 and 14:1 respectively (Table D2.2), but average class sizes differ markedly, reaching 32 students per class in Japan compared to 21 in the United States (Table D2.3). Data show that these differences may be linked to how teachers’ working time is organised (see Chapter D4, Table D4.1). Across OECD countries, teachers spend around half of their working time on non-teaching activities, including lesson preparation, marking, administrative work and collaboration with colleagues. Japan is characterised by particularly long overall working hours and a high workload outside classroom teaching, with teachers spending considerable time on planning, school activities and administrative responsibilities (OECD, 2025[20]). At the same time, Japan has been promoting smaller class sizes and implementing reforms to reduce teachers’ non-teaching duties, highlighting that the allocation of staff resources depends not only on class size but also on policy choices regarding teachers’ responsibilities.
A contrasting pattern emerges in Korea and Mexico, where average class sizes are relatively similar (26 and 25 students respectively), but student-teacher ratios differ sharply. Mexico reports the highest student-teacher ratio in the OECD at 31:1, compared to 14:1 in Korea (Figure D2.3). Evidence indicates that Korean teachers spend comparatively fewer hours on direct classroom teaching but more time on administrative tasks, lesson preparation and student support activities (see Chapter D4, Table D4.1). This suggests that Korea employs more teachers relative to the student population not necessarily to reduce class sizes, but to support a broader range of instructional and non-instructional responsibilities. These contrasts underline how class size and student-teacher ratios capture different dimensions of educational resources and should therefore be interpreted jointly.
At the opposite end of the scale, several European countries prioritise high staffing intensity through both small classes and low student-teacher ratios. Croatia, Latvia and Poland combine some of the smallest average class sizes in the OECD (18 students per class) with low student-to-teacher ratios ranging from 8:1 to 10:1. In contrast, France and the United Kingdom maintain larger classes (26 and 24 students respectively) alongside above-average student-to-teacher ratios (15:1 and 17:1) (Figure D2.3).

1. Year of reference for student-teacher ratio differs from 2024.
2. Year of reference for class size differs from 2024.
3. Data come from the OECD Teaching and Learning International Survey (TALIS).
4. Public institutions only.
For data, see Table D2.2 and Table D2.3. The data for this figure can be accessed via https://stat.link/po9vrb..
Class size is defined as the number of students who are following a common course of study, based on the highest number of common courses (usually compulsory studies), and excluding teaching in subgroups.
Early childhood education (ECE): ECEC services in adherence with the criteria defined in the ISCED 2011 classification (see ISCED 01 and 02 definitions) are considered early childhood education programmes and are therefore referred to as ECE in this chapter. Therefore, the term ECE excludes programmes that do not meet the ISCED 2011 criteria.
Teachers’ aides and teaching research assistants include personnel or students who support teachers in providing instruction to students.
Teaching staff refers to personnel directly involved in teaching to students. The classification includes classroom teachers, special-education teachers and other teachers who work with a whole class of students in a classroom, in small groups in a resource room, or in one-to-one teaching situations inside or outside a regular class.
The ratio of students to teaching staff is obtained by dividing the number of full-time equivalent (FTE) students at a given level of education by the number of FTE teachers at that level and in similar types of institutions. Exceptionally, for early childhood educational development (ISCED 01) and pre-primary education (ISCED 02), this ratio is based on headcounts of children and FTE teachers due to the complexities arising from the lack of standardised study load criteria, variability in full-time enrolment hours, and the absence of a universally accepted FTE calculation methodology for students at this level.
For the ratio of students to teachers to be meaningful, consistent coverage of personnel and enrolment data are needed. For instance, if teachers in religious schools are not reported in the personnel data, then students in those schools must also be excluded.
Class size is calculated by dividing the number of students enrolled by the number of classes. In order to ensure comparability among countries, special needs programmes are excluded. Data include only regular programmes at primary and lower secondary levels of education and exclude teaching in subgroups outside the regular classroom setting.
Data refer to the reference year 2024 (school year 2023/24) and are based on the UNESCO-UIS/OECD/Eurostat data collection on education statistics administered by the OECD in 2025/26. For more information see Education at a Glance 2026 Sources, Methodologies and Technical Notes, (https://doi.org/10.1787/dcf64a14-en).
The UNESCO Institute of Statistics (UIS) provided some data for Argentina, the People’s Republic of China, India, Indonesia, Saudi Arabia, South Africa and Thailand.
References
[18] Blouet, L., A. Charpentier and D. Odin-Steiner (2020), “Dédoublement des classes de CP en éducation prioritaire : exploitation des enquêtes auprès des enseignants après deux années de déploiement”, Note D’Information, No. 20.15, DEPP, https://archives-statistiques-depp.education.gouv.fr/Default/doc/SYRACUSE/45798/dedoublement-des-classes-de-cp-en-education-prioritaire-exploitation-des-enquetes-aupres-des-enseign.
[14] Cedefop and Educational Research Institute (2023), VET in Europe database – Poland: system description, https://www.cedefop.europa.eu/en/tools/vet-in-europe/systems/poland-u3.
[17] Charpentier, A. (2026), “Réduction de la taille de classe en éducation prioritaire: Que nous apprennent les données de la DEPP?”, Synthèse de la DEPP, No. 8, DEPP, https://www.education.gouv.fr/sites/default/files/document/r-duction-de-la-taille-de-classe-en-ducation-prioritaire-que-nous-apprennent-les-donn-es-de-la-depp--478949.pdf.
[3] COFACE Families Europe (2023), “High-quality early childhood education and care: Low children-to-staff ratio as a primary driver for children’s well-being and families’ engagement”, COFACE Thematic Note, COFACE Families Europe, https://coface-eu.org/thematic-note-on-high-quality-early-childhood-education-and-care/.
[6] EASNIE (2026), Country information for Greece - Legislation and policy, European Agency for Special Needs and Inclusive Education, https://www.european-agency.org/country-information/greece/legislation-and-policy.
[5] Euridyce (2026), Croatia - National reforms in early childhood education and care, European Commission, https://eurydice.eacea.ec.europa.eu/eurypedia/croatia/national-reforms-early-childhood-education-and-care.
[13] Eurydice (2025), Poland - Organisation of post-secondary non-tertiary education, European Commission, https://eurydice.eacea.ec.europa.eu/eurypedia/poland/organisation-post-secondary-non-tertiary-education.
[19] Government of Ireland (2020), DEIS Delivering Equality of Opportunity in Schools, Department of Education and Youth, https://www.gov.ie/en/department-of-education/policy-information/deis-delivering-equality-of-opportunity-in-schools/.
[7] Jowett, S. et al. (2023), “Teacher–student relationship quality as a barometer of teaching and learning effectiveness: Conceptualization and measurement”, British Journal of Educational Psychology, Vol. 93/3, pp. 842-861, https://doi.org/10.1111/bjep.12600.
[12] OECD (2026), OECD Data Explorer - Ratio of students to teaching staff by type of institution, OECD.
[15] OECD (2025), Education at a Glance 2025: OECD Indicators, OECD Publishing, Paris, https://doi.org/10.1787/1c0d9c79-en.
[2] OECD (2025), Reducing Inequalities by Investing in Early Childhood Education and Care, Starting Strong, OECD Publishing, Paris, https://doi.org/10.1787/b78f8b25-en.
[11] OECD (2025), “Results from TALIS 2024: Finland”, Country Note, OECD, https://www.oecd.org/en/publications/results-from-talis-2024-country-notes_e127f9e2-en/finland_ab17fae3-en.html (accessed on 15 May 2026).
[20] OECD (2025), “Results from TALIS 2024: Japan”, Country Note, OECD, https://www.oecd.org/en/publications/results-from-talis-2024-country-notes_e127f9e2-en/japan_b48b1dd7-en.html.
[1] OECD (2024), Education at a Glance 2024: OECD Indicators, OECD Publishing, Paris, https://doi.org/10.1787/c00cad36-en.
[4] OECD (2024), “How are demographic changes affecting education systems?”, Education Indicators in Focus, No. 87, OECD Publishing, Paris, https://doi.org/10.1787/158d4c5c-en.
[16] OECD (2016), PISA 2015 Results (Volume II): Policies and Practices for Successful Schools, PISA, OECD Publishing, Paris, https://doi.org/10.1787/9789264267510-en.
[8] Rucinski, C., J. Brown and J. Downer (2018), “Teacher–child relationships, classroom climate, and children’s social-emotional and academic development.”, Journal of Educational Psychology, Vol. 110/7, pp. 992-1004, https://doi.org/10.1037/edu0000240.
[10] Schürer, S., S. van Ophuysen and S. Marticke (2025), “Social participation in secondary school: The relation to teacher-student interaction, student characteristics and class-related variables”, Social Psychology of Education, Vol. 28/1, https://doi.org/10.1007/s11218-024-09992-2.
[9] Werler, T. and A. Tahirsylaj (2020), “Differences in teacher education programmes and their outcomes across Didaktik and curriculum traditions”, European Journal of Teacher Education, Vol. 45/2, pp. 154-172, https://doi.org/10.1080/02619768.2020.1827388.
The data for the figures and tables in this chapter can be downloaded via https://stat.link/po9vrb.
To access further data and/or other education indicators, please visit the OECD Data Explorer: http://data-explorer.oecd.org/s/4s.
Data cut-off for the print publication 17 June 2026. Please note that the Data Explorer contains the most recent data.
a – category not applicable; b – break in series; d – contains data from another column; m – missing data; x – contained in another column (indicated in brackets). For further control codes, see the Reader’s Guide.
For further methodological information, see Education at a Glance 2026: Sources, Methodologies and Technical Notes, (https://doi.org/10.1787/dcf64a14-en).
1. Year of reference differs from 2015: 2016 for Bulgaria, Colombia, France and Greece; 2017 for Indonesia, Latvia and the United Kingdom; and 2018 for Denmark and Ireland.
The data for this table can be accessed via https://stat.link/po9vrb.
1. The reform of the modular structure in adult education (Flemish Community), introduced in 2023-2024, changed the reporting methodology for student enrolments in adult education programmes, resulting in a break in the time series.
2. Year of reference differs from 2015: 2016 for Bulgaria, Colombia, France, Indonesia and Thailand; and 2017 for Mexico and the United Kingdom.
3. Includes only public institutions.
4. Year of reference differs from 2024: 2023 for India, Indonesia and South Africa.
The data for this table can be accessed via https://stat.link/po9vrb.
Calculations based on number of students and number of classes
1. Year of reference differs from 2015: 2016 for Bulgaria and Croatia; and 2018 for Belgium.
2. Data come from the OECD Teaching and Learning International Survey (TALIS). In TALIS, class size refers to the number of students enrolled in a specific “target class” reported by teachers.
3. Only public institutions included.
The data for this table can be accessed via https://stat.link/po9vrb.