In most OECD countries, the statutory salaries of teachers increase with the level of education they teach. On average across OECD countries and economies, the salaries of teachers with the most prevalent qualifications with 15 years of experience range from USD 60 437 at pre-primary level to USD 68 928 at upper secondary level.
Between 2015 and 2025, statutory salaries for both starting teachers and for teachers with 15 years of experience increased in most countries, and usually at a faster rate for starting salaries. On average across OECD countries and economies with comparable data from 2015 to 2025 for primary and secondary teachers with the most prevalent qualification, salaries for those with 15 years of experience increased by 6-7% while starting salaries increased by 18-20% over the same period.
On average, teachers’ actual salaries at primary and general secondary levels of education are 87-95% of the average earnings of tertiary-educated workers across OECD countries. School heads’ actual salaries are usually higher than those of tertiary-educated workers.
Education at a Glance 2026

Context
Pay and working conditions are important factors for attracting, developing and retaining skilled and high-quality teachers (see Chapter 1, Teacher shortages and the attractiveness of the teaching profession). Teachers’ salaries, in absolute terms and relative to those of other professions, can have a direct impact on the attractiveness of teaching as a career, although other aspects can also be influential, such as opportunities for professional development, administrative workloads and how teachers are perceived (OECD, 2023[1])). They can influence individuals’ decisions on whether to enrol in teacher education, to become a teacher (Nagler, Piopiunik and West, 2020[2]) and to remain in teaching (Qin, 2020[3]). In general, the higher teachers’ relative salaries are, the more attractive the profession, and they are a key indicator in the Sustainable Development Goal 4 Indicators (SDG4) monitoring framework (Indicator 4.c.5) (see SDG 4 Dashboard,https://www.oecd.org/en/data/dashboards/monitoring-sdg-4.html). Salaries and career prospects can also have an impact on the decision to become and remain a school head (see Box D3.2 in Education at a Glance 2025 (OECD, 2025[4])). Relatively low salaries for school heads may discourage teachers from taking on the role (Pont, Nusche and Moorman, 2008[5]).
The salaries of school staff, particularly teachers and school heads, represent the largest single cost in formal education (Part C). Although competitive salaries are a factor in improved learning outcomes of students (OECD, 2020[6]), they are not the only factor. As such, it is important for policy makers to carefully consider the salaries and career prospects of teachers and school heads to ensure both high-quality education systems and sustainable education budgets.
Ratio of salaries to the earnings of full-time, full-year workers aged 25-64

Note: Data refer to the ratio of annual average salaries (including bonuses and allowances) of teachers and school heads in public institutions relative to the earnings of workers with similar educational attainment (weighted average) and to the earnings of full-time, full-year workers with tertiary education. Earnings of workers with similar educational attainment to teachers are weighted by the distribution of teachers (or school heads) by qualification level (see Tables X2.10 and X2.11). As values close to one may be difficult to identify in the figure, please refer to the source table.
1. Data on earnings for full-time, full-year workers with tertiary education refer to the whole country.
2. Year of reference for salaries of teachers differs from 2025.
For data, see Table D3.2. The data for this figure can be accessed via https://stat.link/z15uv3.
Other findings
Teachers’ salaries can range quite widely within countries, as different qualification levels can be associated with different salary scales. For lower secondary teachers, the average salary for teachers at the top of the scale and with the maximum qualifications is 75% higher than the average starting salary for those with the minimum qualifications.
School heads’ statutory salaries vary to a similar extent to teachers’ salaries: at the primary and secondary levels maximum salaries are 70-75% higher than minimum salaries. However, school heads’ actual salaries are more than 50% higher on average than those of teachers across these levels in OECD countries.
Actual salaries for teachers increased by 17% in real value between 2015 and 2025 for primary and secondary levels. In countries where salaries fell in real terms, this was mainly due to inflation as nominal salaries still increased.
Teachers’ relative salaries (actual salaries as a percentage of the earnings of tertiary-educated workers) fell very slightly (by 1 percentage point) between 2015 and 2023 at primary and secondary levels, but this masks significant variation across countries resulting from differences in the growth rates of teachers’ salaries and tertiary-educated workers’ earnings.
Financial compensation for participating in mentoring programmes or supporting new teachers is paid in around half of all countries, but the decision to take up a mentoring role can rely on more than financial considerations. Intrinsic motivations might also play role, such as the value of collaboration or taking more of a leadership role.
Note
Statutory salaries are just one component of teachers’ and school heads’ total compensation. Other benefits, such as regional allowances for teaching in remote areas, family allowances, reduced rates on public transport and tax allowances on the purchase of instructional materials may also form part of their total remuneration. In addition, there are large differences in taxation and social benefits systems across OECD countries. There can also be substantial variation in the salary scales of teachers and school heads at subnational level in some countries, based on local factors such as the cost of living (Box D3.1). This should be kept in mind when analysing teachers’ salaries and making cross-country comparisons, along with potential comparability issues related to the data collected – see Box D3.1 of Education at a Glance 2019 (OECD, 2019[7]), Box D3.2 of Education at a Glance 2023 (OECD, 2023[8]) and Education at a Glance 2026 Sources, Methodologies and Technical Notes (https://doi.org/10.1787/dcf64a14-en) – and the fact that the data collected only cover public educational institutions.
All figures expressed in USD are converted from national currencies based on exchange rates that are adjusted for differences in purchasing power across countries (see Methodology section).
Teachers’ salaries
Teachers’ salaries can vary according to a number of factors, including their qualification levels, the level of education taught, and how much experience they have and what stage of their career they are in. They can also vary within countries if statutory salaries and compensation structures are defined at the subnational level (Box D3.1).
Statutory salaries
Teachers may enter the teaching profession with the minimum qualification or a higher qualification which may be associated with a higher salary. In about two-fifths of OECD countries and economies, teachers with the most prevalent qualification (to enter the teaching profession) have the same salary range as those with the minimum qualification required to become a teacher. In countries with different salary ranges for different qualification levels, very few teachers may hold the minimum or maximum qualifications (Annex 2, Table X2.9). For this reason, the comparative analysis on statutory salaries focuses on teachers who hold the most prevalent qualifications. However, data on teachers’ statutory salaries are collected for three qualification levels (minimum, most prevalent and maximum), available in the OECD Data Explorer. Data on teachers’ salaries at secondary level are collected only for teachers in general programmes although, exceptionally, the data for upper secondary teachers in vocational programmes were analysed in Box D3.3 in Education at a Glance 2023 (OECD, 2023[8]).
For a given level of qualification, teachers’ salaries vary according to years of experience. The OECD data collection on teachers’ salaries gathers information on statutory salaries at four points on the salary scale: starting salaries, salaries after 10 years of experience, salaries after 15 years of experience and salaries at the top of the scale. The analysis usually concentrates on the salaries of teachers with 15 years of experience as a proxy for mid-career teachers.
Teachers’ statutory salaries vary widely across countries. The salaries of lower secondary teachers with the most prevalent qualifications after 15 years of experience range from less than USD 30 000 in Argentina and the Slovak Republic to more than USD 100 000 in Germany, Luxembourg and the Netherlands (Table D3.1).
Typically, teachers’ salaries increase with the level of education they teach. On average across OECD countries and economies, the salaries of teachers (with the most prevalent qualifications after 15 years of experience) range from USD 60 437 at pre-primary level to USD 64 349 at primary level, USD 66 583 at lower secondary level and USD 68 928 at upper secondary level (Table D3.1).
Salary differences between levels of education vary across countries. Notably, upper secondary teachers in Finland (with the most prevalent qualifications after 15 years of experience) earn 42% more than pre-primary teachers, and in Mexico, they earn 68% more. In Finland, these higher salaries at upper secondary level can be explained by the fact that upper secondary teachers need higher qualifications than pre-primary teachers (for information on the most prevalent qualification see Table D.D3.3 in Education at a Glance 2026 Sources, Methodologies and Technical Notes (https://doi.org/10.1787/dcf64a14-en). In Mexico, the difference is mainly driven by the fact that teachers at upper secondary level have a different salary structure to those at other levels. In contrast, teachers in about one-quarter of OECD countries and economies with available data earn the same salary irrespective of the level of education taught (Table D3.1).
Teachers’ salaries usually increase with each year of experience. On average, it takes about 21 years for lower secondary teachers (with the most prevalent qualification to enter the profession in 2025) to progress from the starting level to the top of the salary scale. In Canada, Colombia, New Zealand and Scotland (United Kingdom), salary scales are compressed to at most 10 years from starting to top of scale salaries (that is, faster salary progression over a few years), while others have more extended salary scales which give teachers more incentive to serve for longer. These different approaches mean teachers’ salaries increase at different rates in different countries. For example, for lower secondary teachers in both Ireland and the Netherlands, statutory salaries at the top of the salary scale are about double the starting salaries (for those with the most prevalent qualification to enter the profession in 2025) but it will take a teacher in Ireland on average 35 years to reach the top of the scale, compared to only 12 years for their counterpart in the Netherlands (OECD Data Explorer (OECD, 2026[9]) and Figure D3.6).
Annual salaries of teachers in public institutions, in equivalent USD converted using PPPs for private consumption
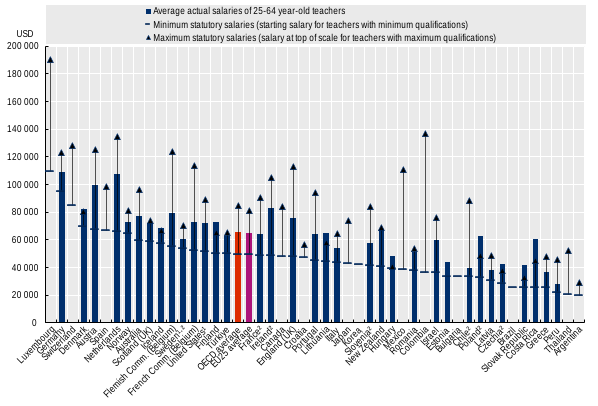
Note: Actual salaries include bonuses and allowances.
1. Minimum and maximum salaries refer to actual salaries instead of statutory salaries.
2. Year of reference for actual salaries differs from 2025.
For data, see Table D3.3 and OECD Data Explorer. The data for this figure can be accessed via https://stat.link/z15uv3.
Looking at the full range of statutory salaries (where the minimum is the starting salary for teachers with the minimum qualifications and the maximum is the salary at the top of the scale for teachers with the maximum qualifications), on average the maximum teacher’s salary in lower secondary education is 75% higher than the minimum across countries and economies. However, the difference varies greatly across countries, from about 4% more in Hungary to nearly four-fold in Colombia (Figure D3.2). Maximum salaries are at least double minimum salaries in 13 other countries and economies. These differences may signal differences in salary structures. For instance, Hungary has only one salary range irrespective of teachers’ qualifications (but with some differentiation between teachers with a bachelor or a master qualification), while Colombia has different salary ranges for teachers with different qualification levels.
In most countries and economies where minimum salaries are below the OECD average, the maximum salaries are also below the OECD average. At lower secondary level, a notable exception is Colombia, where minimum salaries are 27% lower than the OECD average, but maximum salaries are 61% higher. These differences may reflect the different career paths available to teachers with different qualifications (Figure D3.2).
The difference between maximum salaries (which may only apply to a very small proportion of teachers) and the salaries of teachers with the most prevalent qualifications and 15 years of experience, also varies across countries. At lower secondary level, the gap between these two groups is less than 10% in nine countries and economies (Canada, Denmark, Finland, Germany, Hungary, New Zealand, Poland, Romania and Scotland [United Kingdom]) while it exceeds 60% in five others (Chile, Colombia, France, Mexico and Portugal) (Figure D3.2 and Table D3.1).
Teachers’ statutory salaries can vary significantly within countries, especially in federal countries where salaries may be defined at the subnational level. Differences in statutory or actual salaries can result, at least partly, from differences in the cost of living between subnational entities. Data provided by four OECD countries (Belgium, Canada, the United Kingdom and the United States) illustrate these variations at the subnational level.
The size of subnational differences in statutory salaries varies across these four countries (depending on the level of education and the stage teachers have reached in their careers) which may be related to the large difference in the size of these countries. In 2025, the starting salaries for primary teachers differed by about 6% (USD 2 949) in Belgium, from USD 52 227 per year in the French Community to USD 55 176 in the Flemish Community. The largest differences were in Canada and the United States: starting salaries for primary school teachers varied in Canada by 51% (USD 25 031) across subnational entities (from USD 48 762 in Quebec to USD 73 793 in the Northwest Territories) and in the United States by 52% (USD 22 575), ranging from USD 43 669 in North Carolina to USD 66 244 in California. Starting salaries in secondary education also varied the least in Belgium (by 6%, from USD 52 227 in the French Community to USD 55 176 in the Flemish Community at lower secondary level) and the most in the United States (by 67% at lower secondary level, from USD 43 562 in North Carolina to USD 72 664 in New York) (OECD, 2026[9]).
Subnational differences in statutory salaries remain consistent across levels of education in Belgium, Canada (apart from at pre-primary level) and the United Kingdom, but differ for different stages of teachers' careers in Canada and the United Kingdom. In Belgium, the variation in statutory salaries between subnational entities ranges from 6% to 9%. In the United Kingdom, the variations are similar at different levels of education, but greater across subnational entities in starting salaries than in salaries at the top of the scale. For example, at lower secondary level, starting salaries in the United Kingdom vary by 27% (USD 12 677) between subnational entities (from USD 46 357 to USD 59 034), but the difference narrows to 16% (USD 11 849, from USD 71 887 to USD 83 736) at the top of the scale. In Canada, the variations are similar at primary and secondary levels but also differ between career stages. The difference between subnational entities reaches 51% (USD 25 031) for starting salaries and 54% (USD 36 944) for salaries after 10 years of experience, but then narrows to 40% (USD 29 989) for salaries after 15 years of experience and at the top of the salary scale. In the United States, there is no clear pattern in the size of the variation of statutory salaries across subnational entities at different stages of teachers’ careers and levels of education. At lower secondary level, the difference is the smallest for starting salaries and the widest for salaries after 15 years of experience, which range from USD 56 568 to USD 108 821 (a difference of 92%, or USD 52 253) rather than for salaries at the top of the scale. The differences in salaries after 15 years of experience across subnational entities are largest at primary level (a difference of 99%) and smallest at upper secondary level (a difference of 83%).
There are also large subnational variations in the actual salaries of teachers and school heads across the three countries with available data in 2025. In Belgium, subnational variation in actual salaries is less than 16% for all levels of education for both teachers and school heads, and greater for school heads than for teachers. For example, at upper secondary level, teachers’ salaries in Belgium range from USD 90 115 in the French Community to USD 95 233 in the Flemish Community, a difference of 6%, or USD 5 118. In comparison, school heads’ salaries range from USD 125 594 in the French Community to USD 144 487 in the Flemish Community, a difference of 15%, or USD 18 893. Subnational variations in actual salaries were slightly bigger for teachers at lower and upper secondary levels in the United Kingdom and at upper secondary for teachers and at primary level for school heads in the United States, where the average salaries of primary school heads ranged from USD 87 502 in West Virginia to USD 180 545 in New York, a difference of 106%, or USD 93 043.
The extent of the subnational differences in teachers’ and school heads’ actual salaries also varies according to level of education. In the United Kingdom, the subnational variation in school heads’ salaries is largest at pre-primary level, while for teachers the variation is greater at the secondary level. In the United States, subnational variation in the average actual salaries of school heads was greater at primary level than at lower and upper secondary levels.
Source: Education at a Glance Database, http://data-explorer.oecd.org/s/4s
Actual salaries
Teachers’ actual salaries include all work-related payments, such as the base salary (as defined in the statutory salary scale), results-related bonuses, extra pay for teaching overtime, holidays, allowance for performing certain tasks and other additional payments (see Definitions section). For example, Czechia has implemented a range of allowances, including additional payments for student counselling and payments for performing additional tasks upon completion of the relevant professional development activities, and these payments are at the discretion of the school head. In Switzerland, such allowances are less frequent or replaced by alternative benefits – training student teachers leads to a reduction in teaching time, for example. In 2025, the average actual salaries of teachers aged 25-64 were USD 56 334 at pre-primary level, USD 62 942 at primary level, USD 65 499 in general programmes at lower secondary level and USD 69 255 in general programmes at upper secondary level (Table D3.3).
Bonuses and allowances can be a significant addition to statutory salaries. At lower secondary level, 31 countries and economies have data available on both the statutory salaries of teachers with the most prevalent qualifications after 15 years of experience (a proxy for mid-career salaries) and the actual average salaries of 25-64 year-old teachers. In more than two-fifths of these countries, actual average salaries are at least 10% higher than statutory salaries, which may reflect the importance of bonuses and allowances in the compensation system for teachers in these countries. Actual salaries are over 25% higher than statutory salaries (after 15 years of experience) in Costa Rica (62%), Czechia (33%), Lithuania (26%), Poland (34%) and the Slovak Republic (43%) (Table D3.1 and Table D3.3).
Comparing teachers’ actual salaries to minimum and maximum statutory salaries also gives an indication of the distribution of teachers between the minimum and maximum salary levels. For example, at lower secondary level in Norway, the actual salaries of 25-64 year-old teachers are 13% higher than the minimum statutory salaries, which is the smallest difference among countries with available data on both measures for the same reference year (Figure D3.2). This may be due to the relatively small range of statutory salaries in the country (Table D3.1), combined with smaller additional allowances than in other countries. Meanwhile, actual salaries are higher than the statutory salary at the top of the scale in nine countries. The largest differences between these actual and statutory salaries among countries with comparable data are in Costa Rica and Poland, where actual salaries are at least 28% higher than the maximum statutory salaries, suggesting that allowances have a substantial effect on teachers’ take-home pay (Figure D3.2 and Table D3.8, available online).
Trends in statutory salaries
Nearly two-thirds of OECD countries have comparable data on the statutory salaries of teachers for both 2015 and 2025 for at least one level of education, based on teachers with the most prevalent qualifications after 15 years of experience. During this period, teachers’ statutory salaries increased in real terms (that is, in constant 2015 prices) in one-half to three-fifths of these countries depending on the level of education. On average across OECD countries and economies with comparable data, statutory salaries increased by about 7% at primary level, 6% at lower secondary level (general programmes) and 7% at upper secondary level (general programmes), rewarding those who had stayed in the teaching profession (Table D3.7, available online).
However, some countries saw much larger changes in statutory salaries over this period. At lower secondary level, they grew by more than 30% in real terms in Colombia, Lithuania and Poland. The nominal increases were even larger, but inflation has cancelled out some of the nominal wage gains over the period (OECD, 2022[10]). In contrast, in 12 countries and economies, real statutory salaries of lower secondary teachers have declined since 2015. The largest decrease was in Ireland where salaries fell by almost 13% in real terms although in nominal terms (that is, in current values and not considering inflation), salaries still increased between 2015 and 2025 (Annex 2 Table X2.6 and Table D3.7, available online).
Starting salaries also increased during the period 2015-25. On average across OECD countries and economies with comparable data over the period, starting statutory salaries rose in real terms by 20% at primary level and lower secondary level and by 18% at upper secondary (general programmes) level, making it more attractive to enter the profession (Table D3.6, available online). Again, these changes vary widely between countries. In three-quarters of OECD countries and economies, starting statutory salaries at the lower secondary level increased in real terms. However, in a few countries, they decreased significantly, including by 10% or more in Costa Rica, Italy and Portugal (Table D3.6, available online).
In most of the 29 countries with available data for the period 2015 to 2025 for both starting salaries and salaries after 15 years of experience of lower secondary teachers, salaries at both stages either increased or decreased. However, in England (United Kingdom), France, Germany, Ireland, Japan and the United States, starting salaries rose while those for teachers with 15 years of experiences decreased in real values. In these countries, none of the increases or decreases exceeded 13 percentage points, except in Japan, where starting salaries increased by 17 percentage points (Figure D3.3). These changes resulted from a combination of changes in nominal salaries and changes in the cost of living – in these countries, nominal salaries in current national currencies increased for teachers at both stages of their careers (Annex 2 Tables X2.5 and X2.6).
Change in teachers’ real statutory salaries (2015 = 100), in percentage points

Note: Change in teachers’ statutory salaries is based on the most prevalent qualifications after 15 years of experience. Salaries are converted to constant prices using deflators for private consumption.
1. Actual salaries for minimum and maximum statutory salaries.
For data, see Tables D3.6, D3.7 and D3.8 (available online). The data for this figure can be accessed via https://stat.link/z15uv3.
Even where salaries at both stages of teachers’ careers increased or decreased together over this period, the size of the change differed. In most of the 18 countries where salaries increased in real terms for both stages, the increase was larger for starting salaries, except in Czechia, New Zealand, Slovenia and the Republic of Türkiye, where teachers saw larger increases for salaries after 15 years of experience. In the five countries where salaries decreased in real terms for both stages, there is no clear trend as to which saw the greatest drop. In Finland and Italy, the change was the same for both stages (Figure D3.3). These differences may reflect changes in the compensation systems for teachers to attract or retain teachers in the profession (see Chapter 1).
Trends in actual salaries
Over the period 2015 to 2025, nearly half of OECD countries and economies have comparable time series data for actual salaries at primary and secondary levels of education (for pre-primary level only about one-third do). On average across OECD countries and economies with comparable data for all the reference years between 2015 and 2025, actual salaries increased in real terms by about 17% at primary and secondary levels. About two-thirds of these countries showed an increase over the period 2015 to 2025 (in real terms) for all levels of education. The increase exceeded 20% in Estonia, Iceland (at pre-primary, primary and lower secondary level), Israel (at upper secondary level), Latvia and the Slovak Republic, and actual salaries doubled in Lithuania. These differences may result from the combination of changes in the amounts of statutory salary or allowances that teachers received as well as changes in teachers’ characteristics (for example, more experienced teachers may earn higher salaries) (Table D3.8, available online).
In three OECD countries and economies (the French Community of Belgium, Germany and Italy) with comparable time series data, teachers’ actual salaries fell in real terms at all levels of education covered by the available data. There was a fall of at least 3% in Austria (at secondary levels), the Flemish and French Communities of Belgium (both at upper secondary level) and Italy (at all levels). As all of these countries showed increases in nominal terms, these falls were driven by the rate of inflation outstripping increases in actual salaries (Table D3.8, available online).
School heads’ salaries
Statutory salaries
School heads’ responsibilities may include educational activities (including teaching) as well as other administrative, staff management and financial responsibilities (see Chapter D4 in Education at a Glance 2022 (OECD, 2022[11]) for more details, including differences in the nature of the work carried out and the hours worked by school heads compared to teachers). Some countries have specific salary scales for heads, who may or may not receive a school-head allowance on top of their statutory salaries. In other countries, heads may be paid according to teachers’ salary scales, with an additional school-head allowance. The use of teachers’ salary scales may reflect the fact that school heads may be teachers who have taken on management responsibilities of a school, possibly accompanied by a reduction in their teaching responsibilities (see Box D3.2 in Education at a Glance 2025 (OECD, 2025[4])). In 14 out of the 37 countries and economies with data available, lower secondary school heads are paid according to teachers’ salary scales with a school-head allowance, while they have a specific salary range in the other 23. Of these, 16 countries and economies have no specific school-head allowance while 7 include a school-head allowance in the salary (Table D3.14, available online).
The amounts payable to school heads (through statutory salaries and/or school-head allowances) may vary according to the characteristics of the school or schools they lead, such as the size of the school (based on the number of students or teachers). They could also vary according to the individual characteristics of the school heads themselves, such as the duties they have to perform or their years of experience (for the determinants of statutory salary and school-head allowance, see Table D.D3.5 in Education at a Glance 2026 Sources, Methodologies and Technical Notes (https://doi.org/10.1787/dcf64a14-en)).
Considering the large number of criteria involved in the calculation of their salaries, statutory salary data for school heads focus on those related to the minimum qualification requirements to become a school head, and Table D3.4 (available online) shows only the minimum and maximum salaries (the minimum qualification requirements can be found in Table D.D3.6 in Education at a Glance 2026 Sources, Methodologies and Technical Notes (https://doi.org/10.1787/dcf64a14-en)). Caution is therefore necessary when interpreting these values because minimum and maximum statutory salaries may refer to school heads in different types of schools and few school heads may earn these amounts in practice.
As with teachers, school heads’ salaries also vary widely across countries and levels of education. More than half of OECD countries and economies have similar pay ranges for primary and lower secondary school heads, while upper secondary school heads benefit from higher statutory salaries on average. The similar salaries at primary and lower secondary levels may result from the fact that school heads in many of these countries are in charge of schools providing both primary and lower secondary education (Table D3.4, available online).
At lower secondary level, the average minimum salary for school heads is USD 72 467 across OECD countries and economies, ranging from USD 25 774 in Costa Rica to USD 151 218 in Luxembourg. The maximum salary is USD 115 064 on average, ranging from USD 55 233 in Poland to USD 209 131 in Luxembourg (Figure D3.4).
On average across OECD countries and economies, the maximum statutory salary of a school head with the minimum qualifications is 70-75% higher than the minimum statutory salary at primary and secondary levels. In ten countries and economies school heads at the top of the scale can expect to earn at least twice the statutory minimum salary in at least one of these levels of education; in Colombia, Costa Rica and Thailand, they can expect to earn more than three times the minimum salary at all levels of education (Figure D3.4 and Table D3.4, available online).
Actual salaries
Across OECD countries and economies, average actual salaries for school heads (aged 25-64) ranged from USD 93 468 at primary level to USD 100 867 at lower secondary level and USD 107 309 at upper secondary level. School heads’ actual salaries are higher than those of teachers, and the premium (the difference in actual salaries between school heads and teachers in favour of school heads) increases with levels of education. On average across OECD countries and economies with data for both teachers and school heads, school heads’ actual salaries in 2025 were 51% higher than teachers’ at primary level, 55% higher at lower secondary level and 56% at upper secondary level (Table D3.3).
The premiums paid to school heads vary widely across countries and levels of education, however. At pre-primary level, the largest difference was in Slovenia, where school heads’ actual salaries are 80% higher than those of teachers. At the primary level, school heads’ actual salaries are three times teachers’ actual salaries in Italy. At lower and upper secondary levels, school heads’ actual salaries are about twice or more those of teachers in England (United Kingdom), Italy and Scotland (United Kingdom). The lowest premiums, of less than 30%, are in Estonia (primary and secondary), France (pre-primary and primary), Norway (pre-primary), Poland (lower secondary) and Türkiye (all levels) (Table D3.3). The reasons for these different salary structures are manifold. In France, the low premiums can be explained by the fact that pre-primary and primary school heads are teachers relieved from part of their teaching duties. Similarly, school heads in Poland are teachers with significantly reduced teaching loads. In both these countries, they are paid according to the teachers’ salary scale at this level of education, with the addition of a specific school-head allowance, accounting for additional managerial functions. In Norway, teachers’ actual salaries are similar across education levels with a difference of 21% between the lowest average actual salary (pre-primary level) and the largest (secondary levels). Meanwhile school heads’ salaries are lowest for the pre-primary level as well but gradually increase until they are 42% higher at the upper secondary level, leading to progressively increasing differences between school heads’ and teachers’ salaries.
As expected, school heads’ actual salaries are higher than minimum statutory salaries. This may partly result from the fact that actual salaries include additional payments to the statutory salaries, depending on their tasks and responsibilities. They are also usually lower than maximum statutory salaries. However, actual salaries are higher than maximum statutory salaries in a few countries, which might result from the existence of differences in salaries by qualification level of school heads. In the figure actual salaries refer to all school heads whereas minimum and maximum statutory salaries refer to school heads with the minimum qualification level (Figure D3.4).
Annual salaries of school heads in general programmes in public institutions, in equivalent USD converted using PPPs for private consumption
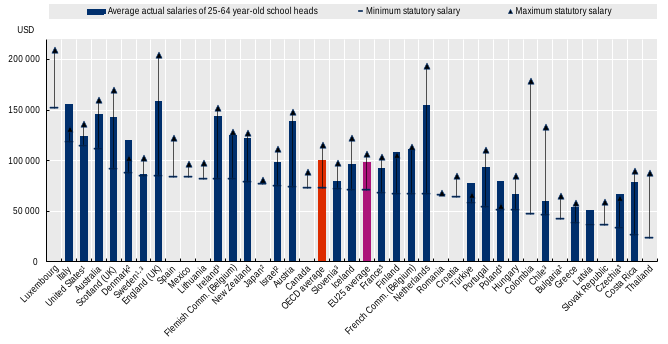
Note: Actual salaries include bonuses and allowances. Actual salaries of all school heads are compared to statutory salaries of school heads with minimum qualification.
1. Actual base salaries for statutory minimum and maximum salaries.
2. Data on statutory salaries exclude management allowances for school heads.
3. Year of reference for actual salaries differs from 2025.
For data, see Table D3.3
and Table D3.4, available online. The data for this figure can be accessed via https://stat.link/z15uv3.
Base salaries and additional payments: Incentives and allowances
Statutory salaries, based on pay scales, are only one component of the total compensation of teachers and school heads. School systems may also offer them additional payments, such as allowances, bonuses or other rewards. These may take the form of financial remuneration or reductions in the number of teaching hours. Decisions on the criteria used for the formation of the base salary and additional payments are taken at different levels of authority.
Criteria for additional payments vary across countries. In the large majority of countries and economies, teachers’ core tasks (teaching, planning or preparing lessons; marking students’ work; general administrative work; communicating with parents; supervising students; and working with colleagues) are rarely compensated through specific bonuses or additional payments. Teachers may also be required to take on other responsibilities or perform some tasks without additional compensation although doing so often entails some sort of financial incentive (see Chapter D4 for teachers’ tasks and responsibilities and associated financial or other incentives).
At lower secondary level, teachers who participate in school or other management activities in addition to their teaching duties receive extra financial compensation in nearly 60% of the countries and economies with available information. For example, in Korea, teachers serving as head teacher of a certain grade or dean of academic affairs receive regular additional payments. In contrast, in Switzerland teachers taking on school or other management duties are compensated with reduced teaching hours. It is also common for teachers to be awarded additional payments, either annual or occasional, for teaching more classes or hours than required by their full-time contract or performing special tasks such as training student teachers. Additional payments for participation in mentoring programmes and/or supporting new teachers in induction programmes is rewarded with a financial compensation in half of the countries with comparable data (see Box D3.2 and Table D3.10, available online).
Further allowances on outstanding performance or teaching in disadvantaged, remote or high-cost areas can also lead to additional compensation, either in the form of occasional additional or annual payments, or through increases in base salary. For example, in Chile teachers are placed in a higher salary scale if they teach in a school with a high proportion of vulnerable students. Outstanding performance can also lead to additional payments, for example in Poland where teachers can receive occasional payments based on in-class observations by a school head and student results (see Box D3.2 in Education at a Glance 2024 (OECD, 2024[12]) for more information on such allowances).
There are also criteria for additional payments for school heads, but fewer tasks or responsibilities lead to additional payments compared to teachers. Central or state governments or top-level authorities and local authorities are the two main authorities who decide the entitlement criteria and amounts of allowances for school heads across countries (Tables D3.11 and D3.13, available online).
Mentoring is an effective tool to increase teaching quality, reduce teacher attrition and help the transfer of knowledge from skilled teachers to novices. Several reasons may explain the benefits of developing mentoring schemes. Mentoring can convey practical teaching skills like classroom management better than initial teacher training, as experienced teachers are in a good position to support new teachers. Mentoring and induction programmes are also helpful to second-career teachers who tend to have shorter initial teacher training (OECD, 2025[13]).
Teachers might be either intrinsically or extrinsically motivated to play mentoring or induction roles. Teachers could be intrinsically motivated by the possibilities of supporting others, taking on more responsibilities and fostering the kind of collaborative work environment created by mentoring. Both are linked to increased job satisfaction and well-being (e.g. through better professional relationships and collaborative work environments) and contribute to a greater sense of self-efficacy (OECD, 2025[13]). Extrinsic motivation could come from financial compensation or reduced teaching hours for taking on mentoring responsibilities.
Figure D3.5 combines the shares of teachers currently assigned as mentors, collected by the TALIS survey (OECD, 2025[13]), with data on the existence and type of financial compensation for taking up mentorship (Table D3.10, available online). Teachers in nearly three-fifths of the countries and economies with available data benefit from some form of financial compensation for mentoring responsibilities (left hand side of Figure D3.5). The most common forms are regular additional payments or payments based on a percentage of the salary, while occasional payments or salary step increases are used by some countries. For example, in Bulgaria teachers receive a fixed amount every month on top of their salary for mentoring, while in Lithuania, they advance one step in the pay scale, and in Chile they are paid a lump sum at the beginning of the mentorship period. In some other countries, teachers can benefit from non-financial compensation through a reduction in teaching time. This is the case the Flemish Community of Belgium and in Portugal, where teaching hours are reduced according to the mentoring needs.
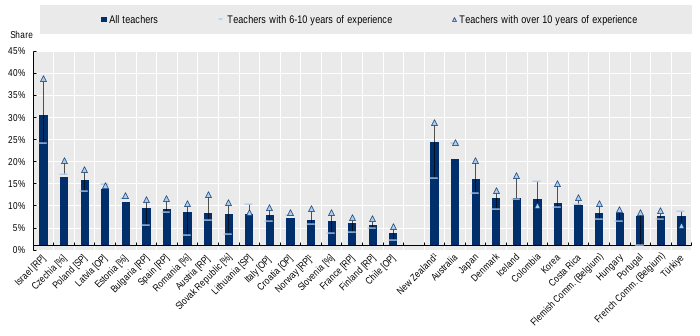
Note: The code in square brackets refers to the type of financial compensation received by mentors. This compensation is defined either as a percentage of statutory base salaries paid to teachers (%), regular additional payments (RP), incidental/occasional additional payments (OP), or salary progression (a step increment or other progression within the salary range) (SP). The share of teachers who are mentors is estimated based on principals' responses and using final teacher weights. Mentoring can be available either to all teachers in the school, only to teachers who are new to the school, or only to teachers who are new to teaching (i.e. have less than one year paid employment as a teacher). Information on teaching time compensation for mentoring activities is available in Table D4.4, available online.
1. Estimates should be interpreted with caution due to higher risk of non-response bias.
For data, see Table D3.10 (available online) and (OECD, 2025[13])Results from TALIS 2024: The State of Teaching, https://doi.org/10.1787/90df6235-en), Table 4.10. The data for this figure can be accessed via https://stat.link/z15uv3.
In most countries, teachers with more than 10 years of experience are more likely to take on mentoring roles than their colleagues with 6-10 years of experience. This pattern may reflect the role of mentoring as one channel through which experience and professional knowledge are shared between experienced and novice teachers, although the relationship between teaching experience and mentoring responsibilities varies across education systems (Figure D3.5).
Figure D3.5 also shows that participation rates in mentoring activities are similar for both sets of countries. Regardless of whether teachers will benefit from financial compensation for mentoring activities, the level of participation in mentoring is below 15% in most countries. This highlights the importance of intrinsic motivation in encouraging teachers to mentor others. It should be noted that the amount of the financial compensation related to mentoring activities is not collected but could also play a role in teachers’ decisions on whether to take them on.
Source: Data collection on salaries of teachers, and OECD (2025[13]), Results from TALIS 2024: The State of Teaching, https://doi.org/10.1787/90df6235-en.
Salaries relative to other tertiary-educated workers
Relative salaries of teachers and school heads
Education systems compete with other sectors of the economy to attract high-quality graduates as teachers and to retain them in the profession. Teachers’ salaries relative to other occupations with similar education requirements, and their likely future earnings, may have an influence on whether individuals choose a teaching career (Nagler, Piopiunik and West, 2020[2]) or to stay in the profession (Qin, 2020[3]).
In most OECD countries, a tertiary degree is required to become a teacher at all levels of education (see Table D.D3.3 in Education at a Glance 2026 Sources, Methodologies and Technical Notes (https://doi.org/10.1787/dcf64a14-en)) meaning that the likely alternative to initial teacher education would be a similar tertiary programme. Thus, teachers’ relative salary levels and labour-market conditions in different countries can be understood by comparing teachers’ actual salaries with the average earnings of other tertiary-educated professionals.
Two types of comparisons can be made. The first compares teachers broadly with full-time, full-year workers aged 25–64 who have completed tertiary education (ISCED levels 5-8). The second compares teachers with similarly educated workers, weighted by the proportion of teachers at each level of tertiary attainment. This second method ensures that comparisons between countries take into account differences in the distribution of bachelor’s, master’s and doctoral or equivalent attainment among teachers compared to tertiary-educated workers more generally (see Annex Table X2.10 for the proportions of teachers by attainment level, the Methodology section for more details and Box D3.3 for comparability issues related to measuring teachers’ relative salaries).
Young graduates may consider teachers’ statutory salaries relative to earnings of similarly educated workers over the course of their careers when considering teaching as a lifelong career (for earnings by field of study in tertiary education see Chapter A4 in Education at a Glance 2025 (OECD, 2025[4])). Data for lower secondary teachers with the most prevalent qualification to enter the profession in 2025 are available for 29 OECD countries and economies. On average, teachers’ starting salaries in these countries and economies are 61% of the average earnings of similarly educated workers aged 25-64, while salaries at the top of the scale reach 96% of the average earnings of similarly educated workers (Figure D3.6).
In a few countries and economies, teachers’ statutory salaries do reach or exceed the earnings of similarly educated workers. In Korea and Luxembourg, statutory salaries after 15 years of experience are at least 23% higher than the average earnings of similarly educated workers – and double for teachers at the top of the salary scale in Korea (Figure D3.6).
In the countries where teachers’ salaries do not exceed the average earnings of similarly educated workers at any stage in their career, the most prevalent qualifications are usually a master’s degree (Table D.D3.3 in Education at a Glance 2026 Sources, Methodologies and Technical Notes (https://doi.org/10.1787/dcf64a14-en)).
Where teachers’ salary scales are compressed, their relative pay may increase faster. For example, the starting salaries of lower secondary teachers in the Netherlands with the most prevalent qualification are just 61% of the average earnings of similarly educated workers, but will reach 1.25% after 12 years at the top of the scale. In contrast, relative salaries at the start of the career in Ireland are similar (56%), but due to more expanded salary scales (it takes 35 years to reach the top of the scale) they reach 89% after 15 years on average, and 109% of the average earnings of similarly educated workers at the top of the scale (Figure D3.6).
Ratio of salaries of teachers in general programmes in public institutions with the most prevalent qualification at the time of entry relative to the earnings of full-time, full-year workers aged 25-64 with similar educational attainment
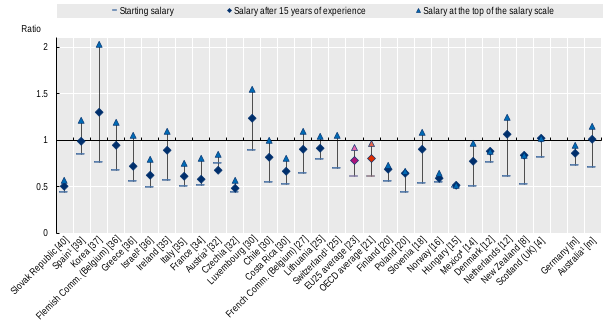
Note: The number in square brackets refers to the average number of years needed to progress from the starting salary to the top of the salary scale. Countries are ranked in descending order of the number of years needed. Reference years for earnings of workers and salaries of teachers may differ from 2025 (see Table D3.2).
1. Weighted average of the statutory salaries across different subnational entities.
2. In practice, many teachers obtain higher tertiary degrees during their service and are placed in a higher salary range.
3. Starting salary is relative to the earnings of workers who have attained a bachelor's degree or equivalent (ISCED 6). Salaries after 15 years of experience and at the top of the salary scale are relative to the earnings of workers with a master's degree or equivalent (ISCED 7) or higher attainment.
4. Combination of different salary scales for the same ISCED qualification requirement. The data for this figure can be accessed via https://stat.link/z15uv3.
Similarly to statutory salaries, teachers’ average actual salaries, which reflect their total earnings, can also be compared against either the earnings of similarly educated workers or all tertiary-educated workers. However, the data available only allow for the computation of averages of relative salaries when comparing actual salaries to earnings of tertiary-educated workers. Box D3.3 considers the comparability issues involved in calculating relative salary measures.
Meaningful international comparisons rely on the provision and implementation of rigorous definitions and a related statistical methodology. In view of the diversity of countries’ education and teacher compensation systems, adhering to these guidelines and methodology is not always straightforward. Some caution is therefore required when interpreting these data.
The relative salaries measure divides the salaries of teachers or school heads (the numerator) by the earnings of comparable workers (the denominator) using two different methods (see Table D3.2 and Methodology section). These measures of relative salaries are subject to biases due to differences in the characteristics, working patterns and remuneration systems of teachers and other workers or differences in the data used for salaries and earnings. Box D3.1 in Education at a Glance 2021 (OECD, 2021[14]) addressed comparability issues, including the potential bias related to the inclusion of teachers in data on workers’ earnings while Box D3.2 in Education at a Glance 2023 (OECD, 2023[8]) addressed the bias related to differences in working days between teachers and tertiary-educated workers.
On the bias related to the mean or median
Another source of potential biases in the measure of relative salaries relates to differences arising based on whether the arithmetic mean or the median was used as the central tendency measure, addressed in Box D3.2 in Education at a Glance 2025 (OECD, 2025[4]). The measure of relative salaries is more stable over the years when using the median (as the median is less sensitive to change in extreme values). There are also substantial differences (though only inconsistent patterns) when comparing mean to median ratios of the same year, which is consistent with the median being generally more robust with regard to outlier values and skewed distributions.
Thus, it might be useful to examine further how actual salaries are distributed to analyse the variation of relative salaries. Possible yardsticks are maximum and minimum relative statutory salaries (defined as relative starting salary for teachers with the minimum qualification and relative salary at the top of the scale for those with the maximum qualification) and relative actual salary deciles, defined as the salary value for teachers at the threshold of the top or bottom 10% of the salary distribution. Comparing the relative average actual salaries with minimum and maximum salaries can indicate whether salary distributions are roughly symmetric or skewed, for example if a comparatively small number of high salary values are skewing it to the right.
Statutory salaries are readily available for most countries but come with some methodological issues: allowances and other benefits received on top of statutory amounts are not included even though they can form a substantial part of teachers’ salaries. There are also conceptual differences to both actual salary data and earnings data. Actual salary deciles do not suffer from the same issues since they do include allowances and other benefits. However, they might not be as easily available.
A preliminary analysis of the patterns of relative salaries against actual salary deciles and minimum or maximum statutory salaries based on the examples of three countries and economies (Finland, the Flemish Community of Belgium and Latvia) suggests there would be very different results for the identified salary distributions depending on the type of salaries measured. The importance of allowances for actual salaries and the small shares of teachers receiving the maximum or minimum salaries may explain these differences and make the case for an analysis covering a larger number of countries to help conclude the best way to handle the differences in the distribution of salaries across countries.
On the bias related to part-time work
Part-time work might introduce a bias to the relative salaries measure (if included in data on salaries without a weighting system to compute average salaries for full-time equivalent teachers), since part-time teachers would then affect the average actual salaries of teachers. The current analysis of relative salaries used in this chapter excludes part-time teachers from actual salaries (and part-time workers from earnings), but some countries include part-time teachers (reporting salaries of full-time equivalent teachers), for example due to technical limitations.
However, biases could nevertheless arise if certain groups of teachers are more likely to be part time than others (similar issue may also bias earnings of other tertiary educated workers). For example, younger teachers, who tend to be less experienced, are also likely to receive lower salaries. If this cohort of teachers are more likely to work part-time, and thus more likely to be excluded from the data collection on salaries of teachers, then higher salaries from more experienced teachers would receive more weight than salaries of younger full-time teachers (see Box D4.4 in Chapter D4). This might introduce an upward bias in relative actual salaries. On top of that, the existence of a wage penalty related to part-time work (meaning teachers working part-time earn lower hourly wages) may increase the bias.
On the bias related to special pension schemes
Special pension schemes for teachers can increase lifetime earnings, e.g. through higher pension payouts, and thus can have an impact on the attractiveness of the teaching profession even if it is not directly visible in the relative salary measure. There are no recent data covering special pension schemes for teachers in particular, but civil servants in two-fifths of countries with available data are subject to a special pension scheme. Since teachers in many countries are also civil servants, these data can be used as a proxy (OECD, 2016[15]).
Differences in pension schemes can show in some key measures. In Belgium, for example, the gross replacement rate, which expresses how much of the pre-retirement earnings the pension replaces before tax, is up to 75% for the civil service scheme, compared to up to 48% for the general scheme. In Germany, this rate is up to 72% for the special scheme and up to 48% for the general one and in Korea civil servants can expect up to 61%, while workers in the general scheme can expect up to 39%. Contribution rates to pension schemes can also differ. In Germany, civil servants pay no contribution, while in Belgium the rate is the same as for the general scheme and in Korea civil servants pay double the rate of the general scheme (OECD, 2016[15]).
There remain some caveats to this brief comparison. It covers only mandatory public schemes, not voluntary occupational schemes (i.e. where the employer bears part of the contribution) or personal pension schemes, and these might substantially increase effective pensions. In many countries, occupational schemes are a substantial pillar of the general scheme (e.g. 401(k) or 403(b) plans in the United States or the betriebliche Altersvorsorge in Germany). Finally, teachers are not necessarily covered by special pension schemes in all countries, as for example they may not have the status of a civil servant. For example, in Germany, 75% of the teaching workforce are civil servants.
In most countries and economies with available information and at almost all levels of education, teachers’ actual salaries are lower than those of tertiary-educated workers. On average, pre-primary teachers’ actual salaries are 83% of the full-time, full-year earnings of tertiary-educated 25-64 year-olds, rising to 87% for primary teachers, 91% for lower secondary teachers and 95% for upper secondary teachers. The lowest relative salaries are at pre-primary level in Czechia with 55% of average earnings of tertiary-educated workers (although no tertiary education is required to become a teacher at pre-primary level) (Table D3.2).
Teachers’ actual salaries reach or exceed those of tertiary-educated or similarly educated workers on average in a few countries. Teachers earn more than tertiary-educated workers at all levels of education in Costa Rica, Lithuania, Peru, Portugal, Romania, and Türkiye. Teachers’ actual salaries exceed the earnings of tertiary educated workers by more than 50% in Costa Rica (at secondary level), Peru and Türkiye (Table D3.2).
School heads’ career prospects and their relative salaries are also a signal to teachers of their potential career progression pathway and the associated compensation in the longer term (see Box D3.2 in Education at a Glance 2025 (OECD, 2025[4])). Not only do school heads earn more than teachers, they also, unlike teachers, typically earn more than tertiary-educated workers. However, there are some exceptions, most notably at the pre-primary level where the average actual salaries of school heads are at least 5% lower than the earnings of tertiary-educated workers in Czechia, Denmark, Estonia, Finland, Hungary and Norway (Table D3.2). A possible explanation might be that in Czechia and Finland the minimum qualifications for school heads at the pre-primary level are lower than for other levels.
Trends in teachers’ relative actual salaries
Salaries are one of several factors that can influence the attractiveness of the teaching profession, but pose challenges when interpreted in isolation. Prospective teachers are likely to weigh options in sectors other than education before entering the teaching profession. Trend data on relative actual salaries can make it possible to see how changes in salaries compare against broader economic developments.
Trend data on relative actual salaries of teachers compare salaries of teachers to earnings of tertiary-educated workers for the same reference year (see Definitions), allowing changes in these relative salaries to be analysed. The resulting ratio can be interpreted as expressing the average actual salary of teachers as a percentage of the earnings of tertiary educated workers.
The most recent data available are for the reference year 2024, but only 7-12 countries (depending on the education level) have data for the change between 2015 to 2024, whereas a larger number of countries have data covering 2015 to 2023 (14 countries at the pre-primary level, 18 at the primary level and 19 at the secondary levels). Therefore, to allow for better generalisation, this analysis focuses on the period 2015 to 2023 (Table D3.9, available online).
The changes between 2015 and 2023 are on average small and relative salaries remained virtually stable over the period. Across all the 18 or 19 countries with comparable data for both years at primary and secondary levels of education, teachers’ relative salaries fell very slightly at all levels of education. At lower secondary level, they fell from 0.59 to 0.58, i.e. teachers’ salaries were 59% of the earnings of tertiary educated workers in 2015, but 58% in 2023. There is a similar decrease, amounting to about 1 percentage point, for all levels of education over this period. However, this masks large differences across countries and economies. At the lower secondary level, teachers’ relative actual salaries fell in more than two-thirds of countries with data, in five of them (Estonia, Finland, Israel, New Zealand and Portugal) by more than 5 percentage points. Meanwhile relative salaries increased in six countries and economies, in five of which (Australia, Chile, Czechia, Scotland [United Kingdom] and the Slovak Republic) they rose by at least 8 percentage points (Table D3.9 available online).
However, these changes in relative salaries need to be interpreted with caution. Falling relative salaries do not necessarily imply teachers’ real salaries fell. For example, the largest fall at the lower secondary level occurred in Israel where relative salaries fell by 19 percentage points between 2015 and 2023. This was due to a combination of changes in both teachers’ actual salaries and the earnings of tertiary-educated workers: while teachers’ salaries increased by 8% in real terms over this period, the earnings of tertiary-educated workers rose more, resulting in the relative fall (Tables D3.8 and D3.9, available online).
In contrast, increasing relative actual salaries can indicate both rising real salaries for teachers and improvements in the attractiveness of the salaries in the teaching profession. In Scotland (United Kingdom) relative actual salaries for lower secondary teachers increased by almost 15 percentage points over the period 2015 to 2023 while in Czechia they increased by over 13 percentage points. These are the largest increases across countries with available data. In both countries, this appears to be driven by stronger growth in actual teachers’ salaries than for earnings of tertiary-educated workers. In Scotland, the real value of actual teacher salaries increased by 13%, while for Czechia the increase was 29% over the time period (Tables D3.8 and D3.9, available online).
Teachers refer to professional personnel directly involved in teaching students. The classification includes classroom teachers and other teachers who work with a whole class of students in a classroom, in small groups in a resource room, or in one-to-one teaching situations inside or outside a regular class.
School head refers to any person whose primary or major function is heading a school or a group of schools, alone or within an administrative body such as a board or council. The school head is the primary leader responsible for the leadership, management and administration of a school.
Actual salaries refer to the annual average earnings received by full-time teachers/school heads aged 25-64 before taxes. It is the gross salary from the employee’s point of view: it includes the part of social security contributions and pension-scheme contributions that are paid by the employees (even if deducted automatically from the employees’ gross salary by the employer). However, the employers’ premium for social security and pension is excluded. Actual salaries also include work-related payments, such as school-head allowance, annual bonuses, results-related bonuses, extra pay for holidays and sick-leave pay. Income from other sources, such as government social transfers, investment income and any other income that is not directly related to their profession is not included.
Earnings for workers with tertiary education are average earnings for full-time, full-year workers aged 25-64 with an education at ISCED level 5, 6, 7 or 8.
Salary at the top of the scale refers to the maximum scheduled annual salary (top of the salary range) for a full-time teacher (for a given level of qualification of teachers recognised by the compensation system).
Salary after 15 years of experience refers to the scheduled annual salary of a full-time teacher. Statutory salaries may refer to the salaries of teachers with a given level of qualification recognised by the compensation system (the minimum training necessary to be fully qualified, the most prevalent qualifications or the maximum qualification), plus 15 years of experience.
Starting salary refers to the average scheduled gross salary per year for a full-time teacher with a given level of qualification recognised by the compensation system (the minimum training necessary to be fully qualified or the most prevalent qualifications) at the beginning of the teaching career.
Statutory salaries refer to scheduled salaries according to official pay scales. The salaries reported are gross (total sum paid by the employer) less the employer’s contribution to social security and pension, according to existing salary scales. Salaries are “before tax” (i.e. before deductions for income tax). Statutory salaries also include additional payments that all teachers or school heads receive and that constitutes a regular part of the annual salary, such as 13th month pay. In the case of school heads, statutory salaries include the management allowance that all school heads receive for managing the school where applicable.
Data on teachers’ salaries at lower and upper secondary level refer only to general programmes.
In most countries, the criteria to determine the most prevalent qualifications of teachers are based on a principle of relative majority (i.e. the level of qualifications of the largest proportion of teachers).
The period of reference for teachers’ salaries is the school year 2024/25 where the school year begins on the second half of the calendar year 2024 and ends in the first half of the calendar year 2025, or otherwise, the school year 2025 where the school year starts in the first half of the calendar year 2025. For ease of reference in the publication, the reference school year is given as 2025.
Salaries were converted into equivalent USD using purchasing power parities (PPPs) for private consumption from the OECD Data Explorer on national accounts. These PPPs refer to the calendar year and have been adjusted to refer to January 2025 for the conversion of salaries. Tables with salaries in national currency are included in Annex 2 (see Tables X2.3, X2.4, X2.5, X2.6 and X2.7). To calculate the index of change in teachers’ salaries compared to 2015, the deflator for private consumption is used to convert salaries to 2015 prices. Reference statistics used in the calculation (PPPs and deflators for private consumption) are available in Table X2.8 in Annex 2. For more information, please see the methodology section of Education at a Glance 2026 Sources, Methodologies and Technical Notes (https://doi.org/10.1787/dcf64a14-en).
In Table D3.2, the ratios of teacher salaries to earnings for similarly educated full-time, full-year workers aged 25-64 are calculated based on weighted averages of earnings of tertiary-educated workers (Columns 2 to 5 for teachers and Columns 10 to 13 for school heads). The weights, collected for every country individually, are based on the percentage of teachers or school heads at each ISCED level of tertiary attainment (see Tables X2.9 and X2.10 in Annex 2). The ratios have been calculated for countries for which these data are available. When data on earnings of workers referred to a different reference year than the 2025 reference year used for salaries of teachers or school heads, a deflator has been used to adjust earnings data to 2025. For all other ratios in Table D3.2 and those in Table D3.5 (available online), information on all tertiary-educated workers was used instead of weighted averages. Data on the earnings of workers take account of earnings from work for all individuals during the reference period, including the salaries of teachers. In most countries, the population of teachers is large and may influence the average earnings of workers.
For the trend data on relative salaries in Table D3.9 (available online) the methodology is slightly different. The relative actual salary ratios are calculated only using teachers’ salaries and workers’ earnings from the same reference year, meaning that there is no need to use deflators to adjust data to a similar reference year. Data points for years in which one of the components is not available are marked as missing.
For more information, please see the OECD Handbook for Internationally Comparative Education Statistics (OECD, 2018[16]) and Education at a Glance 2026 Sources, Methodologies and Technical Notes (https://doi.org/10.1787/dcf64a14-en).
Data on salaries for teachers and school heads are collected from the 2025 joint OECD/Eurydice data collection on salaries of teachers and school heads. Data refer to the school year 2024/25 (or the school year 2025) and are reported in accordance with formal policies for public institutions. Data on workers’ earnings are based on the regular data collection by the OECD Labour Market and Social Outcomes of Learning Network.
References
[2] Nagler, M., M. Piopiunik and M. West (2020), “Weak markets, strong teachers: Recession at career start and teacher effectiveness”, Journal of Labor Economics, Vol. 38/2, pp. 453-500, https://doi.org/10.1086/705883.
[9] OECD (2026), Education and Skills, OECD Data Explorer, http://data-explorer.oecd.org/s/5q.
[4] OECD (2025), Education at a Glance 2025: OECD Indicators, OECD Publishing, Paris, https://doi.org/10.1787/1c0d9c79-en.
[13] OECD (2025), Results from TALIS 2024: The State of Teaching, TALIS, OECD Publishing, Paris, https://doi.org/10.1787/90df6235-en.
[12] OECD (2024), Education at a Glance 2024: OECD Indicators, OECD Publishing, Paris, https://doi.org/10.1787/c00cad36-en.
[8] OECD (2023), Education at a Glance 2023: OECD Indicators, OECD Publishing, Paris, https://doi.org/10.1787/e13bef63-en.
[1] OECD (2023), “What do OECD data on teachers’ salaries tell us?”, Policy Brief, OECD Publishing, Paris, https://doi.org/10.1787/de0196b5-en.
[11] OECD (2022), Education at a Glance 2022: OECD Indicators, OECD Publishing, Paris, https://doi.org/10.1787/3197152b-en.
[10] OECD (2022), OECD Economic Outlook, Volume 2022 Issue 2: Confronting the Crisis, OECD Publishing, Paris, https://doi.org/10.1787/f6da2159-en.
[14] OECD (2021), Education at a Glance 2021: OECD Indicators, OECD Publishing, Paris, https://doi.org/10.1787/b35a14e5-en.
[6] OECD (2020), PISA 2018 Results (Volume V): Effective Policies, Successful Schools, PISA, OECD Publishing, Paris, https://doi.org/10.1787/ca768d40-en.
[7] OECD (2019), Education at a Glance 2019: OECD Indicators, OECD Publishing, Paris, https://doi.org/10.1787/f8d7880d-en.
[16] OECD (2018), OECD Handbook for Internationally Comparative Education Statistics 2018: Concepts, Standards, Definitions and Classifications, OECD Publishing, Paris, https://doi.org/10.1787/9789264304444-en.
[15] OECD (2016), OECD Pensions Outlook 2016, OECD Publishing, Paris, https://doi.org/10.1787/pens_outlook-2016-en.
[5] Pont, B., D. Nusche and H. Moorman (2008), Improving School Leadership, Volume 1: Policy and Practice, OECD Publishing, Paris, https://doi.org/10.1787/9789264044715-en.
[3] Qin, L. (2020), “Country effects on teacher turnover intention: a multilevel, cross-national analysis”, Educational Research for Policy and Practice, Vol. 20/1, pp. 79-105, https://doi.org/10.1007/s10671-020-09269-3.
Data Download
The data for the figures and tables in this chapter can be downloaded via https://stat.link/z15uv3.
To access further data and/or other education indicators, please visit the OECD Data Explorer: http://data-explorer.oecd.org/s/4s.
Data cut-off for the print publication 17 June 2026. Please note that the Data Explorer contains the most recent data.
Annual salaries of full-time teachers in public institutions, in equivalent USD converted using PPPs for private consumption, by level of education
Note: The definition of teachers' most prevalent qualifications is based on a broad concept, including the typical ISCED level of attainment and other criteria. The most prevalent qualification is defined for each of the four career stages included in this table. In many cases, the minimum qualification is the same as the most prevalent qualification. The minimum and the most prevalent qualifications are described in Table X3.D3.3 in Education at a Glance 2026 Sources, Methodologies and Technical Notes.
1. Data on pre-primary education include salaries of kindergarten teachers (the majority).
2. Data include the average of fixed bonuses for overtime hours for lower and upper secondary teachers.
3. Year of reference: 2024 (calendar year for Sweden).
4. Data exclude the social security contributions and pension scheme contributions paid by employees.
5. Actual salaries (including teachers of general subjects within vocational programmes in Sweden, and excluding bonuses and allowances in the United States).
The data for this table can be accessed via https://stat.link/z15uv3.
Ratio of salary, using annual average salaries (including bonuses and allowances) of full-time teachers and school heads in public institutions relative to the earnings of workers with similar educational attainment (weighted average) and to the earnings of full-time, full-year workers with tertiary education, by level of education
Note: Where the year of reference for the earnings of tertiary-educated workers and the salaries of teachers differ, the earnings of tertiary-educated workers have been adjusted to the reference year used for salaries of teachers using deflators for private final consumption expenditure.
1. Reference year differs from 2025 for salaries of teachers and school heads: 2024 for Czechia, Slovenia and Sweden (calendar year), 2023 for Chile.
2. Data on teachers in pre-primary education include the data for teachers in early childhood education and care.
3. Data on earnings for full-time, full-year workers with tertiary education refer to the whole country: Belgium for the Flemish and the French Communities of Belgium, and the United Kingdom for England and Scotland.
The data for this table can be accessed via https://stat.link/z15uv3.
Annual average salaries (including bonuses and allowances) of teachers and school heads in public institutions, in equivalent USD converted using PPPs for private consumption, by level of education
Note: Where the year of reference for the earnings of tertiary-educated workers and the salaries of teacher differ, the earnings of tertiary-educated workers have been adjusted using deflators for private final consumption expenditure.
1. Reference year differs from 2025: 2024 for Chile (school heads), Czechia, Slovenia and Sweden (calendar year); 2023 for Chile (teachers) and France (calendar year).
2. Data on teachers in pre-primary education include the data for teachers in early childhood education and care.
The data for this table can be accessed via https://stat.link/z15uv3.