This chapter examines how much principals’ instructional and relational leadership varies between education systems, schools and teachers. It then explores how these leadership practices relate to school climate, teachers’ professional outcomes and staffing.
The Value of School Principals in TALIS 2024

Abstract
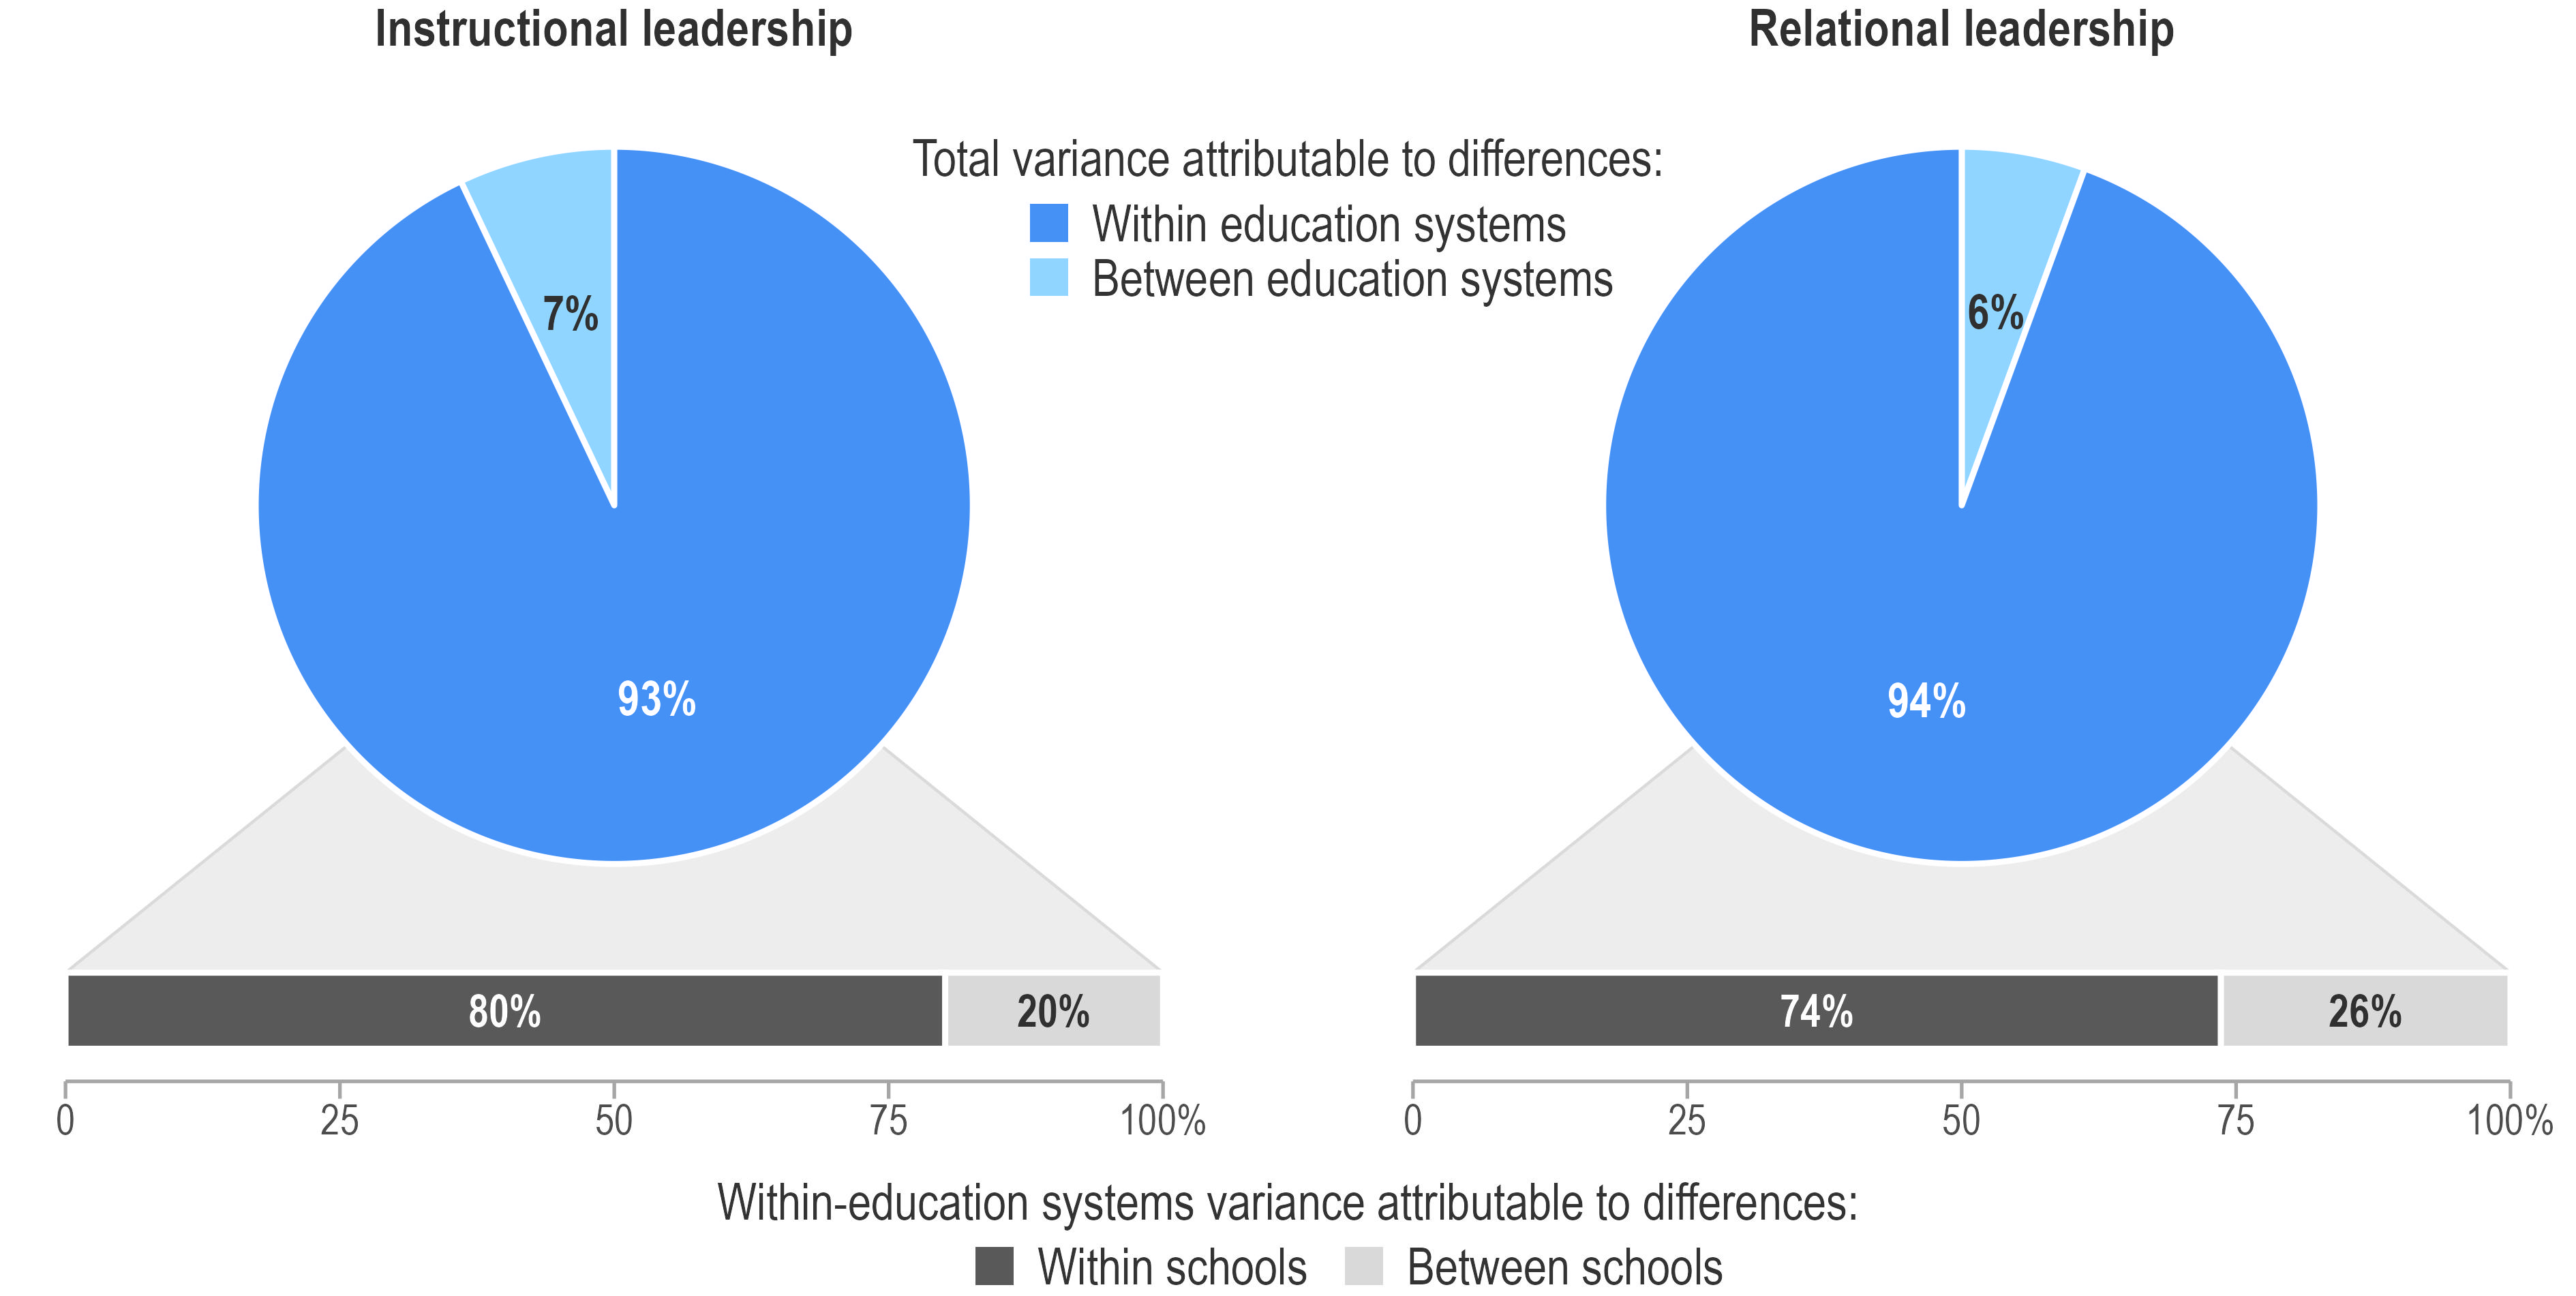
How teachers perceive their principals’ leadership varies more within education systems than between them. Over 90% of the total variation in instructional and relational leadership is attributable to differences within systems. Instructional leadership involves principals encouraging their teachers to improve their skills, collaborate with each other and take responsibility for students’ learning outcomes. Relational leadership refers to principals fostering their school community’s shared vision, inclusive decision making and positive professional relationships.
The widest disparities in instructional and relational leadership appear in South Africa, Chile, United States, Alberta (Canada)* and Norway*.
Valued leadership (i.e. teachers’ viewing their principals’ instructional and relational leadership as positive) is linked to a school climate that supports teaching and learning. In most education systems, the more teachers value their principals’ leadership the better the schools’ collaborative, academic, disciplinary and adaptive climates.
Valued leadership is associated with better professional outcomes for teachers. In nearly all education systems, teachers who value their principals’ leadership greatly also report higher self-efficacy, fulfilment of lesson aims, well-being and job satisfaction.
In schools with more valued leadership, teachers are less likely to want to leave the profession. There are also fewer reported teacher shortages, on average.
* For countries highlighted with an asterisk (*), estimates should be interpreted with caution due to a higher risk of non-response bias. See the Reader's Guide and Annex A for more detail.
Principals shape the daily experiences of teachers, students and families. Research consistently demonstrates that school leadership is closely associated with the quality of teaching and learning, largely through its effects on school organisation, culture and teacher practice (Day et al., 2010[1]; Hallinger, 2011[2]; Leithwood, Harris and Hopkins, 2020[3]). Principals are key to setting the vision, establishing culture, building capacity and aligning efforts across stakeholders (Leithwood, Harris and Hopkins, 2020[3]). They are central to improving teaching quality and cultivating a positive school climate (Darling-Hammond et al., 2026[4]; Price, 2020[5]; Price, 2012[6]). All this supports student learning.
This chapter begins by defining what valued leadership is and then examines the extent to which the two dimensions, instructional and relational leadership, vary between education systems, schools and teachers. The chapter also explores the relationship between valued leadership and school climates, teachers’ professional outcomes and staffing.
The relationships presented in this chapter are based on regression analyses, which examine how two variables are related while taking other relevant factors into account that may influence the relationship. Depending on the level of analysis, the regression models control for teacher- or principal-level characteristics (i.e. gender and age), as well as school characteristics (i.e. school governance type, school size and school intake of students from socio-economically disadvantaged homes).1 The relationships identified and discussed meet the following conditions:
coefficients for OECD and TALIS averages are statistically significant;2
at least two-thirds of participating education systems with available data have coefficients with the same sign as OECD and TALIS averages, regardless of statistical significance.
To note, the design of TALIS does not allow to establish causal relationships. All regression analysis presented in this report should be interpreted as uncovering the presence (or absence) of statistical association, i.e. whether or not variations in one variable is systematically associated to variation in another variable. It is not possible, however, to assess causality between two variables, i.e. whether or not variations in one variable, all other things being kept equal, would cause a change in another variable.
This report defines valued leadership based on teachers’ views about their principals’ instructional and relational leadership. The conceptualisation of valued leadership is guided by the Teaching and Learning International Survey (TALIS) 2024 Conceptual Framework (OECD, 2025[7]), which identifies instructional and relational leadership as key domains of school leadership. To note:
TALIS does not survey teachers about their views on other important aspects of principals’ leadership, such as managerial leadership.
The instructional and relational leadership scales, which are based on teachers’ perceptions, may partly reflect principals’ popularity rather than leadership quality. Principals who make difficult but necessary decisions may consequently be viewed less favourably, even when their leadership is highly effective.
The instructional and relational leadership scales are strongly and positively correlated, ranging from a linear correlation coefficient (r) of .62 in the Netherlands* to .91 in Shanghai (China) (Table 1.1). Teachers who rate their principals highly on one dimension also tend to rate them highly on the other.
Instructional leadership
Instructional leadership is a central school leadership approach associated with student achievement (Day, Gu and Sammons, 2016[8]; Hallinger et al., 2015[9]; Robinson, Lloyd and Rowe, 2008[10]; Sebastian and Allensworth, 2012[11]). It focuses on high-quality instruction, curriculum improvement, professional learning communities and the use of data (OECD, 2025[7]).
The TALIS 2024 instructional leadership scale summarises teachers’ responses to three four-point agreement items (“strongly disagree”; “disagree”; “agree”; “strongly agree”) about their school principal. The scale is constructed using latent variable modelling3 and is based on the following items:
The principal encourages co-operation among teachers to develop new teaching practices
The principal ensures that teachers take responsibility for improving their teaching skills
The principal ensures that teachers feel responsible for their students’ learning outcomes
On average across OECD countries and territories with available data (hereafter, “on average”), over 80% of teachers “agree” or “strongly agree” with each of these three statements that capture principals’ engagement in instructional leadership (Table 1.2). The lowest levels of agreement — ranging from 62% to 79%, depending on the statement and system — are observed in Austria, Finland, France and Japan.
Relational leadership
Relational leadership refers to the social processes (Hallinger and Truong, 2016[12]), and connections and interdependencies (Uhl-Bien, 2006[13]) within a school that help it flourish. This focus is an important way to respond to a changing and complex world. It involves having a strong focus on care and well-being (Smit, 2018[14]), and creating ownership and a sense of belonging and identity (Gómez-Leal et al., 2022[15]). Strong relational leadership features include clear vision (Mincu, 2022[16]), collaboration skills (Mincu, 2022[16]), communication skills (Gómez-Leal et al., 2022[15]), fostering cohesion across the school community (Gómez-Leal et al., 2022[15]; Mincu, 2022[16]) and shared decision making (Liu and Watson, 2023[17]).
The TALIS 2024 relational leadership scale summarises teachers’ responses to four four-point agreement items (“strongly disagree”; “disagree”; “agree”; “strongly agree”) about their school principal. The scale is constructed using latent variable modelling and is based on the following items:
The principal has a clear vision for this school
The principal encourages all staff to have a say on important decisions
The principal has good professional relationships with staff
The principal has good professional relationships with parents or guardians
Most teachers across education systems participating in TALIS with available data (hereafter, “education systems”) have a positive view about their principals’ relational leadership (Table 1.3). On average, depending on the statement, 78% to 91% of teachers “agree” or “strongly agree” that their principals demonstrate good relational leadership practices. Principals are rated lowest on encouraging all staff to have a say on important decisions (OECD average: 78%); in Australia, Costa Rica, the Flemish and French Communities of Belgium, Japan, the Netherlands* and New Zealand*, this ranges from 61% and 70%.
Variation in valued leadership between education systems, schools and teachers
Identifying where perceived differences in leadership lie can help education authorities target policy more effectively. When the greatest variation in principals’ perceived leadership is between education systems, it suggests that system-level factors, such as leadership policies, governance structures, accountability arrangements, or professional expectations for school leaders, strongly shape teachers’ perceptions of leadership. By contrast, when variation is mainly within education systems, it is sub-system governance and policies, differences across schools, local contexts, and teachers’ perceptions of their principals’ personal qualities and experiences that are likely the main drivers. Principals’ activities, interactions and decisions in schools both shape and reflect their leadership approaches and priorities. These, in turn, influence how teachers perceive them (Darling-Hammond et al., 2022[18]).
National policies may influence both between- and within-system variation by shaping leadership expectations, governance arrangements and support structures, as well as by promoting or constraining the equitable distribution of resources and leadership capacity across schools.
Perceptions of instructional and relational leadership vary more within education systems than between them. Across education systems, over 90% of the total variation in instructional (93%) and relational (94%) leadership is attributable to differences within systems (Figure 1.1).
Based on lower secondary principals’ instructional and relational leadership scales (education systems participating in TALIS)
Source: OECD, TALIS 2024 Database, Tables 1.4 and 1.5.
Breaking down within-country variation in perceived leadership can inform policymakers on whether to focus their support for principals on certain types of schools. When there is substantial between-school variation in perceived leadership, this suggests that differences in school characteristics are important for policy to consider. In contrast, when between-school variation is negligible, this indicates that perception of principals’ leadership depends on the specific experiences and contexts of individual teachers.
Across education systems, 20% of the variation in instructional leadership and 26% of the variation in relational leadership is found between schools. These values are around twice as large compared to other TALIS indicators – such as teacher self-efficacy and school climate regarding bullying (Tables 1.6 and 1.7). In some education systems, including Alberta (Canada)*, Chile, Norway*, South Africa and the United States, the between-school variance in both instructional and relational leadership is over 25% (Tables 1.8 and 1.9). These results suggest that teachers’ perceptions of their principals’ leadership might be particularly sensitive to differences across schools and leaders.
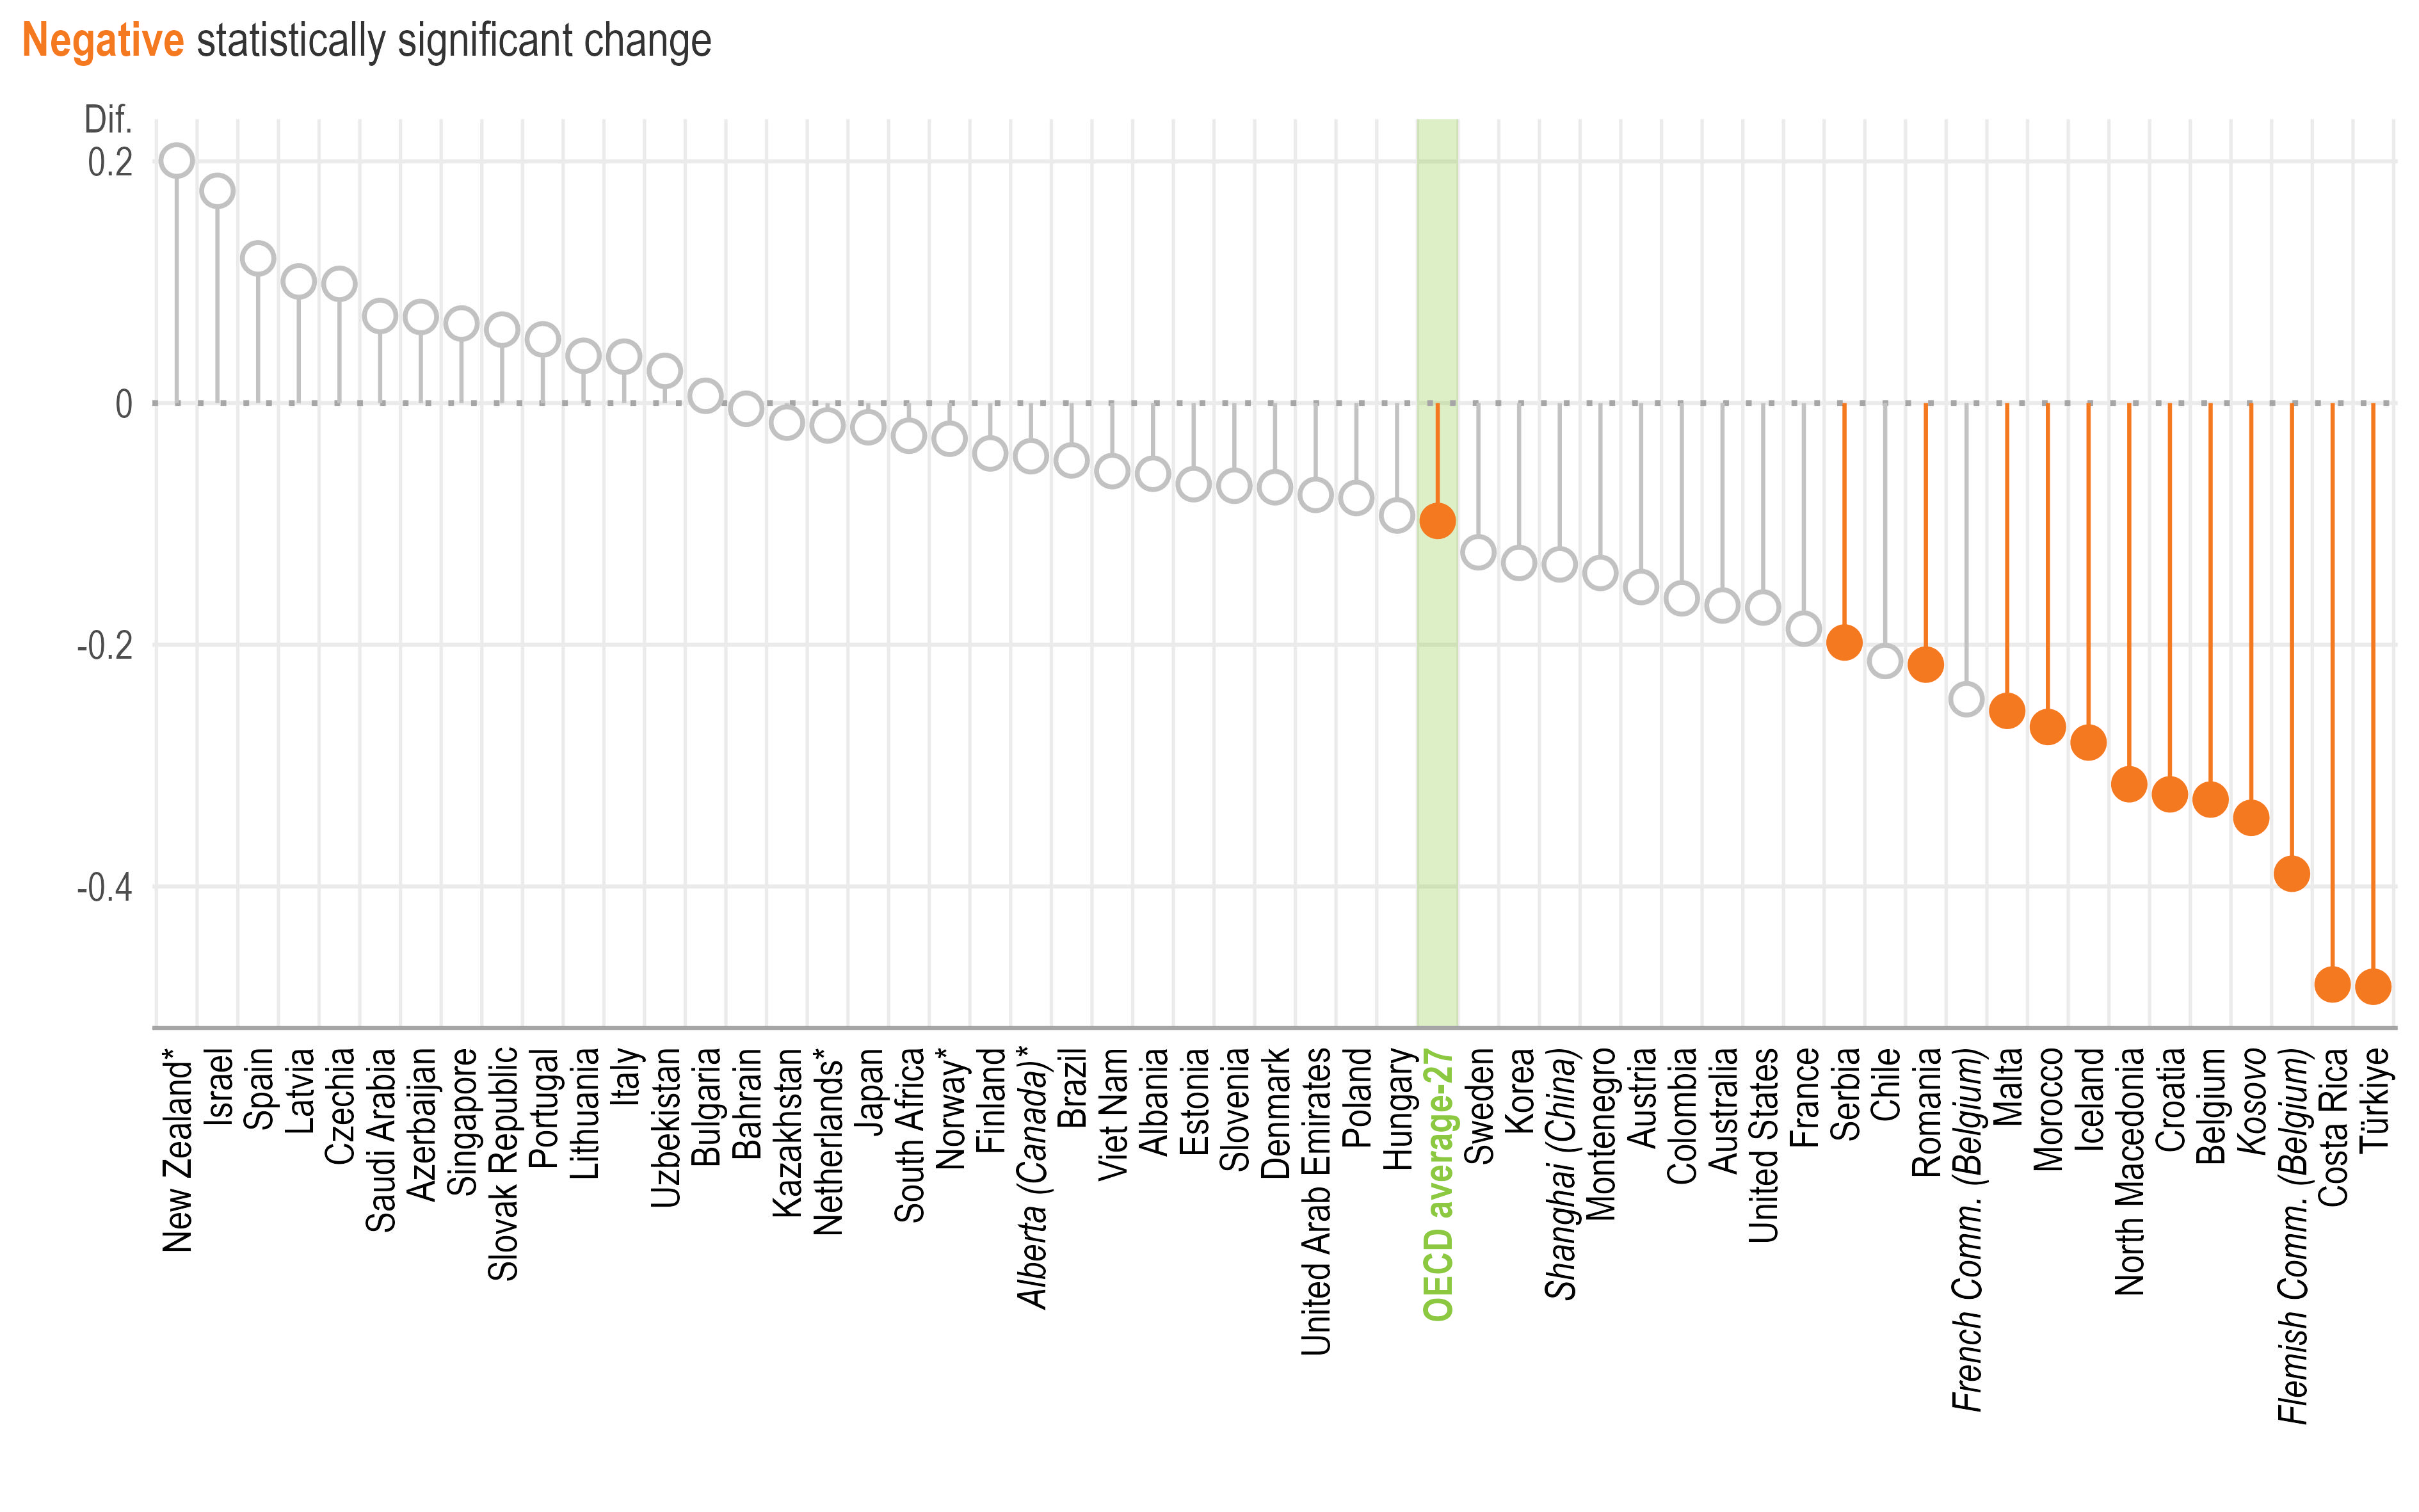
Nevertheless, the considerable within-school variations observed across education systems suggest that leadership is also not experienced uniformly within schools. Teacher-level factors play a role in how they perceive principals’ leadership. Experienced teachers tend to rate their principals' instructional and relational leadership lower, on average (Figure 1.2 and Table 1.12). One possible explanation is that they have had greater exposure to their principals’ leadership, value autonomy and distributed leadership more, and may therefore evaluate leadership more critically than novice teachers (Sanchez, Paul and Thornton, 2022[19]).
Other teacher-level factors include teachers’ satisfaction with the teaching profession and their sense of value and policy influence. In almost all education systems, both factors are positively associated with teachers’ views of principals’ leadership (Tables 1.13 and 1.14). They reflect differences in how included, recognised and empowered teachers from the same school feel, leading them to perceive their principal’s leadership differently. Conversely, teachers working with more valued principals may, themselves, feel more satisfied with the profession and more influential.
Change in the scale of lower secondary principals’ instructional leadership1 associated with a one-standard-deviation increase in teachers’ years of teaching experience2,3
Note: *Estimates should be interpreted with caution due to a higher risk of non-response bias.
Statistically significant coefficients are highlighted with filled circles (see Annex B). Filled circles above 0 indicate a positive association, while those below 0 reflect a negative relationship.
1. Standardised scale scores with a standard deviation of 2 and the value of 10 corresponding to the item mid-point value of the response scale. For more information on the scales, see Annex B.
2. Years of teaching experience standardised at the international level.
3. Results are based on teacher-level linear regression analysis controlling for teacher characteristics (i.e. gender and age [standardised at the international level]) and school characteristics (i.e. school governance type, school size and school intake of students from socio-economically disadvantaged homes).
Source: OECD, TALIS 2024 Database, Table 1.12.
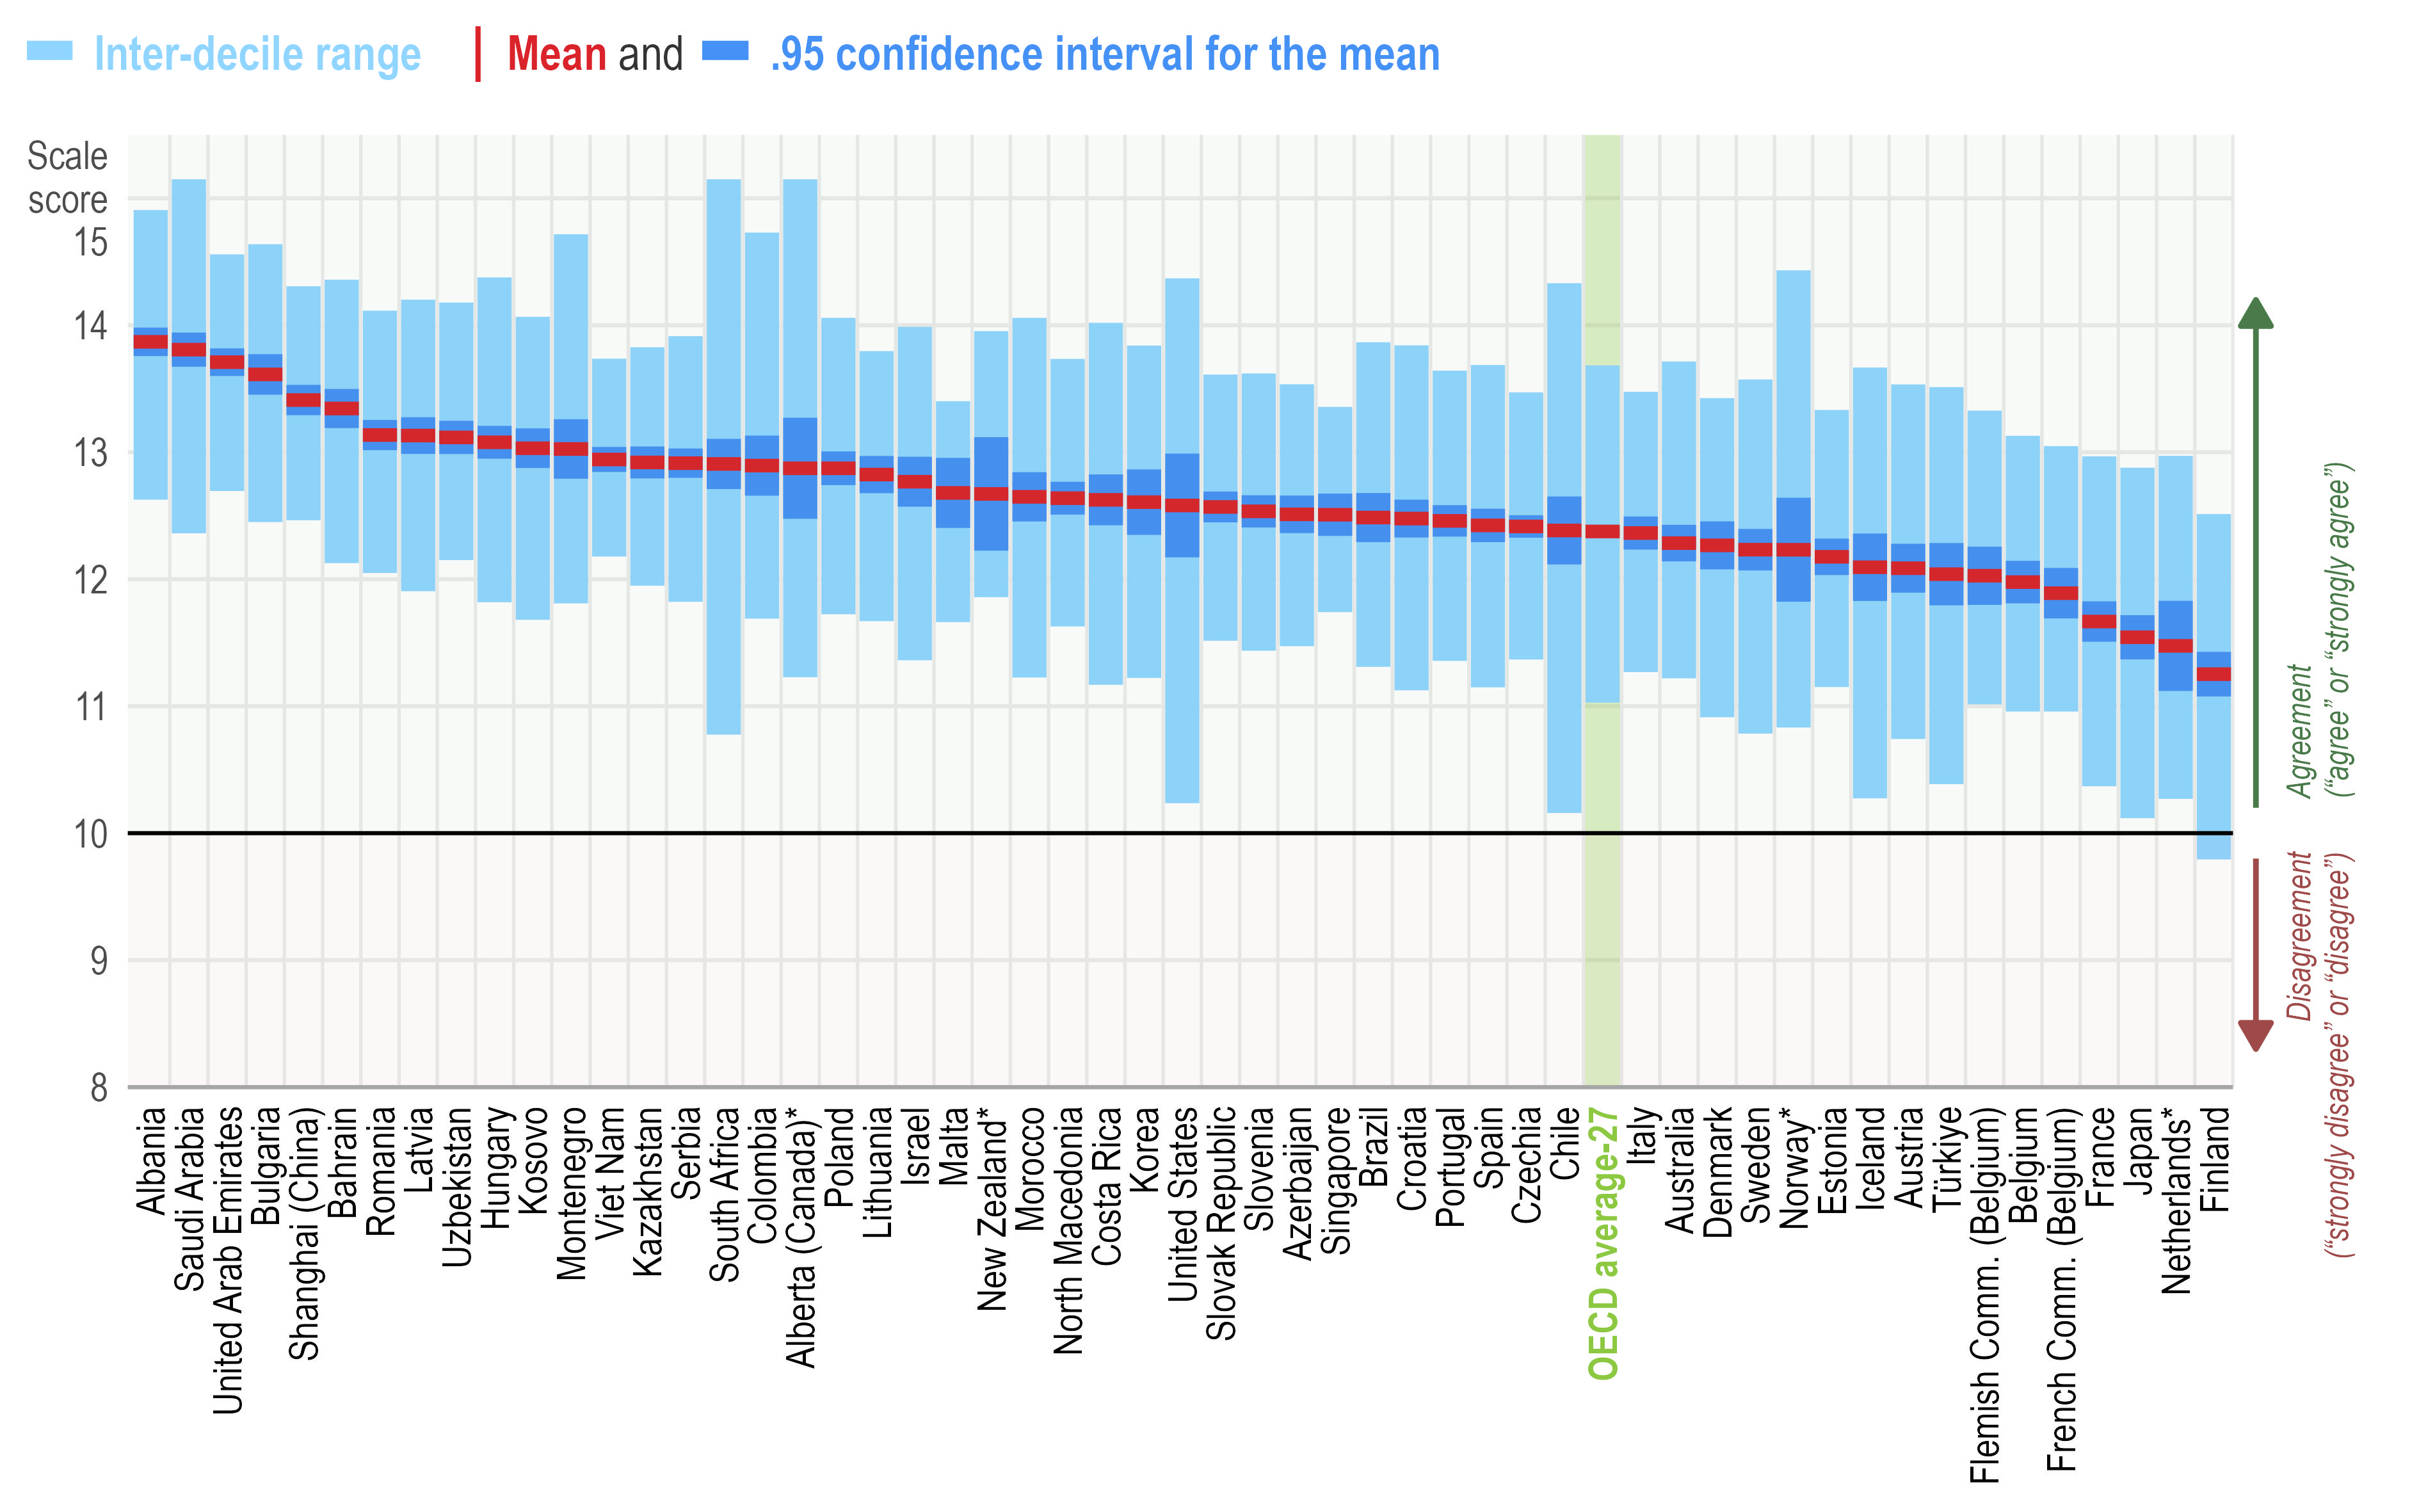
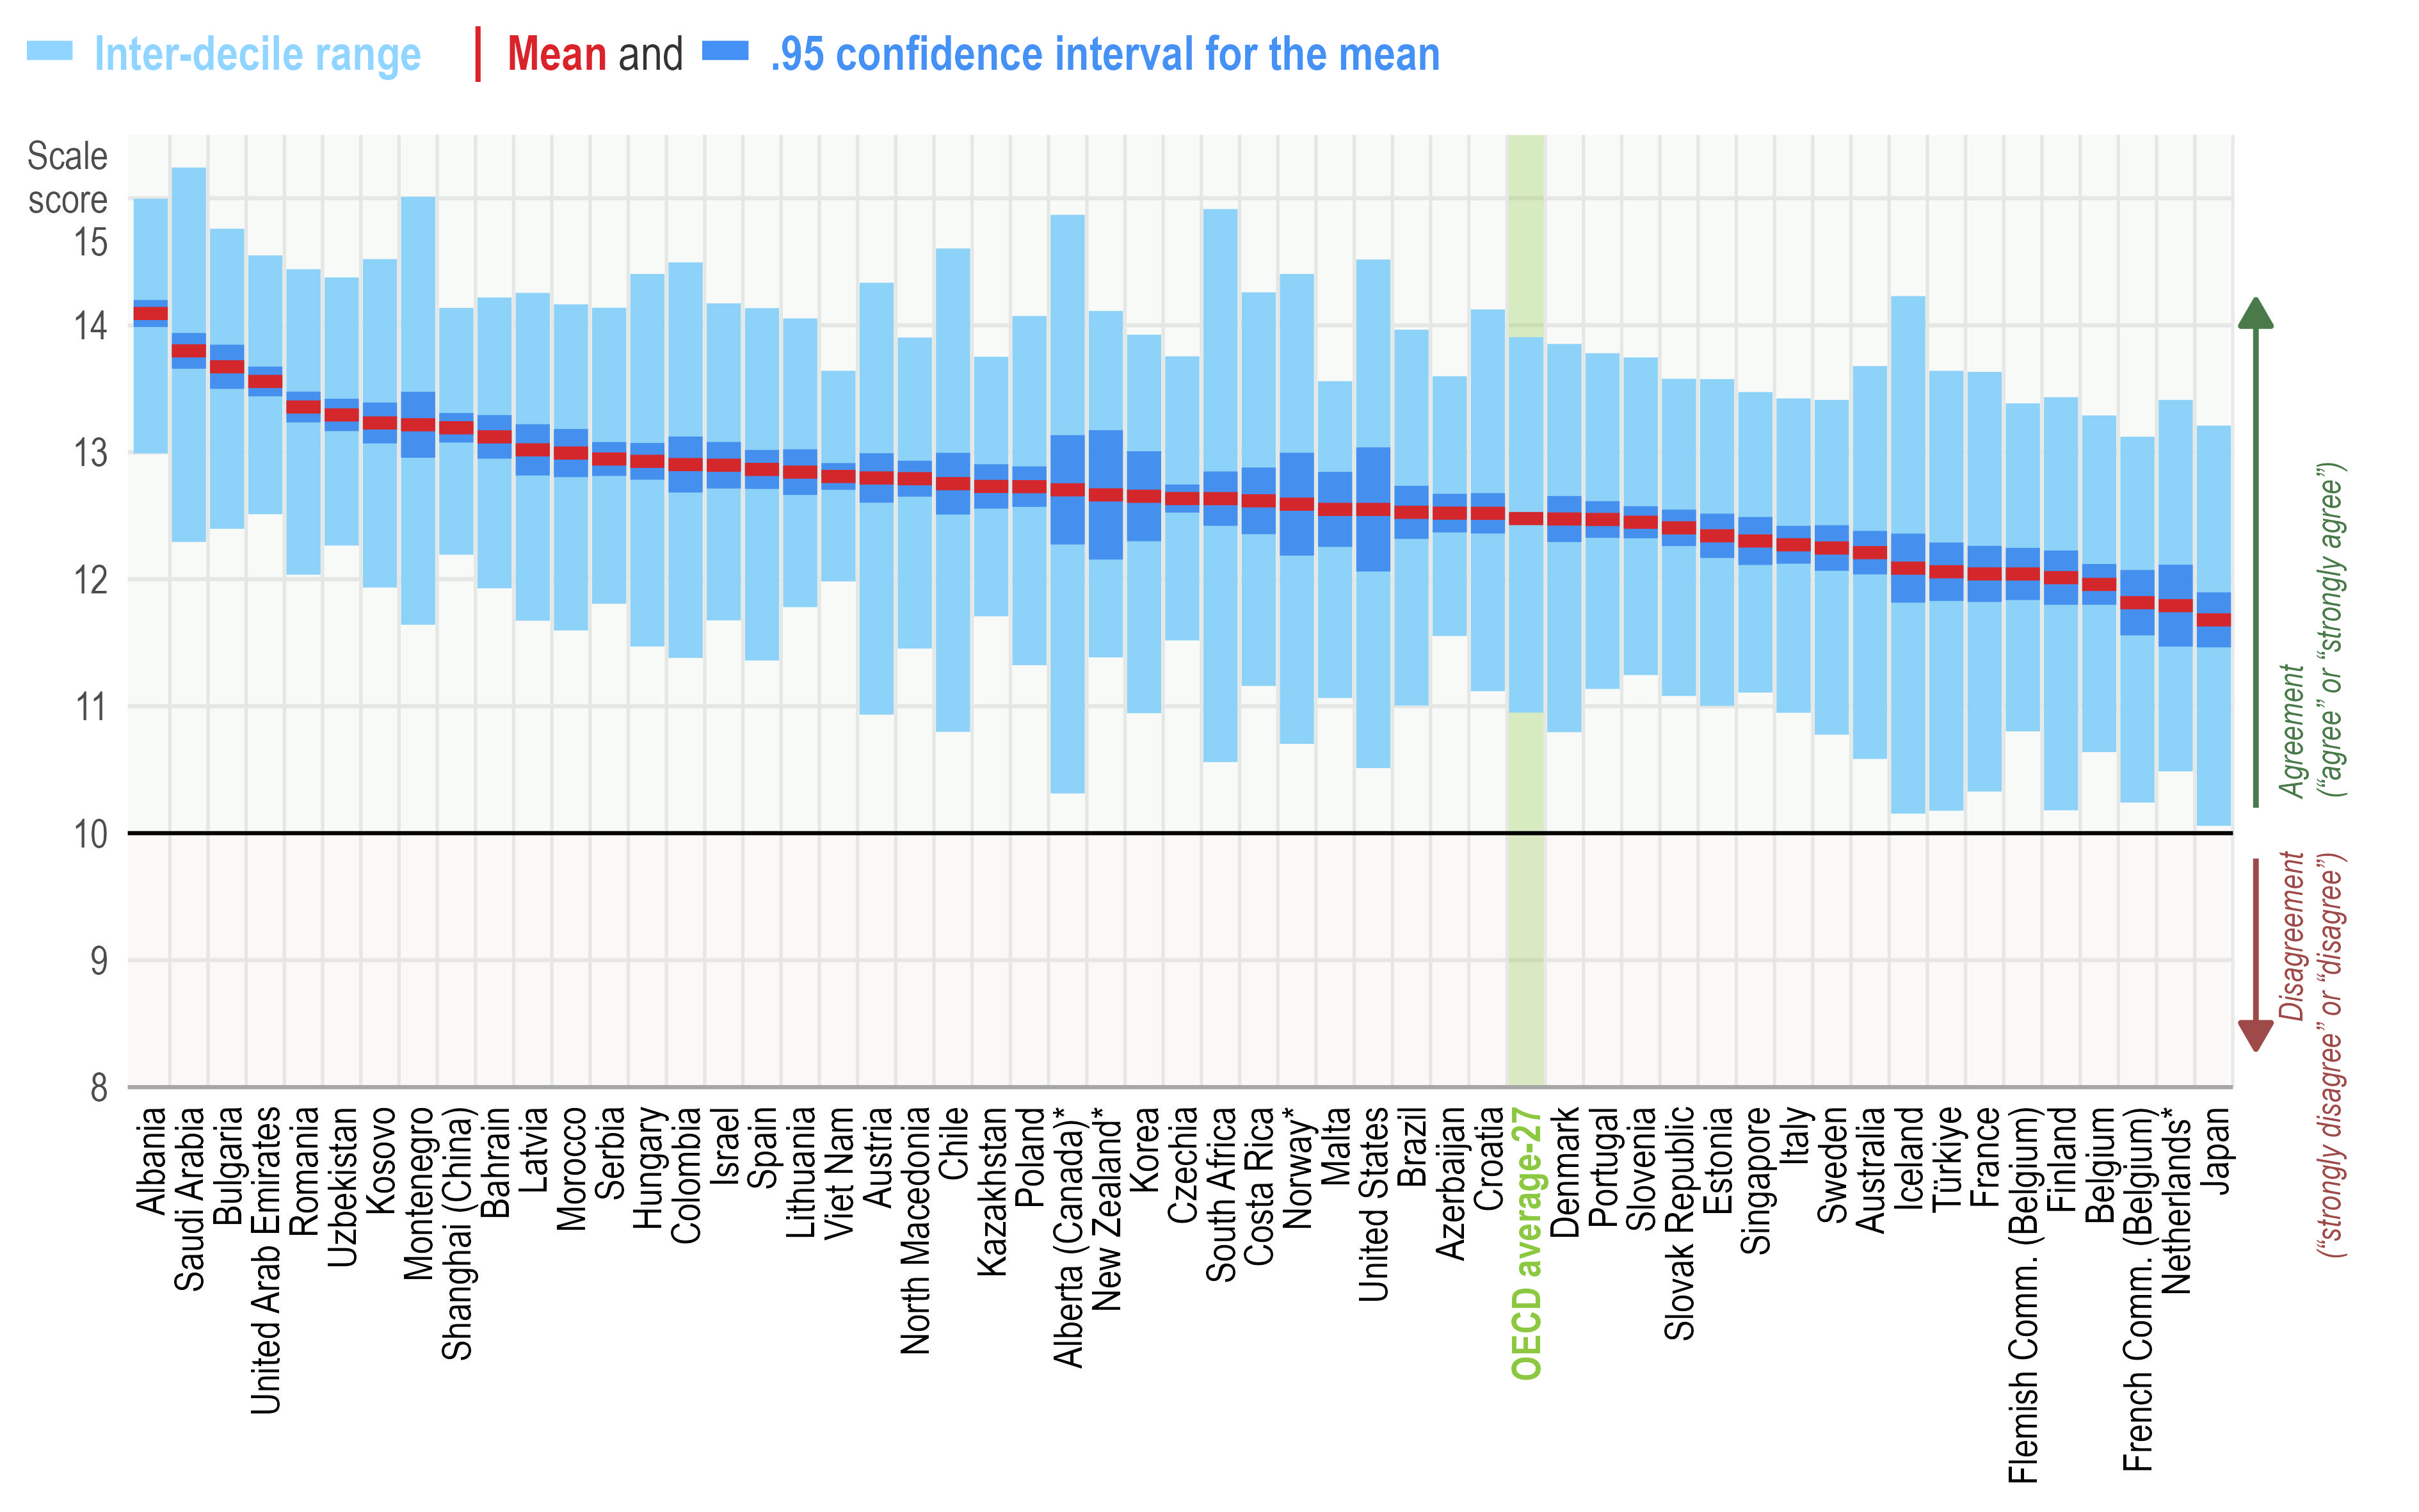
Between-school variation can also be examined through the distribution of school-level averages of principals’ instructional and relational leadership scales (Figure 1.3 and Figure 1.4). The inter-decile range measures the gap between the top 10% and bottom 10% of schools, showing how widely results vary within education systems. This measure also shows that the widest disparities in principals’ instructional and relational leadership (over 3.5 index points, equivalent to almost two standard deviations, between the top and bottom deciles) appear in South Africa, Chile, United States, Alberta (Canada)* and Norway*. Large disparities in perceived leadership between schools may reflect several factors, including differences in school context and resources, variation in principals' leadership styles and working conditions, and broader education policies and governance arrangements. Moreover, systems might support their principals inequitably (Clotfelter et al., 2007[20]), and teachers and principals may be allocated to schools inequitably. For example, according to Grissom, Bartanen and Mitani (2019[21]), schools that have greater shares of disadvantaged and low-achieving students tend to have less qualified and less effective principals.
School-level average of lower secondary principals’ instructional leadership scale
Note: *Estimates should be interpreted with caution due to a higher risk of non-response bias.
Education systems are sorted in descending order according to the mean scale score.
Standardised scale scores with a standard deviation of 2 and the value of 10 corresponding to the item mid-point value of the response scale. Scale scores above 10 indicate positive evaluations of instructional leadership (i.e. agreement), scores below 10 indicate negative evaluations (i.e. disagreement), while scores of exactly 10 indicate indifference (i.e. neither agreement nor disagreement). For more information on the scales, see Annex B.
The inter-decile range measures the gap between the top 10% and bottom 10% of schools, showing how widely perceived instructional leadership vary within education systems.
A 95% confidence interval shows the range within which the true value is likely to lie, taking into account the uncertainty associated with survey estimates. It shows how precise an estimate is: narrower intervals indicate greater precision, while wider intervals indicate greater uncertainty.
Source: OECD, TALIS 2024 Database, Table 1.15.
School-level average of lower secondary principals’ relational leadership scale
Note: *Estimates should be interpreted with caution due to a higher risk of non-response bias.
Education systems are sorted in descending order according to the mean scale score.
Standardised scale scores with a standard deviation of 2 and the value of 10 corresponding to the item mid-point value of the response scale. Scale scores above 10 indicate positive evaluations of relational leadership (i.e. agreement), scores below 10 indicate negative evaluations (i.e. disagreement), while scores of exactly 10 indicate indifference (i.e. neither agreement nor disagreement). For more information on the scales, see Annex B.
The inter-decile range measures the gap between the top 10% and bottom 10% of schools, showing how widely perceived relational leadership vary within education systems.
A 95% confidence interval shows the range within which the true value is likely to lie, taking into account the uncertainty associated with survey estimates. It shows how precise an estimate is: narrower intervals indicate greater precision, while wider intervals indicate greater uncertainty.
Source: OECD, TALIS 2024 Database, Table 1.16.
Figure 1.3 and Figure 1.4 also present school-level average scores for instructional and relational leadership scales. Scores above 10 indicate positive evaluations (agreement), scores below 10 indicate negative evaluations (disagreement), and scores of 10 indicate indifference (neither agreement nor disagreement).4 Although teachers rate their principals’ instructional and relational leadership positively in all education systems, the highest average ratings are observed in Albania, Saudi Arabia, Bulgaria and the United Arab Emirates.
A large body of research highlights that a positive school climate is associated with more effective teaching and learning (OECD, 2025[7]). Studies also show that strong leadership can foster a positive school climate (Leithwood, Harris and Hopkins, 2020[3]; Price and Moolenaar, 2015[22]; Price, 2012[6]), which, in turn, improves teachers’ workplace conditions and teacher job satisfaction.
Increased collaboration
Teachers’ relationships with students, colleagues, principals, parents and the wider community shape how effective teachers are. The quality of school communities is central to teachers’ experiences and outcomes (Muckenthaler et al., 2020[23]; Kelly, Merry and Gonzalez, 2018[24]). TALIS 2024 results show that teachers who report good professional relationships with principals, parents, guardians, students and other teachers have higher well-being and job satisfaction. These relationships are stronger predictors of job satisfaction than salary satisfaction (OECD, 2025[25]).
Change in the likelihood of lower secondary teachers’ "agree[ing]" or "strongly agree[ing]" with the following statements1 associated with a one-unit increase in the scales of lower secondary principals’ instructional and relational leadership2,3
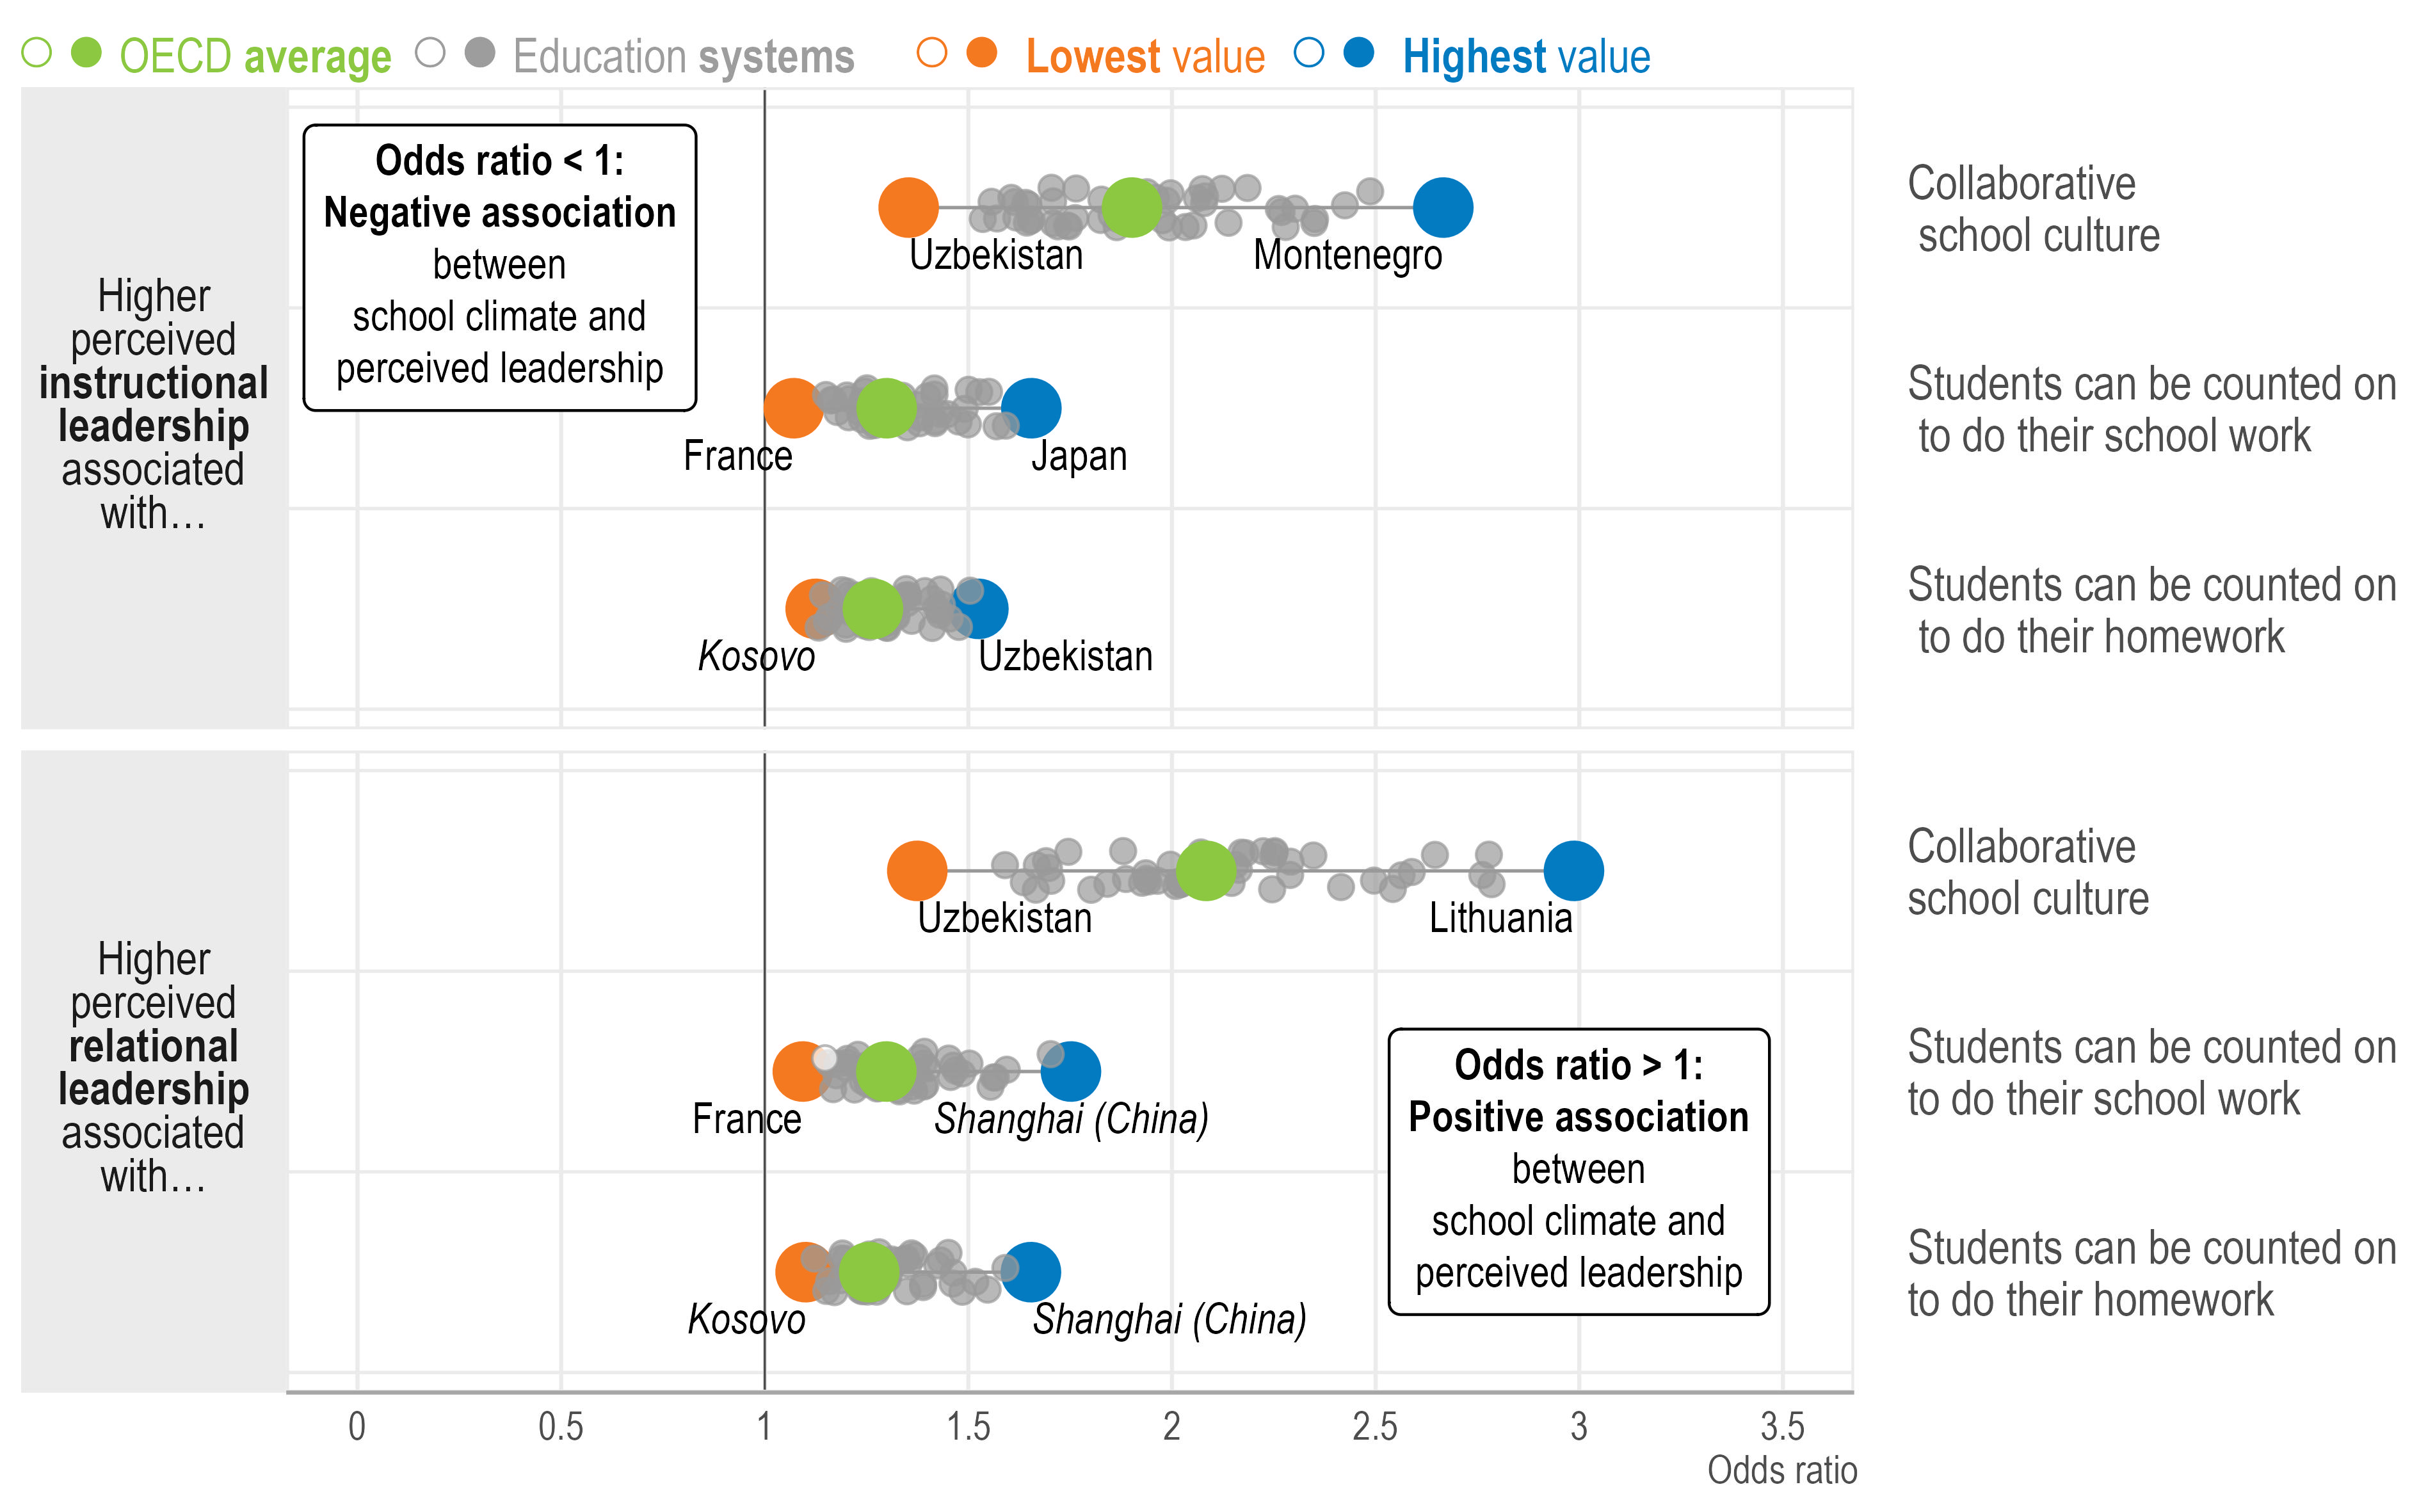
Note: Statistically significant coefficients are highlighted with filled circles (see Annex B). Filled circles above 1 indicate a positive association, while those below 1 reflect a negative relationship.
1. Binary variables: the reference category refers to “strongly disagree” and “disagree”.
2. Standardised scale scores with a standard deviation of 2 and the value of 10 corresponding to the item mid-point value of the response scale. For more information on the scales, see Annex B.
3. Results are based on separate teacher-level binary logistic regression analyses controlling for teacher characteristics (i.e. gender and age [standardised at the international level]) and school characteristics (i.e. school governance type, school size and school intake of students from socio-economically disadvantaged homes).
Source: OECD, TALIS 2024 Database, Tables 1.17, 1.18 and 1.19.
TALIS asks teachers how much they agree (“strongly disagree”; “disagree”; “agree”; “strongly agree”) that their school has a collaborative culture characterised by mutual support. Regression analysis indicates a positive link between valued leadership and a collaborative climate across education systems (Figure 1.5). In other words, when comparing teachers with similar individual and school characteristics, those who have a more positive view of their principals are, on average, more likely to report a collaborative school culture. As with all regression analyses in this report, this comparison identifies an association between the two factors, but does not establish that one factor causes the other. These findings are aligned with TALIS 2013 results, which also showed a positive relationship between instructional leadership and teacher collaboration (OECD, 2016[26]).
Greater engagement with school and homework
A positive academic climate, characterised by engaged students, is linked to strong teaching and learning outcomes (Wang and Degol, 2016[27]). Supportive school environments that motivate students to learn is correlated with increased student engagement and performance (OECD, 2024[28]).
TALIS measures students' engagement in learning by asking teachers about their agreement (“strongly disagree”; “disagree”; “agree”; “strongly agree”) with the following statements regarding their school: “Students can be counted on to do their school work”; “Students can be counted on to do their homework”.
In all education systems, teachers who have a positive view about their principals’ instructional and relational leadership are more likely to report that students can be counted on to do their school work and homework (Figure 1.5). However, teachers working in schools where students are more engaged may also be more likely to view their principals positively because they work in a more favourable school context. Yet, this finding reflects how principals can create a school climate with clear expectations, supportive relationships and student accountability. This encourages students to complete their school work and homework. Sebastian and Allensworth (2012[11]) finds that principal leadership influences instruction quality and student achievement primarily through its impact on a school learning climate characterised by greater academic aspirations.
Fewer classroom disruptions
Ensuring a positive disciplinary climate is key to instructional quality (OECD, 2025[7]). The less time spent on classroom management, the more time there is for actual teaching and learning. TALIS captures disciplinary climate by the scale of perceived classroom disruption. This is based on teacher responses ("not at all"; "to some extent"; "quite a bit"; "a lot") about the extent to which the following situations can occur: “There is much disruptive noise and disorder”; “I have to wait a long time for students to quiet down”; “Many students don’t start working for a long time after the lesson begins”; “I lose quite a lot of time because students interrupt the lesson”.
Regression analysis indicates a negative association between valued leadership and disruptive classroom climate (Figure 1.6). In many education systems, the more highly teachers rate their principals’ instructional and relational leadership, the fewer classroom disciplinary issues there are. This may reflect that teachers in schools with a more positive disciplinary climate view their principals more favourably, or that principals can foster a positive and orderly school climate through clear expectations and supportive relationships. Research shows that schools with stronger leaders are more likely to be safe and orderly, even when serving similar student populations (Sebastian and Allensworth, 2012[11]).
Change in the following scales1 associated with a one-unit increase in the scales of lower secondary principals’ instructional and relational leadership1,2
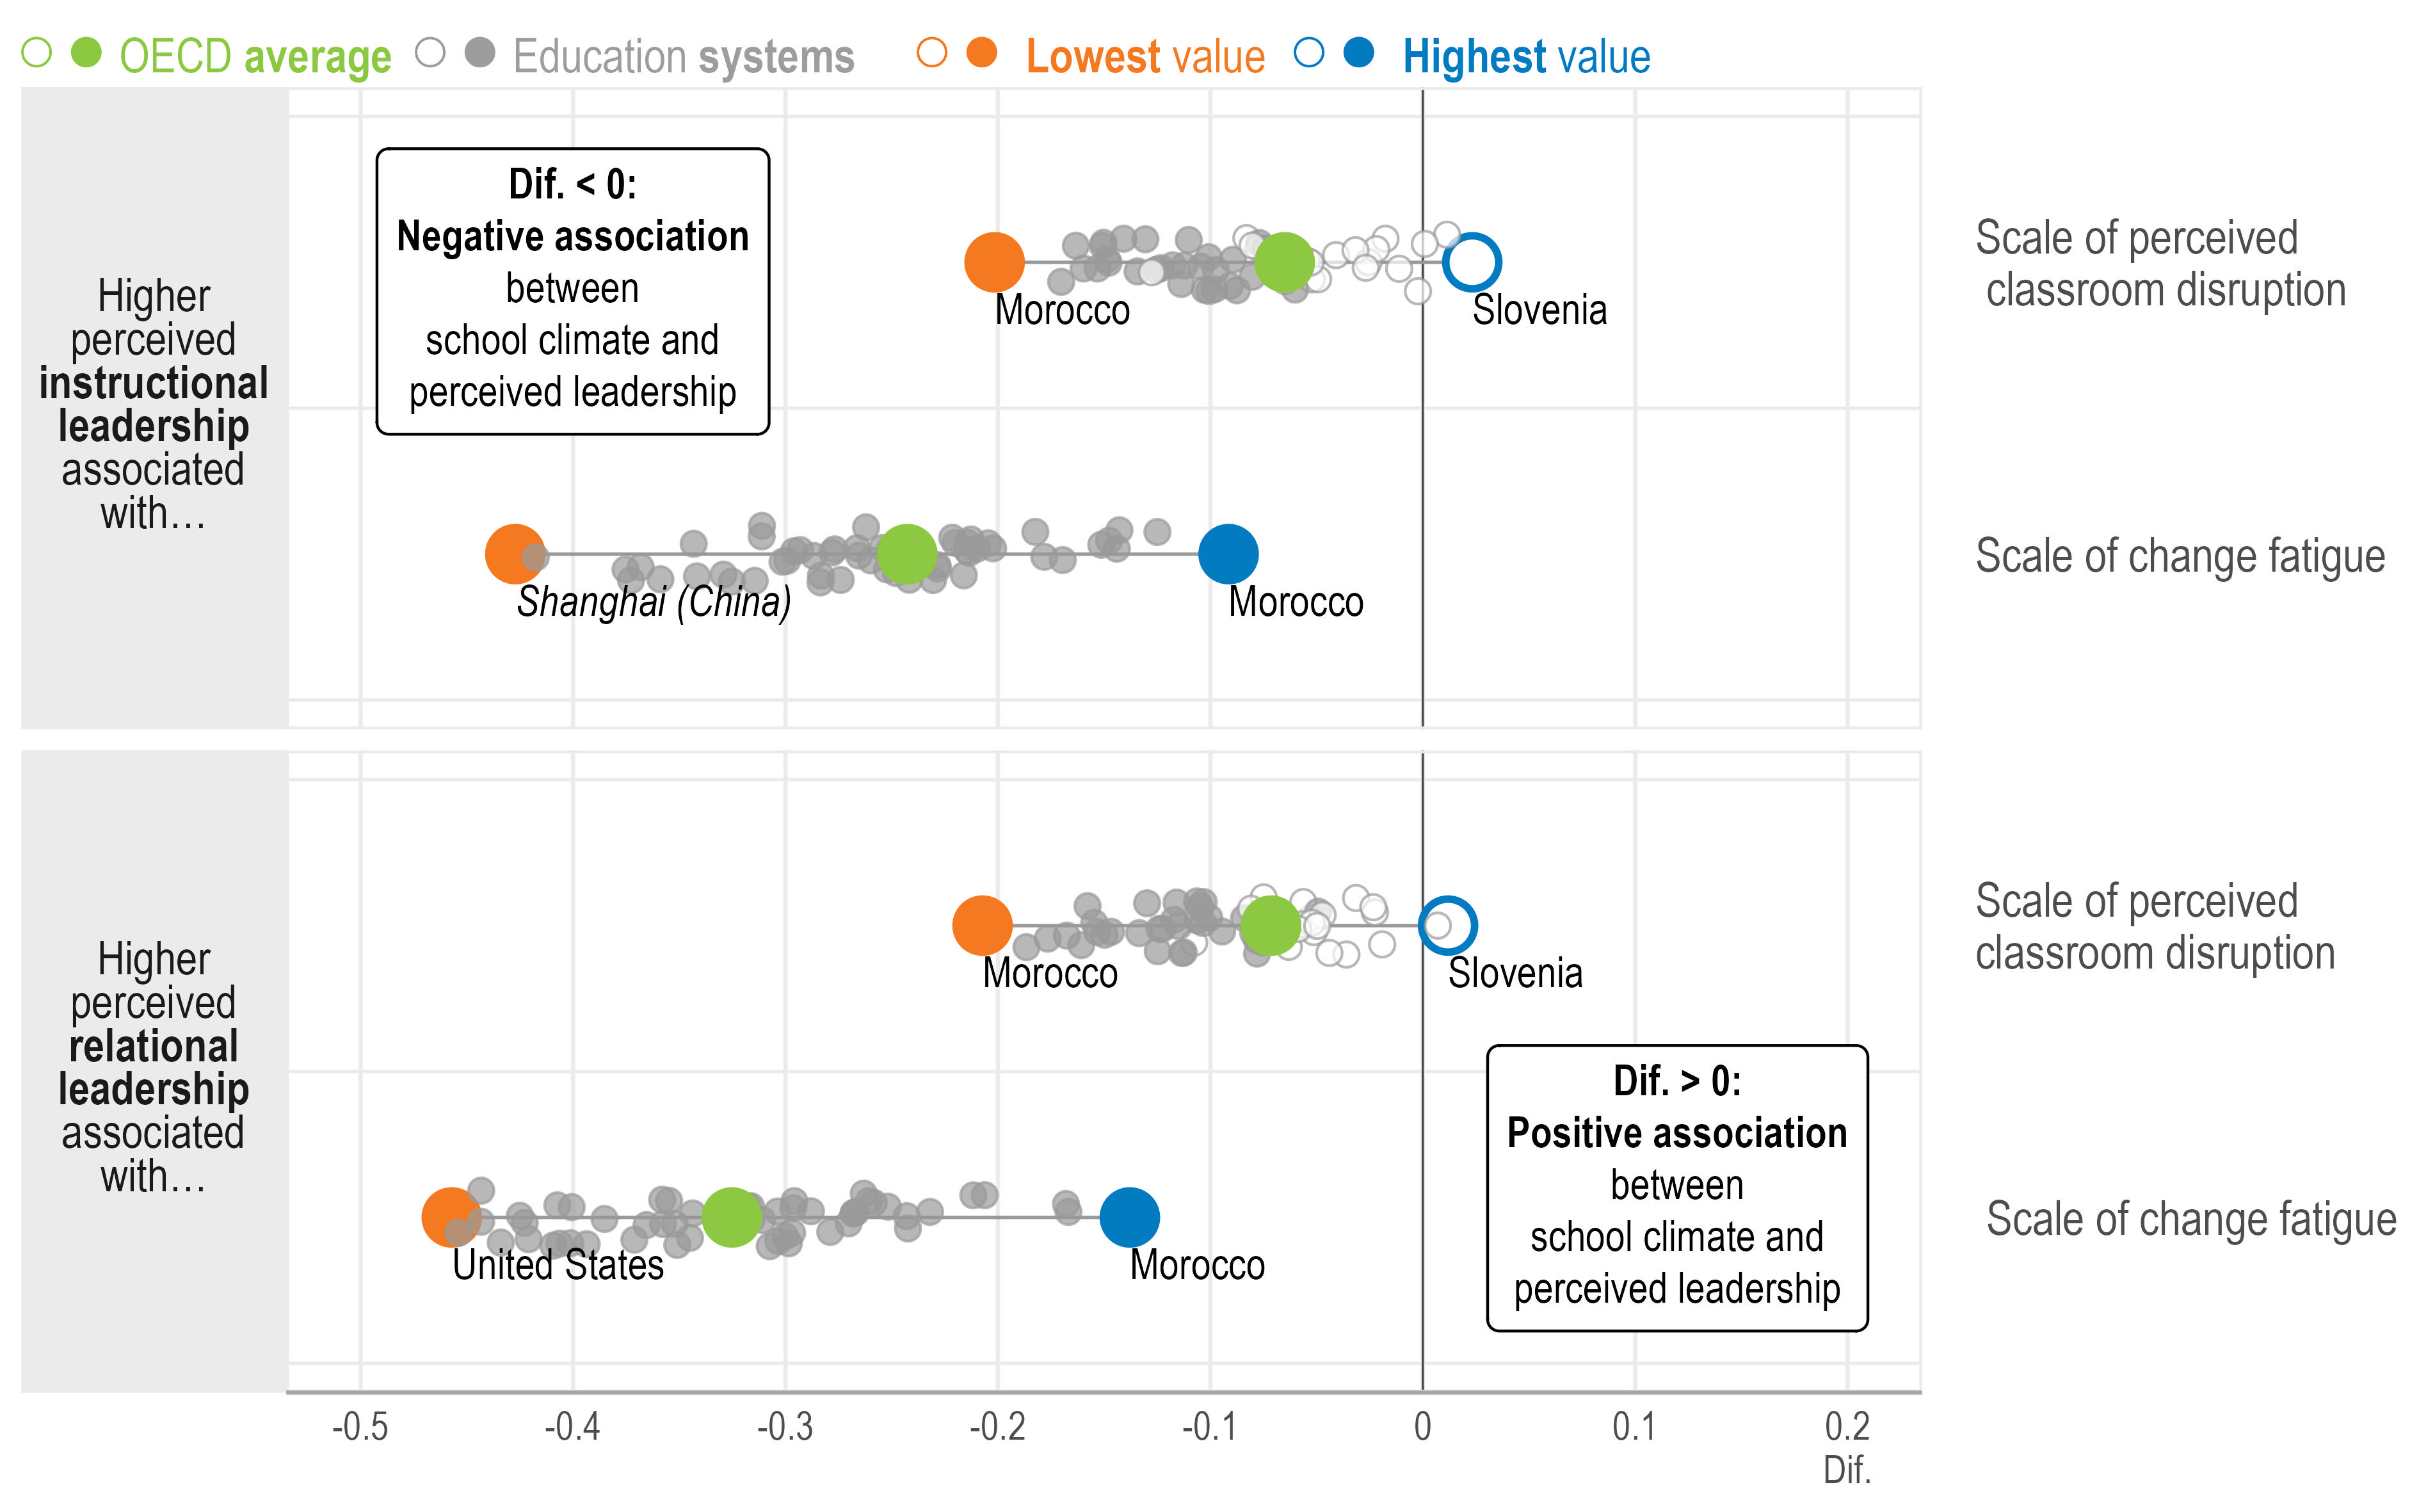
Note: Statistically significant coefficients are highlighted with filled circles (see Annex B). Filled circles above 0 indicate a positive association, while those below 0 reflect a negative relationship.
1. Standardised scale scores with a standard deviation of 2 and the value of 10 corresponding to the item mid-point value of the response scale. For more information on the scales, see Annex B.
2. Results are based on separate teacher-level linear regression analyses controlling for teacher characteristics (i.e. gender and age [standardised at the international level]) and school characteristics (i.e. school governance type, school size and school intake of students from socio-economically disadvantaged homes).
Source: OECD, TALIS 2024 Database, Tables 1.20 and 1.21.
More receptive to change
Educational reforms respond to societal, economic and technological change, but poorly managed change leads to unsuccessful reforms and increased teacher stress. TALIS 2024 results suggest that a strong adaptive climate characterised by well-managed change processes may be as important as resource investment in reducing teacher stress (OECD, 2025[25]). Although reforms and changing requirements are often initiated by national, regional or local authorities, principals play a central role in supporting change at the school level.
TALIS measures adaptive climate via the scale of change fatigue, which is constructed using teacher responses ("strongly disagree"; "disagree"; "agree"; "strongly agree") about their attitudes and feelings towards changes in their school, regardless of whether these were initiated by the school or externally (“I am tired of all the changes in this school”; “We are asked to change too many things in this school”; “It feels like we are always being asked to change something around here”; “I am asked to implement change initiatives without the necessary resources”).
Regression analysis highlights a negative relationship between valued leadership and teachers’ change fatigue (Figure 1.6). Teachers who value their principals’ instructional and relational leadership tend to be less disillusioned by change at school, although teachers who are less disillusioned by change may also be more likely to view their principals’ leadership positively. These relationships are observed in all education systems. This finding indicates that principals who provide clear direction and maintain constructive relationships can help teachers feel more supported, receptive and resilient to change. This suggests that the quality of support matters more than the breadth or pace of the changes teachers are expected to adapt to.
Teachers are central to delivering education and shaping student outcomes (Chetty, Friedman and Rockoff, 2014[29]; Chetty, Friedman and Rockoff, 2014[30]; Rivkin, Hanushek and Kain, 2005[31]). Principals support teachers to thrive professionally through their influence on staff motivation, capacity and working conditions (Leithwood, Harris and Hopkins, 2020[3]).
Regression analyses show that valued leadership is positively correlated with several professional outcomes for teachers in nearly all education systems (Figure 1.7), including:
Self-efficacy: TALIS measures teacher self-efficacy in classroom management, instruction and student engagement by asking teachers how well (“not at all”; “to some extent”; “quite a bit”; “a lot”) they can perform tasks in these areas. Higher teacher self-efficacy is linked to stronger instructional practices and better student outcomes (Holzberger, Philipp and Kunter, 2013[32]; Caprara et al., 2006[33]).
Fulfilment of lesson aims: TALIS 2024 asked teachers to what extent (“not at all”; “to some extent”; “quite a bit”; “a lot”) the lessons they taught over the past week in the target class achieved some goals, even when they are often in competition with each other. The TALIS scale of fulfilment of lesson aims covers the following areas: teaching clarity (“presenting the content in a comprehensible way”), cognitive activation (“engaging students in work that challenges them”), feedback (“providing students with feedback to support their learning”), support for consolidation (“offering students opportunities to practice what they learned”) and adapting teaching to students’ different needs.
Well-being: TALIS measures teacher well-being by asking teachers how much (“not at all”; “to some extent”; “quite a bit”; “a lot”) stress and health issues they experience in their work. Does their job leave them time for personal life? Does their job negatively impact their mental health? Does their job negatively impact their physical health? Low teacher well-being can lead to higher turnover, absenteeism, lower performance and reduced instructional quality (Ingersoll, 2001[34]; Ronfeldt, Loeb and Wyckoff, 2013[35]; Viac and Fraser, 2020[36]).
Job satisfaction: TALIS measures job satisfaction by asking teachers to rate their agreement (“strongly disagree”; “disagree”; “agree”; “strongly agree”) with statements about the positive and negative aspects of their profession (“The advantages of being a teacher clearly outweigh the disadvantages”; “If I could decide again, I would still choose to work as a teacher”; “I regret that I decided to become a teacher”; “All in all, I am satisfied with my job”) and work environment (“I would like to change to another school if that were possible”; “I enjoy working at this school”; “I would recommend this school as a good place to work”). Teacher job satisfaction benefits teachers, school culture and student outcomes (OECD, 2025[7]). It is positively associated with teacher self-efficacy (OECD, 2025[25]; 2014[37]) and stronger student achievement (Banerjee et al., 2017[38]).
Figure 1.7 shows that, among teacher outcomes examined, job satisfaction is most strongly associated with valued leadership. Teachers with more positive views of their principals’ leadership tend to report higher job satisfaction, although the direction of this relationship cannot be determined.
Change in the following scales1 associated with a one-unit increase in the scales of lower secondary principals’ instructional and relational leadership1,2
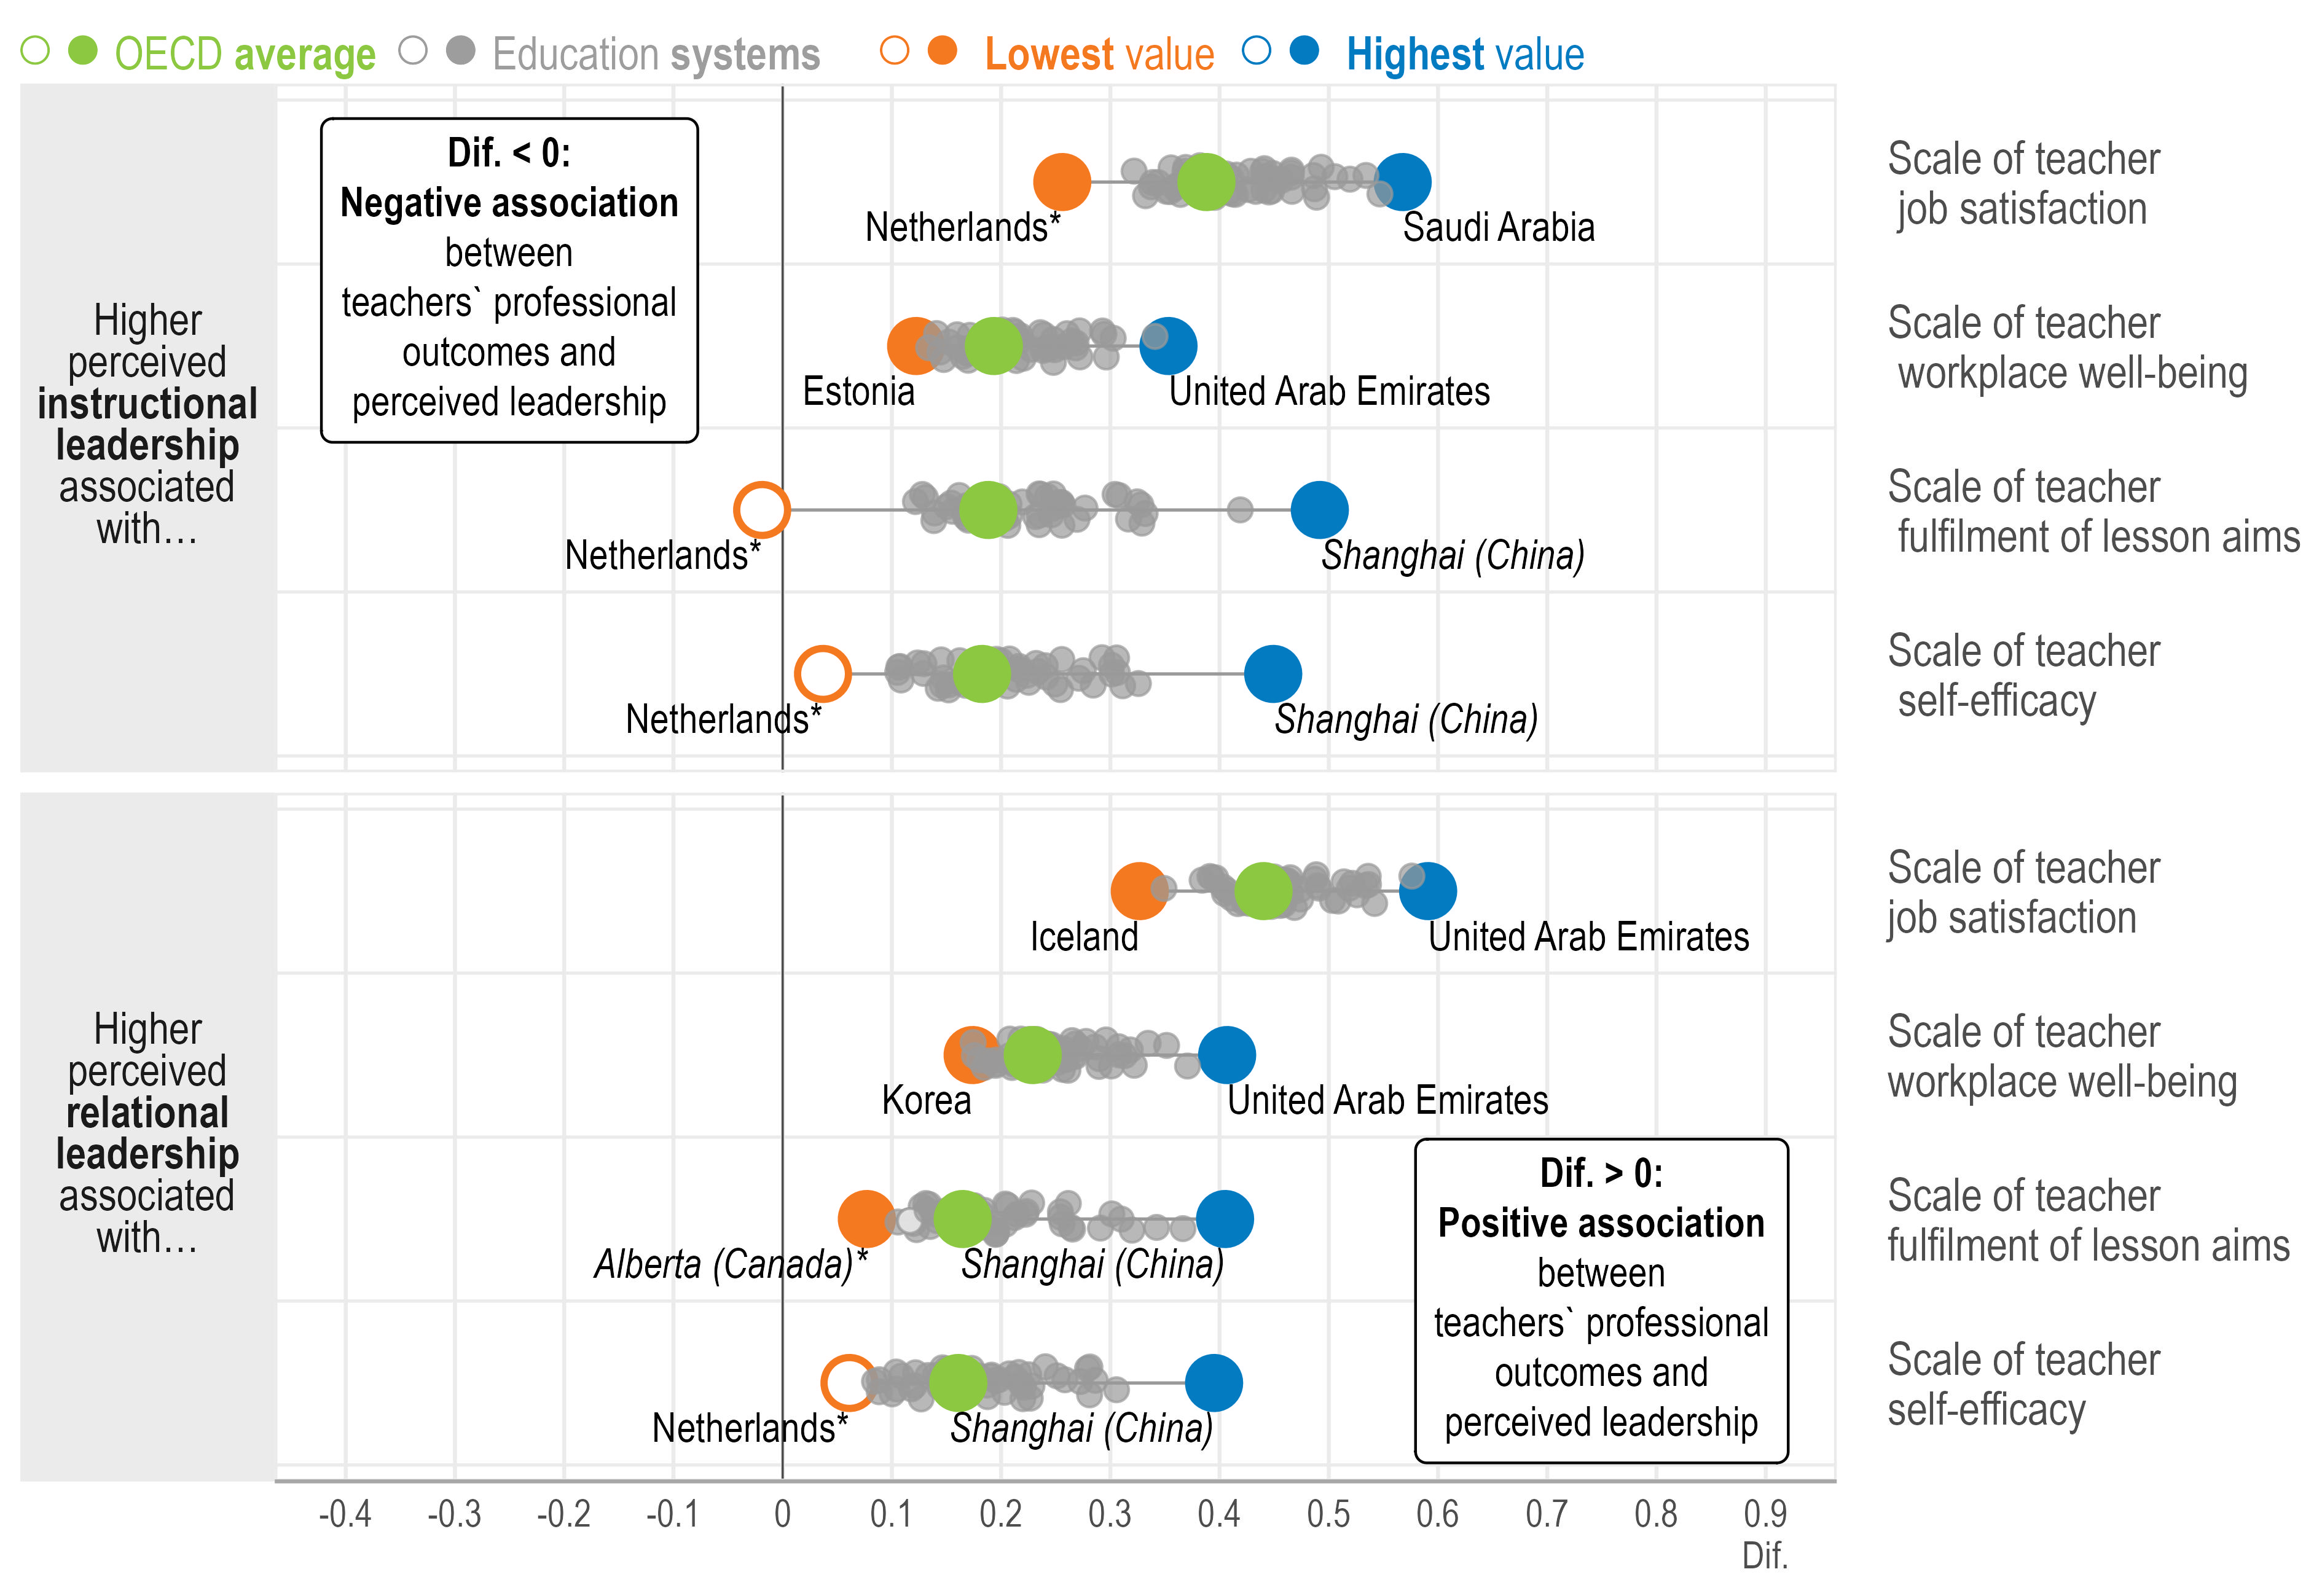
Note: *Estimates should be interpreted with caution due to a higher risk of non-response bias.
Statistically significant coefficients are highlighted with filled circles (see Annex B). Filled circles above 0 indicate a positive association, while those below 0 reflect a negative relationship.
1. Standardised scale scores with a standard deviation of 2 and the value of 10 corresponding to the item mid-point value of the response scale. The workplace well-being scale refers to the inverted workplace well-being and stress scale. For more information on the scales, see Annex B.
2. Results are based on separate teacher-level linear regression analyses controlling for teacher characteristics (i.e. gender and age [standardised at the international level]) and school characteristics (i.e. school governance type, school size and school intake of students from socio-economically disadvantaged homes).
Source: OECD, TALIS 2024 Database, Tables 1.22, 1.23, 1.24 and 1.25.
Instructional and relational leadership
On average, at least 88% of primary teachers value their principals’ instructional leadership. Australia, Japan and the Netherlands* stand out as education systems where primary teachers rate instructional leadership more highly on principals’ encouraging their teachers to improve their skills, collaborate with each other and feel responsibility for students’ learning outcomes (Table 1.2).
A similar pattern emerges for relational leadership. France, Japan and the Netherlands* are the only education systems where primary teachers rate relational leadership more highly across all four TALIS measures of principals’ having a clear vision for the school, encouraging staff to have a say on important decisions, nurturing good professional relationships with staff and parents or guardians (Table 1.3).
Variation in valued leadership between education systems, schools and teachers
At the primary level, the between-education system share of variation across education levels (i.e. primary vs. lower secondary) is smaller than the within-system variation at lower secondary education (7% for instructional, 5% for relational) (Tables 1.4 and 1.5). Within education systems, on average, the bulk of variation sits within schools (83% for instructional, 76% for relational). In Japan, the share of within-school variation in perceived relational leadership at the primary level is 8 percentage points larger compared to lower secondary level (Table 1.9). The widest disparities in instructional and relational leadership (over 3.8 index points, equivalent to almost 2 standard deviations, between the top and bottom deciles) appear in France and Türkiye (Tables 1.15 and 1.16).
More experienced primary teachers tend to not rate their principals' relational leadership as highly, with Spain and Türkiye showing particularly strong negative associations – though this pattern does not extend to instructional leadership in primary education (Table 1.12). As in lower secondary education, teachers who are more satisfied with their profession and who feel valued and influential in policy matters tend to view their principals' leadership more favourably in most education systems (Tables 1.13 and 1.14).
School climate, professional outcomes and staffing
Similar to lower secondary level, valued leadership is associated with positive school climate and better professional outcomes for teachers at the primary level (Tables 1.17, 1.18, 1.19, 1.20, 1.21, 1.22, 1.23, 1.24, 1.25, 1.26 and 1.27).
Primary teachers who approve of their principals' leadership more highly are less likely to want to leave teaching – a pattern that holds for both leadership types in the Flemish Community of Belgium*, Brazil, Saudi Arabia, Slovenia and the United Arab Emirates (Table 1.28). A similar negative link is also found in primary education between principals reporting shortages of qualified teachers and their perceived instructional and relational leadership, notably in France, Slovenia and the Netherlands* (Table 1.29).
Note: *Estimates should be interpreted with caution due to a higher risk of non-response bias.
Some education systems face challenges related to teacher mobility and workforce renewal (UNESCO, 2024[39]). In many systems, however, growing teacher shortages are the more pressing concern (OECD, 2024[40]; OECD, 2024[41]; UNESCO, 2024[39]). Ensuring an adequate supply of motivated and capable teachers is a key priority for principals.
Principals play a key role in managing school resources strategically to maximise performance (Grissom, Egalite and Lindsay, 2021[42]; Sebastian et al., 2019[43]). Since teachers are schools’ most critical resources, creating a supportive environment for them is essential to effective pedagogical management. Principals can contribute to this by fostering a positive school climate and improving working conditions (Leithwood, Harris and Hopkins, 2020[3]). This helps reduce turnover (Kraft et al., 2016[44]; Ladd, 2011[45]).
Drawing on TALIS 2024 data on teachers’ career intentions (i.e. how many years they intend to continue working as teachers) and principals’ views on how much (“not at all”; “to some extent”; “quite a bit”; “a lot”) staff shortages affect the quality of teaching, this section explores the link between staffing and perceived leadership.
In almost two-thirds of education systems, among teachers who are not about to retire, those who give their principals a high rating on relational leadership are less likely to plan to leave the profession within five years, barring retirement (Figure 1.8). In over half of education systems, a similar link is observed between teachers’ intentions to quit the profession and principals’ instructional leadership (Table 1.28). Darling-Hammond et al. (2026[4]) argues that effective principals retain teachers by fostering a strong shared mission and supporting teachers both individually and collectively.
Change in the likelihood of lower secondary teachers reporting their intention to leave teaching within the next five years1 associated with a one-unit increase in the scale of principals’ relational leadership2,3
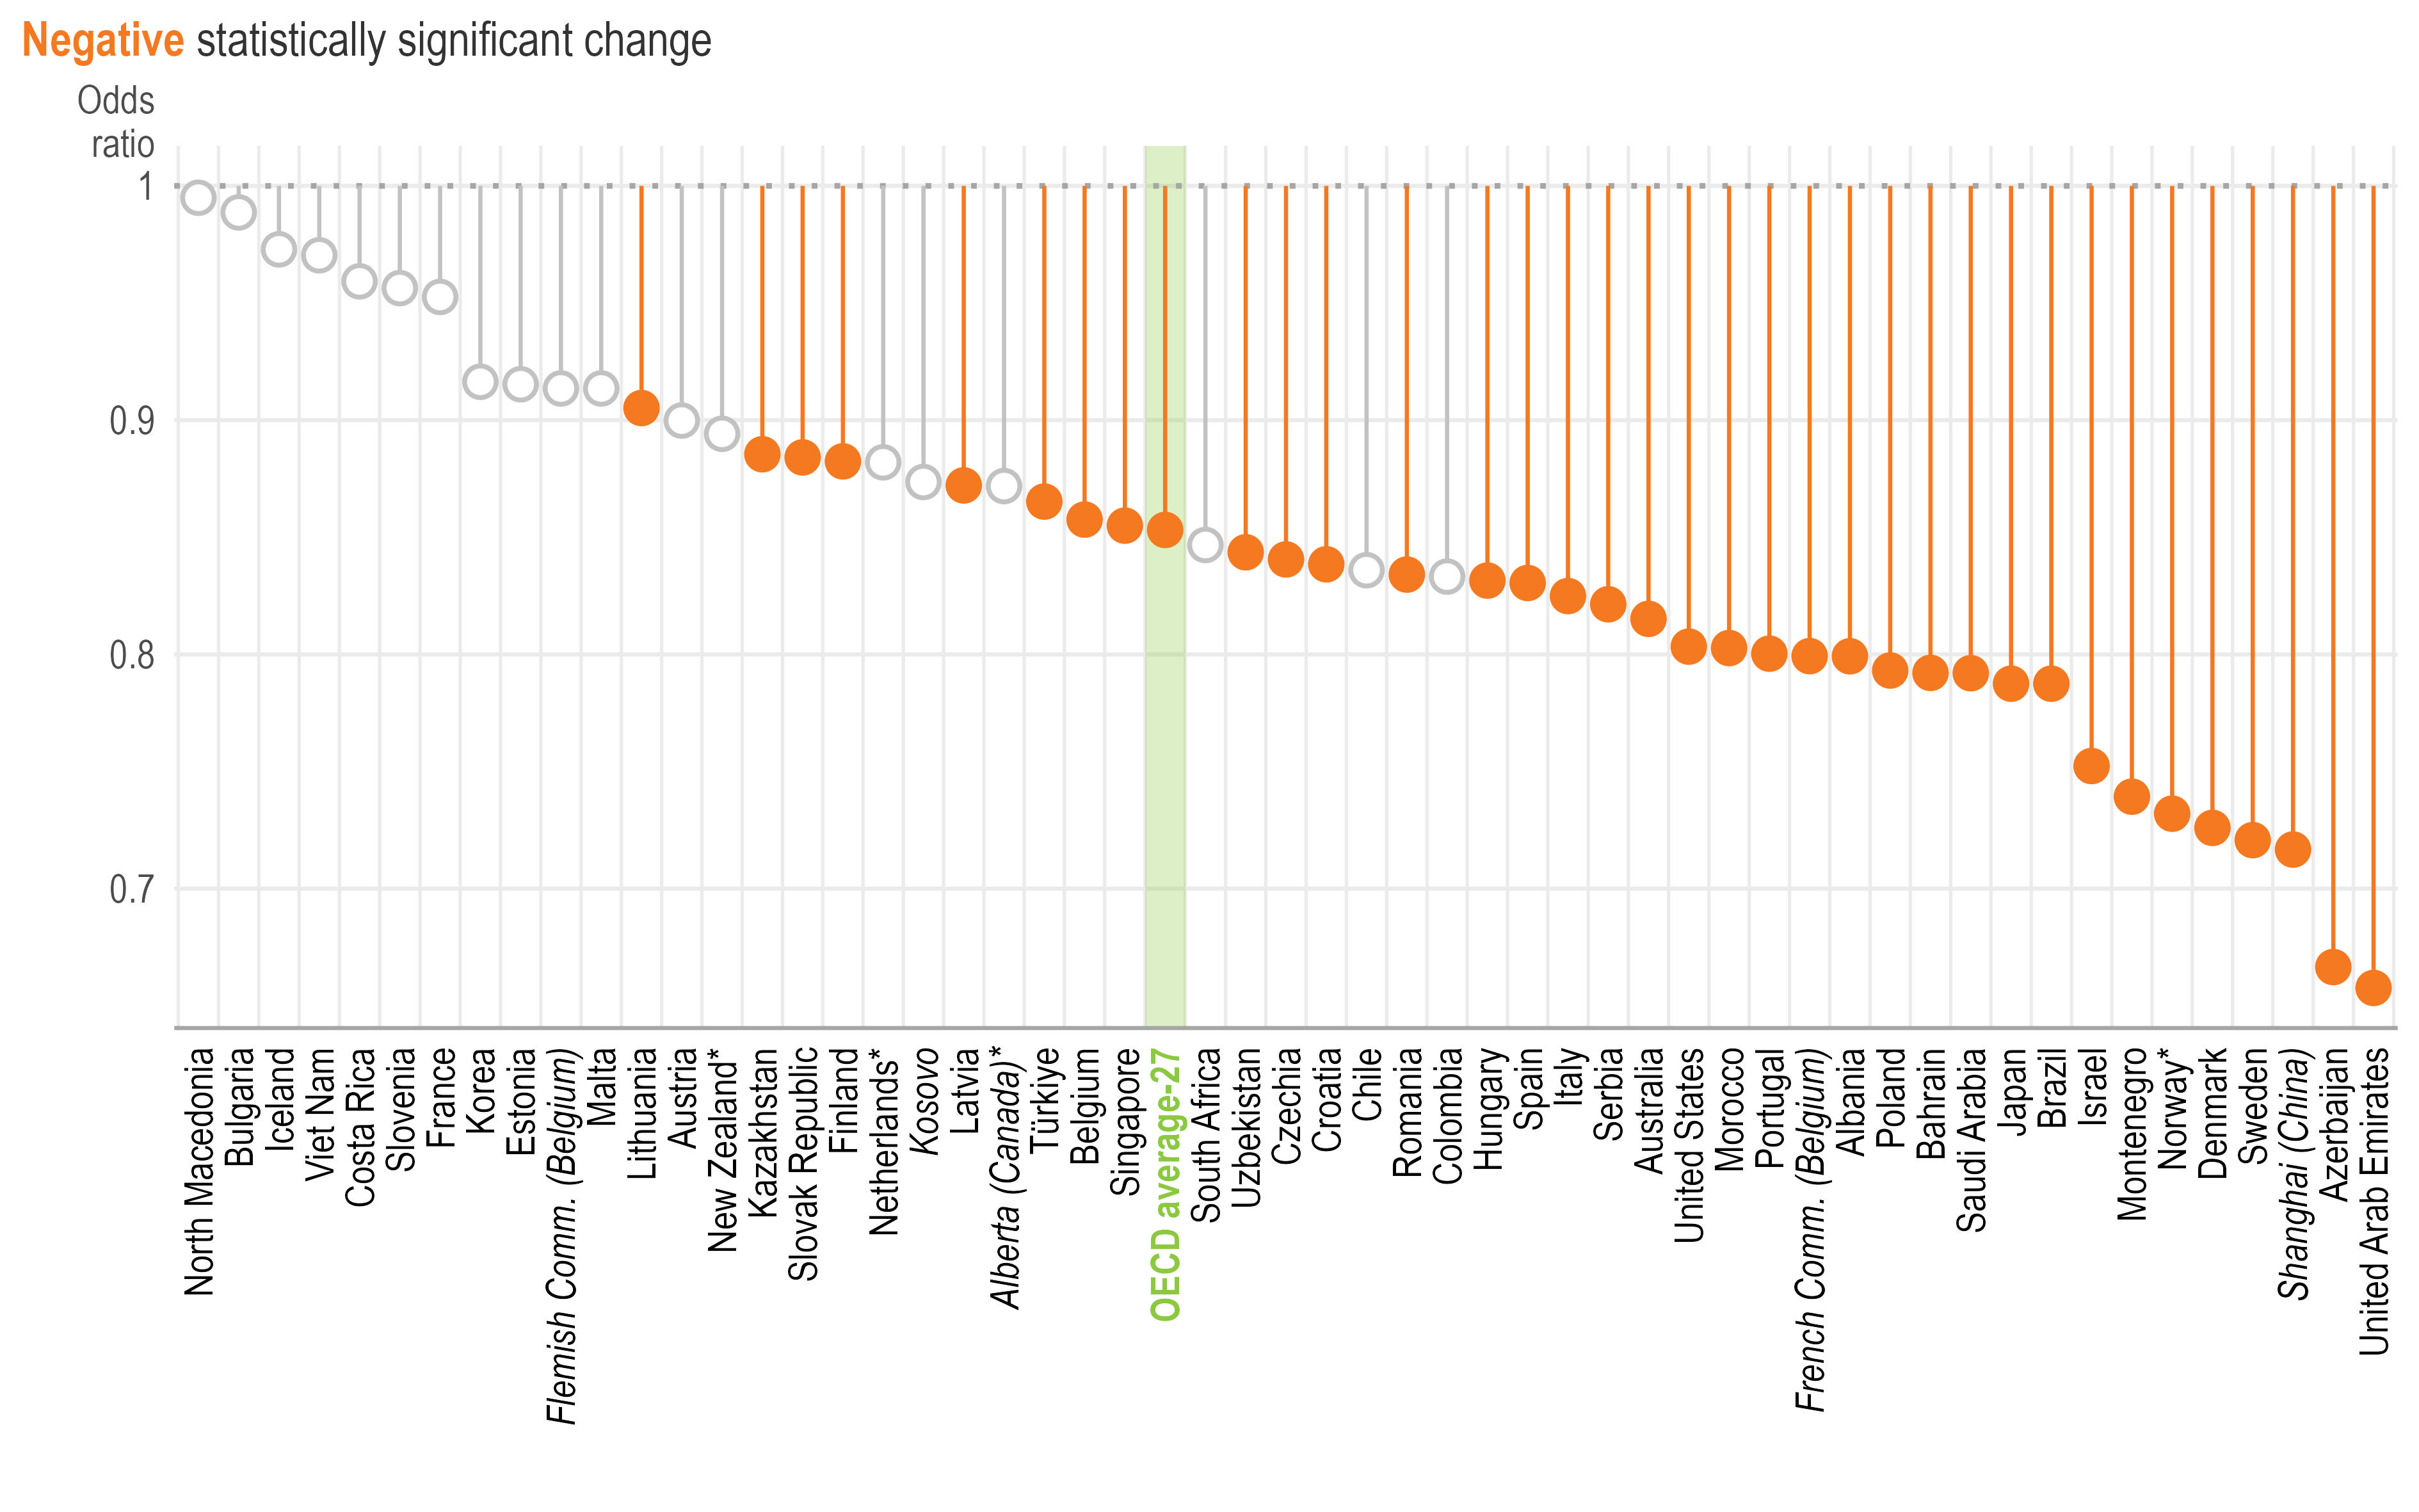
Note: *Estimates should be interpreted with caution due to a higher risk of non-response bias.
Statistically significant coefficients are highlighted with filled circles (see Annex B). Filled circles above 1 indicate a positive association, while those below 1 reflect a negative relationship.
The analysis is restricted to teachers who report that retirement from work sector is “not at all likely” or “not very likely” to lead them to leave teaching within the next five years.
1. Binary variables: the reference category refers to teachers reporting that they want to continue working as a teacher for more than five years.
2. Standardised scale scores with a standard deviation of 2 and the value of 10 corresponding to the item mid-point value of the response scale. For more information on the scales, see Annex B.
3. Results are based on teacher-level binary logistic regression analysis controlling for teacher characteristics (i.e. gender and age [standardised at the international level]) and school characteristics (i.e. school governance type, school size and school intake of students from socio-economically disadvantaged homes).
Source: OECD, TALIS 2024 Database, Table 1.28.
Based on TALIS 2024 data, around 20% of teachers work in schools where principals say the quality of teaching, on average, is perceived to be hindered by the shortage of qualified teachers, (OECD, 2025[25]). Between 2018 and 2024, complaints of this issue increased in 16 education systems, with the largest increase observed in the Netherlands* and Malta (32 percentage points more).
Change in the likelihood of lower secondary principals reporting that the school’s capacity to provide quality instruction is currently hindered “quite a bit” or “a lot” by a shortage of qualified teachers1 associated with a one-unit increase in the school-level average of principals’ relational leadership scale2,3
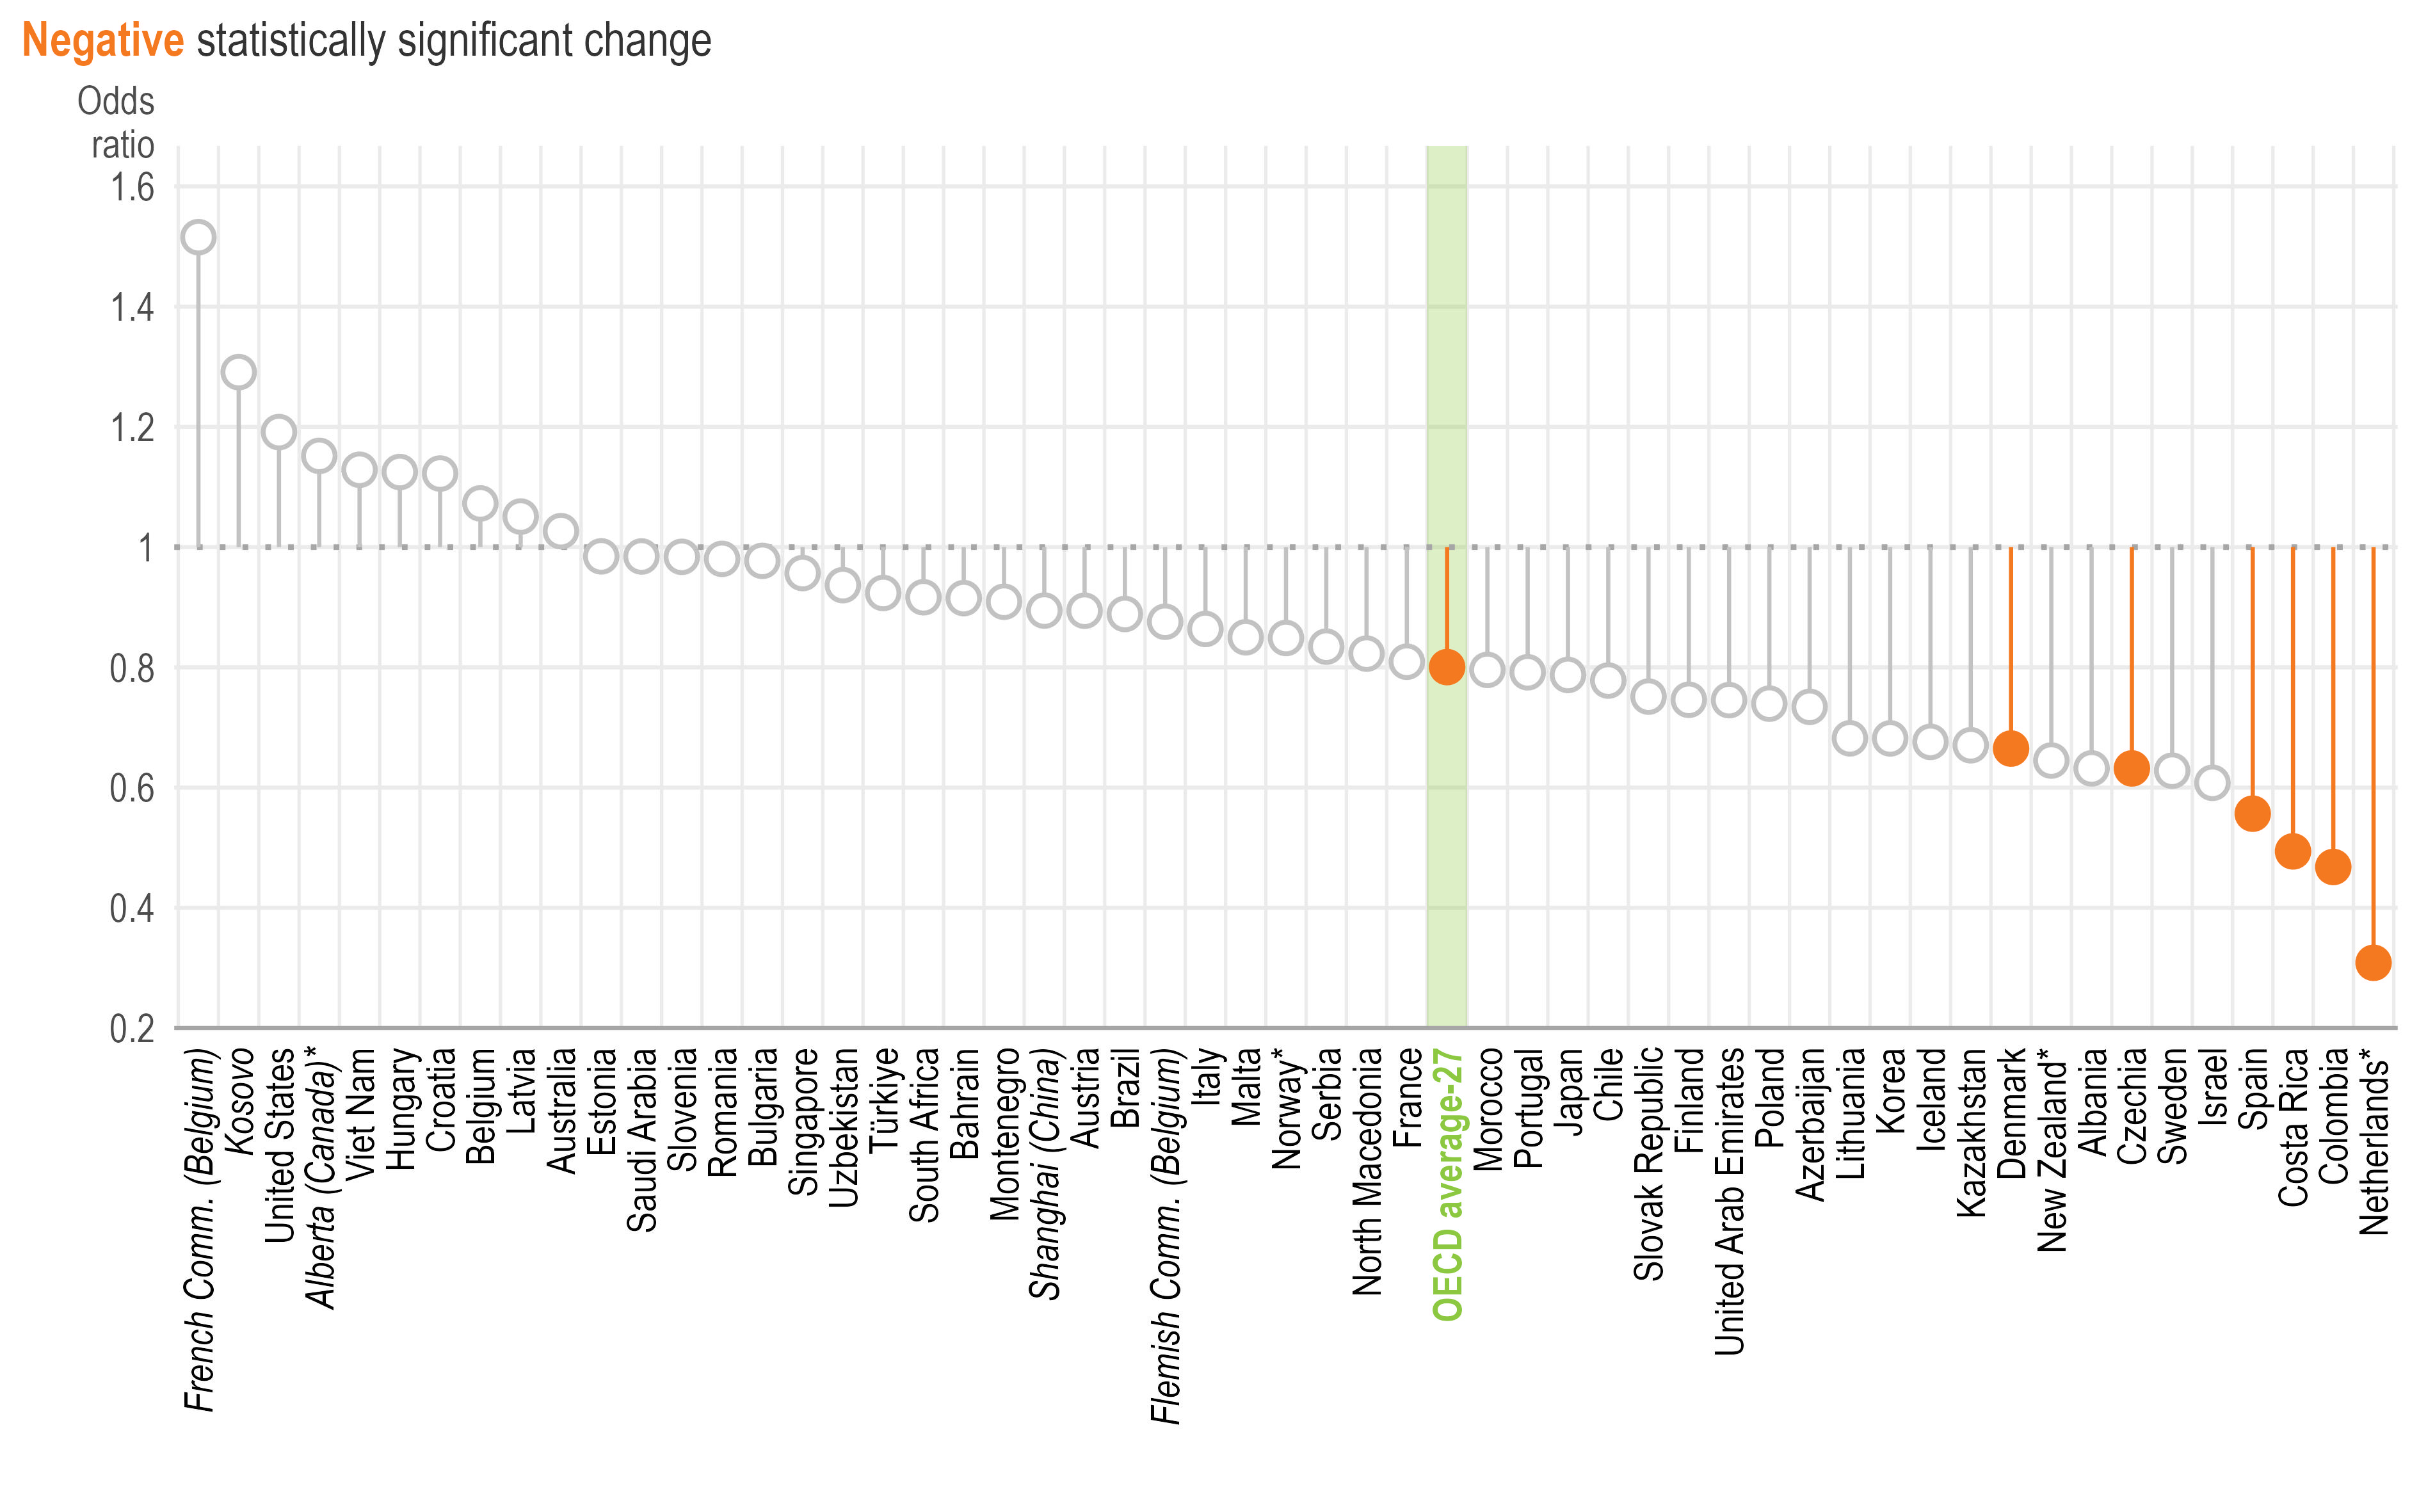
Note: *Estimates should be interpreted with caution due to a higher risk of non-response bias.
Statistically significant coefficients are highlighted with filled circles (see Annex B). Filled circles above 1 indicate a positive association, while those below 1 reflect a negative relationship.
1. Binary variables: the reference category refers to “not at all” and “to some extent”.
2. Standardised scale scores with a standard deviation of 2 and the value of 10 corresponding to the item mid-point value of the response scale. Scale scores averaged at the school level. For more information on the scales, see Annex B.
3. Results are based on school-level binary logistic regression analysis controlling for principal characteristics (i.e. gender and age [standardised at the international level]) and school characteristics (i.e. school governance type, school size and school intake of students from socio-economically disadvantaged homes).
Source: OECD, TALIS 2024 Database, Table 1.29.
Regression analysis shows that, on average and in Colombia, Costa Rica, Czechia, Denmark, the Netherlands* and Spain, principals who are rated highly in relational leadership are less likely to report shortages of qualified teachers (Figure 1.9). A similar link is observed between perceived shortage of qualified teachers and principals’ instructional leadership (Table 1.29). This association could suggest that principals facing teacher shortages have less time and opportunity to engage in instructional or relational leadership. However, together with the findings related to teachers’ career intentions, they could also indicate that principals can play an important role in addressing teacher attrition and ensuring an adequate supply of qualified teachers.
Instructional and relational leadership
Upper secondary teachers are less likely than their lower secondary counterparts to value their principals' leadership highly. On average, at least 86% of upper secondary teachers “agree” or “strongly agree” that their principals show instructional leadership in all three TALIS measures – yet this is at least 2 percentage points lower across all three measures compared to lower secondary. At the upper secondary level, Croatia, Denmark, the Flemish Community of Belgium and Slovenia all show lower ratings on at least two of the three instructional leadership measures (Table 1.2).
Relational leadership goes in a similar direction. Denmark stands out, with upper secondary teachers rating relational leadership lower across all four TALIS measures. The largest gap is 17 percentage points fewer teachers than in lower secondary agreeing that the principal encourages all staff to have a say on important decisions (Table 1.3).
Variation in valued leadership between education systems, schools and teachers
At the upper secondary level, the between-education system share of variation is larger than at lower secondary education (11% for instructional, 11% for relational), suggesting that system-level factors matter more for leadership at upper secondary level (Tables 1.4 and 1.5). This may have to do with features of upper secondary education, such as subject-based instruction, tracking, pathways, or examination pressure. These features are often organised at the system level and are found in many education systems, though their design and implementation can vary considerably.
Variation is also concentrated within schools rather than between them (84% for instructional, 78% for relational) but Saudi Arabia and Denmark are notable exceptions: in Saudi Arabia, 12–13 percentage points more of the variation in both leadership types lies within schools at the upper secondary level, whereas in Denmark, the variation in relational leadership lies within schools and is 6 percentage points smaller (Tables 1.8 and 1.9). In other words, teachers’ perceptions of relational leadership are more similar across schools in Saudi Arabia and more different across schools in Denmark. The widest disparities in relational leadership (over 3 index points, equivalent to almost 2 standard deviations, between the top and bottom deciles) appear in Denmark and Türkiye (Tables 1.15 and 1.16).
School climate, professional outcomes and staffing
The broader pattern of associations observed at lower secondary level – that valued leadership is linked to a positive school climate and better professional outcomes for teachers – is largely the same in upper secondary education (Tables 1.17, 1.18, 1.19, 1.20, 1.21, 1.22, 1.23, 1.24, 1.25, 1.26 and 1.27).
The staffing picture, however, is more mixed at this level. The negative link between teachers' intention to leave and valued leadership holds on average, with six out of eight education systems showing the pattern for both leadership types (Table 1.28). However, once principal and school characteristics are taken into account, the negative association between perceived teacher shortages and valued leadership is observed only in the United Arab Emirates (Table 1.29).
References
[38] Banerjee, N. et al. (2017), “Teacher job satisfaction and student achievement: The roles of teacher professional community and teacher collaboration in schools”, American Journal of Education, Vol. 123/2, pp. 203-241, https://doi.org/10.1086/689932.
[33] Caprara, G. et al. (2006), “Teachers’ self-efficacy beliefs as determinants of job satisfaction and students’ academic achievement: A study at the school level”, Journal of School Psychology, Vol. 44/6, pp. 473-490, https://doi.org/10.1016/j.jsp.2006.09.001.
[29] Chetty, R., J. Friedman and J. Rockoff (2014), “Measuring the impacts of teachers I: Evaluating bias in teacher value-added estimates”, American Economic Review, Vol. 104/9, pp. 2593-2632, https://doi.org/10.1257/aer.104.9.2593.
[30] Chetty, R., J. Friedman and J. Rockoff (2014), “Measuring the impacts of teachers II: Teacher value-added and student outcomes in adulthood”, American Economic Review, Vol. 104/9, pp. 2633-2679, https://doi.org/10.1257/aer.104.9.2633.
[20] Clotfelter, C. et al. (2007), “High Poverty Schools and the Distribution of Teachers and Principals”, North Carolina Law Review, Vol. 85, p. 1345, https://scholarship.law.duke.edu/faculty_scholarship/1915 (accessed on 1 June 2026).
[4] Darling-Hammond, L. et al. (2026), “The principal effect: How investing in school leaders is key to solving education’s challenges”, https://doi.org/10.54300/644.197.
[18] Darling-Hammond, L. et al. (2022), “Developing effective principals: What kind of learning matters?”, https://doi.org/10.54300/641.201.
[8] Day, C., Q. Gu and P. Sammons (2016), “The Impact of Leadership on Student Outcomes: How Successful School Leaders Use Transformational and Instructional Strategies to Make a Difference”, Educational Administration Quarterly, Vol. 52/2, pp. 221-258, https://doi.org/10.1177/0013161X15616863.
[1] Day, C. et al. (2010), 10 Strong Claims About Successful School Leadership, College for Leadership of Schools and Children’s Services, Nottingham, https://assets.publishing.service.gov.uk/government/uploads/system/uploads/attachment_data/file/327938/10-strong-claims-about-successful-school-leadership.pdf.
[15] Gómez-Leal, R. et al. (2022), “The relationship between emotional intelligence and leadership in school leaders: a systematic review”, Cambridge Journal of Education, Vol. 52/1, pp. 1-21, https://doi.org/10.1080/0305764X.2021.1927987.
[21] Grissom, J., B. Bartanen and H. Mitani (2019), “Principal Sorting and the Distribution of Principal Quality”, AERA Open, Vol. 5/2, https://doi.org/10.1177/2332858419850094.
[42] Grissom, J., A. Egalite and C. Lindsay (2021), “How Principals Affect Students and Schools: A Systematic Synthesis of Two Decades of Research”, https://doi.org/10.59656/EL-SB1065.001.
[2] Hallinger, P. (2011), “Leadership for learning: Lessons from 40 years of empirical research”, Journal of Educational Administration, Vol. 49/2, pp. 125-142, https://doi.org/10.1108/09578231111116699.
[12] Hallinger, P. and T. Truong (2016), ““Above must be above, and below must be below”: enactment of relational school leadership in Vietnam”, Asia Pacific Education Review 2016 17:4, Vol. 17/4, pp. 677-690, https://doi.org/10.1007/s12564-016-9463-4.
[9] Hallinger, P. et al. (2015), “Assessing instructional leadership with the principal instructional management rating scale”, Assessing Instructional Leadership with the Principal Instructional Management Rating Scale, pp. 1-204, https://doi.org/10.1007/978-3-319-15533-3.
[32] Holzberger, D., A. Philipp and M. Kunter (2013), “How teachers’ self-efficacy is related to instructional quality: A longitudinal analysis”, Journal of Educational Psychology, Vol. 105/3, pp. 774-786, https://doi.org/10.1037/a0032198.
[34] Ingersoll, R. (2001), “Teacher turnover and teacher shortages: An organizational analysis”, American Educational Research Journal, Vol. 38/3, pp. 499-534, https://doi.org/10.3102/00028312038003499.
[24] Kelly, K., J. Merry and M. Gonzalez (2018), “Trust, collaboration and well-being: Lessons learned from Finland”, SRATE Journal, Vol. Vol. 27/2, pp. pp. 34-39, https://www.srate.org/JournalEditions/Volume27-2/Manuscript%2005.Kelly.pdf.
[44] Kraft, M. et al. (2016), “School organizational contexts, teacher turnover, and student achievement”, American Educational Research Journal, Vol. 53/5, pp. 1411-1449, https://doi.org/10.3102/0002831216667478.
[45] Ladd, H. (2011), “Teachers’ Perceptions of their Working Conditions: How Predictive of Planned and Actual teacher Movement?”, Educational Evaluation and Policy Analysis, Vol. 33/2, pp. 235-261, https://doi.org/10.3102/0162373711398128.
[3] Leithwood, K., A. Harris and D. Hopkins (2020), “Seven strong claims about successful school leadership revisited”, School Leadership and Management, Vol. 40/1, pp. 5-22, https://doi.org/10.1080/13632434.2019.1596077.
[17] Liu, Y. and S. Watson (2023), “Whose leadership role is more substantial for teacher professional collaboration, job satisfaction and organizational commitment: a lens of distributed leadership”, International Journal of Leadership in Education, Vol. 26/6, pp. 1082-1110, https://doi.org/10.1080/13603124.2020.1820580.
[16] Mincu, M. (2022), “Why is school leadership key to transforming education? Structural and cultural assumptions for quality education in diverse contexts”, PROSPECTS 2022 52:3, Vol. 52/3, pp. 231-242, https://doi.org/10.1007/s11125-022-09625-6.
[23] Muckenthaler, M. et al. (2020), “Teacher collaboration as a core objective of school development”, School Effectiveness and School Improvement, Vol. 31/3, pp. 486-504, https://doi.org/10.1080/09243453.2020.1747501.
[25] OECD (2025), Results from TALIS 2024: The State of Teaching, TALIS, OECD Publishing, Paris, https://doi.org/10.1787/90df6235-en.
[7] OECD (2025), Teaching and Learning International Survey (TALIS) 2024 Conceptual Framework, OECD Publishing, Paris, https://doi.org/10.1787/7b8f85d4-en.
[41] OECD (2024), Education at a Glance 2024: OECD Indicators, OECD Publishing, Paris, https://doi.org/10.1787/c00cad36-en.
[40] OECD (2024), Education Policy Outlook 2024: Reshaping Teaching into a Thriving Profession from ABCs to AI, OECD Publishing, Paris, https://doi.org/10.1787/dd5140e4-en.
[28] OECD (2024), PISA 2022 Results (Volume V): Learning Strategies and Attitudes for Life, PISA, OECD Publishing, Paris, https://doi.org/10.1787/c2e44201-en.
[26] OECD (2016), School Leadership for Learning: Insights from TALIS 2013, TALIS, OECD Publishing, Paris, https://doi.org/10.1787/9789264258341-en.
[37] OECD (2014), TALIS 2013 Results: An International Perspective on Teaching and Learning, TALIS, OECD Publishing, Paris, https://doi.org/10.1787/9789264196261-en.
[5] Price, H. (2020), “Principal Leadership Activities and Teachers’ Workplace Attitudes”, Exploring Principal Development and Teacher Outcomes, pp. 148-167, https://doi.org/10.4324/9780429356247-11.
[6] Price, H. (2012), “Principal-teacher interactions: How affective relationships shape principal and teacher attitudes”, Educational Administration Quarterly, Vol. 48/1, pp. 39-85, https://doi.org/10.1177/0013161X11417126.
[22] Price, H. and N. Moolenaar (2015), “Principal-teacher relationships: foregrounding the international importance of principals’ social relationships for school learning climates”, Journal of Educational Administration, Vol. 53/1, https://doi.org/10.1108/JEA-11-2014-0134.
[31] Rivkin, S., E. Hanushek and J. Kain (2005), “Teachers, schools, and academic achievement”, Econometrica: The Journal of the Econometric Society, Vol. 73/2, pp. 417-458, https://doi.org/10.1111/j.1468-0262.2005.00584.x.
[10] Robinson, V., C. Lloyd and K. Rowe (2008), “The impact of leadership on student outcomes: An analysis of the differential effects of leadership types”, Educational Administration Quarterly, Vol. 44/5, pp. 635-674, https://doi.org/10.1177/0013161X08321509.
[35] Ronfeldt, M., S. Loeb and J. Wyckoff (2013), “How teacher turnover harms student achievement”, American Educational Research Journal, Vol. 50/1, pp. 4-36, https://doi.org/10.3102/0002831212463813.
[19] Sanchez, J., J. Paul and B. Thornton (2022), “Relationships among teachers’ perceptions of principal leadership and teachers’ perceptions of school climate in the high school setting”, International Journal of Leadership in Education, Vol. 25/6, pp. 855-875, https://doi.org/10.1080/13603124.2019.1708471.
[11] Sebastian, J. and E. Allensworth (2012), “The Influence of Principal Leadership on Classroom Instruction and Student Learning: A Study of Mediated Pathways to Learning”, Educational Administration Quarterly, Vol. 48/4, pp. 626-663, https://doi.org/10.1177/0013161X11436273.
[43] Sebastian, J. et al. (2019), “Principal Leadership and School Performance: An Examination of Instructional Leadership and Organizational Management”, Leadership and Policy in Schools, Vol. 18/4, pp. 591-613, https://doi.org/10.1080/15700763.2018.1513151.
[14] Smit, B. (2018), “Expanding educational leadership theories through qualitative relational methodologies”, Magis, Vol. 11/22, pp. 75-86, https://doi.org/10.11144/Javeriana.m11-22.eelt.
[13] Uhl-Bien, M. (2006), “Relational Leadership Theory: Exploring the social processes of leadership and organizing”, The Leadership Quarterly, Vol. 17/6, pp. 654-676, https://doi.org/10.1016/j.leaqua.2006.10.007.
[39] UNESCO (2024), Global report on teachers: addressing teacher shortages and transforming the profession, UNESCO, https://doi.org/10.54675/figu8035.
[36] Viac, C. and P. Fraser (2020), “Teachers’ well-being: A framework for data collection and analysis”, OECD Education Working Papers, No. 213, OECD Publishing, Paris, https://doi.org/10.1787/c36fc9d3-en.
[27] Wang, M. and J. Degol (2016), “School climate: A review of the construct, measurement, and impact on student outcomes”, Educational Psychology Review, Vol. 28/2, pp. 315-352, https://doi.org/10.1007/s10648-015-9319-1.
← 1. Descriptive statistics for the control variables can be found in the online TALIS 2024 Statistical Compendium.
← 2. Coefficients for the OECD and TALIS averages may be statistically significant even when country-level coefficients are statistically significant in only a small number of participating education systems. As such, these average results may not reflect a consistent pattern across education systems.
← 3. Latent variable modelling is a statistical approach that uses responses to several related questions to measure an underlying concept that cannot be observed directly, such as motivation, job satisfaction or leadership.
← 4. Scale scores are standardised to have a standard deviation of 2 across all education systems participating in TALIS and where value 10 corresponds to the item mid-point value of the response scale.