This chapter analyses how much valued leadership is linked to principals’ individual characteristics and the school contexts in which they work. It explores cross-country variation and changes over time in the characteristics and contexts associated with valued leadership. The chapter also examines principals’ well-being and job satisfaction, and their link with valued leadership.
The Value of School Principals in TALIS 2024

Abstract
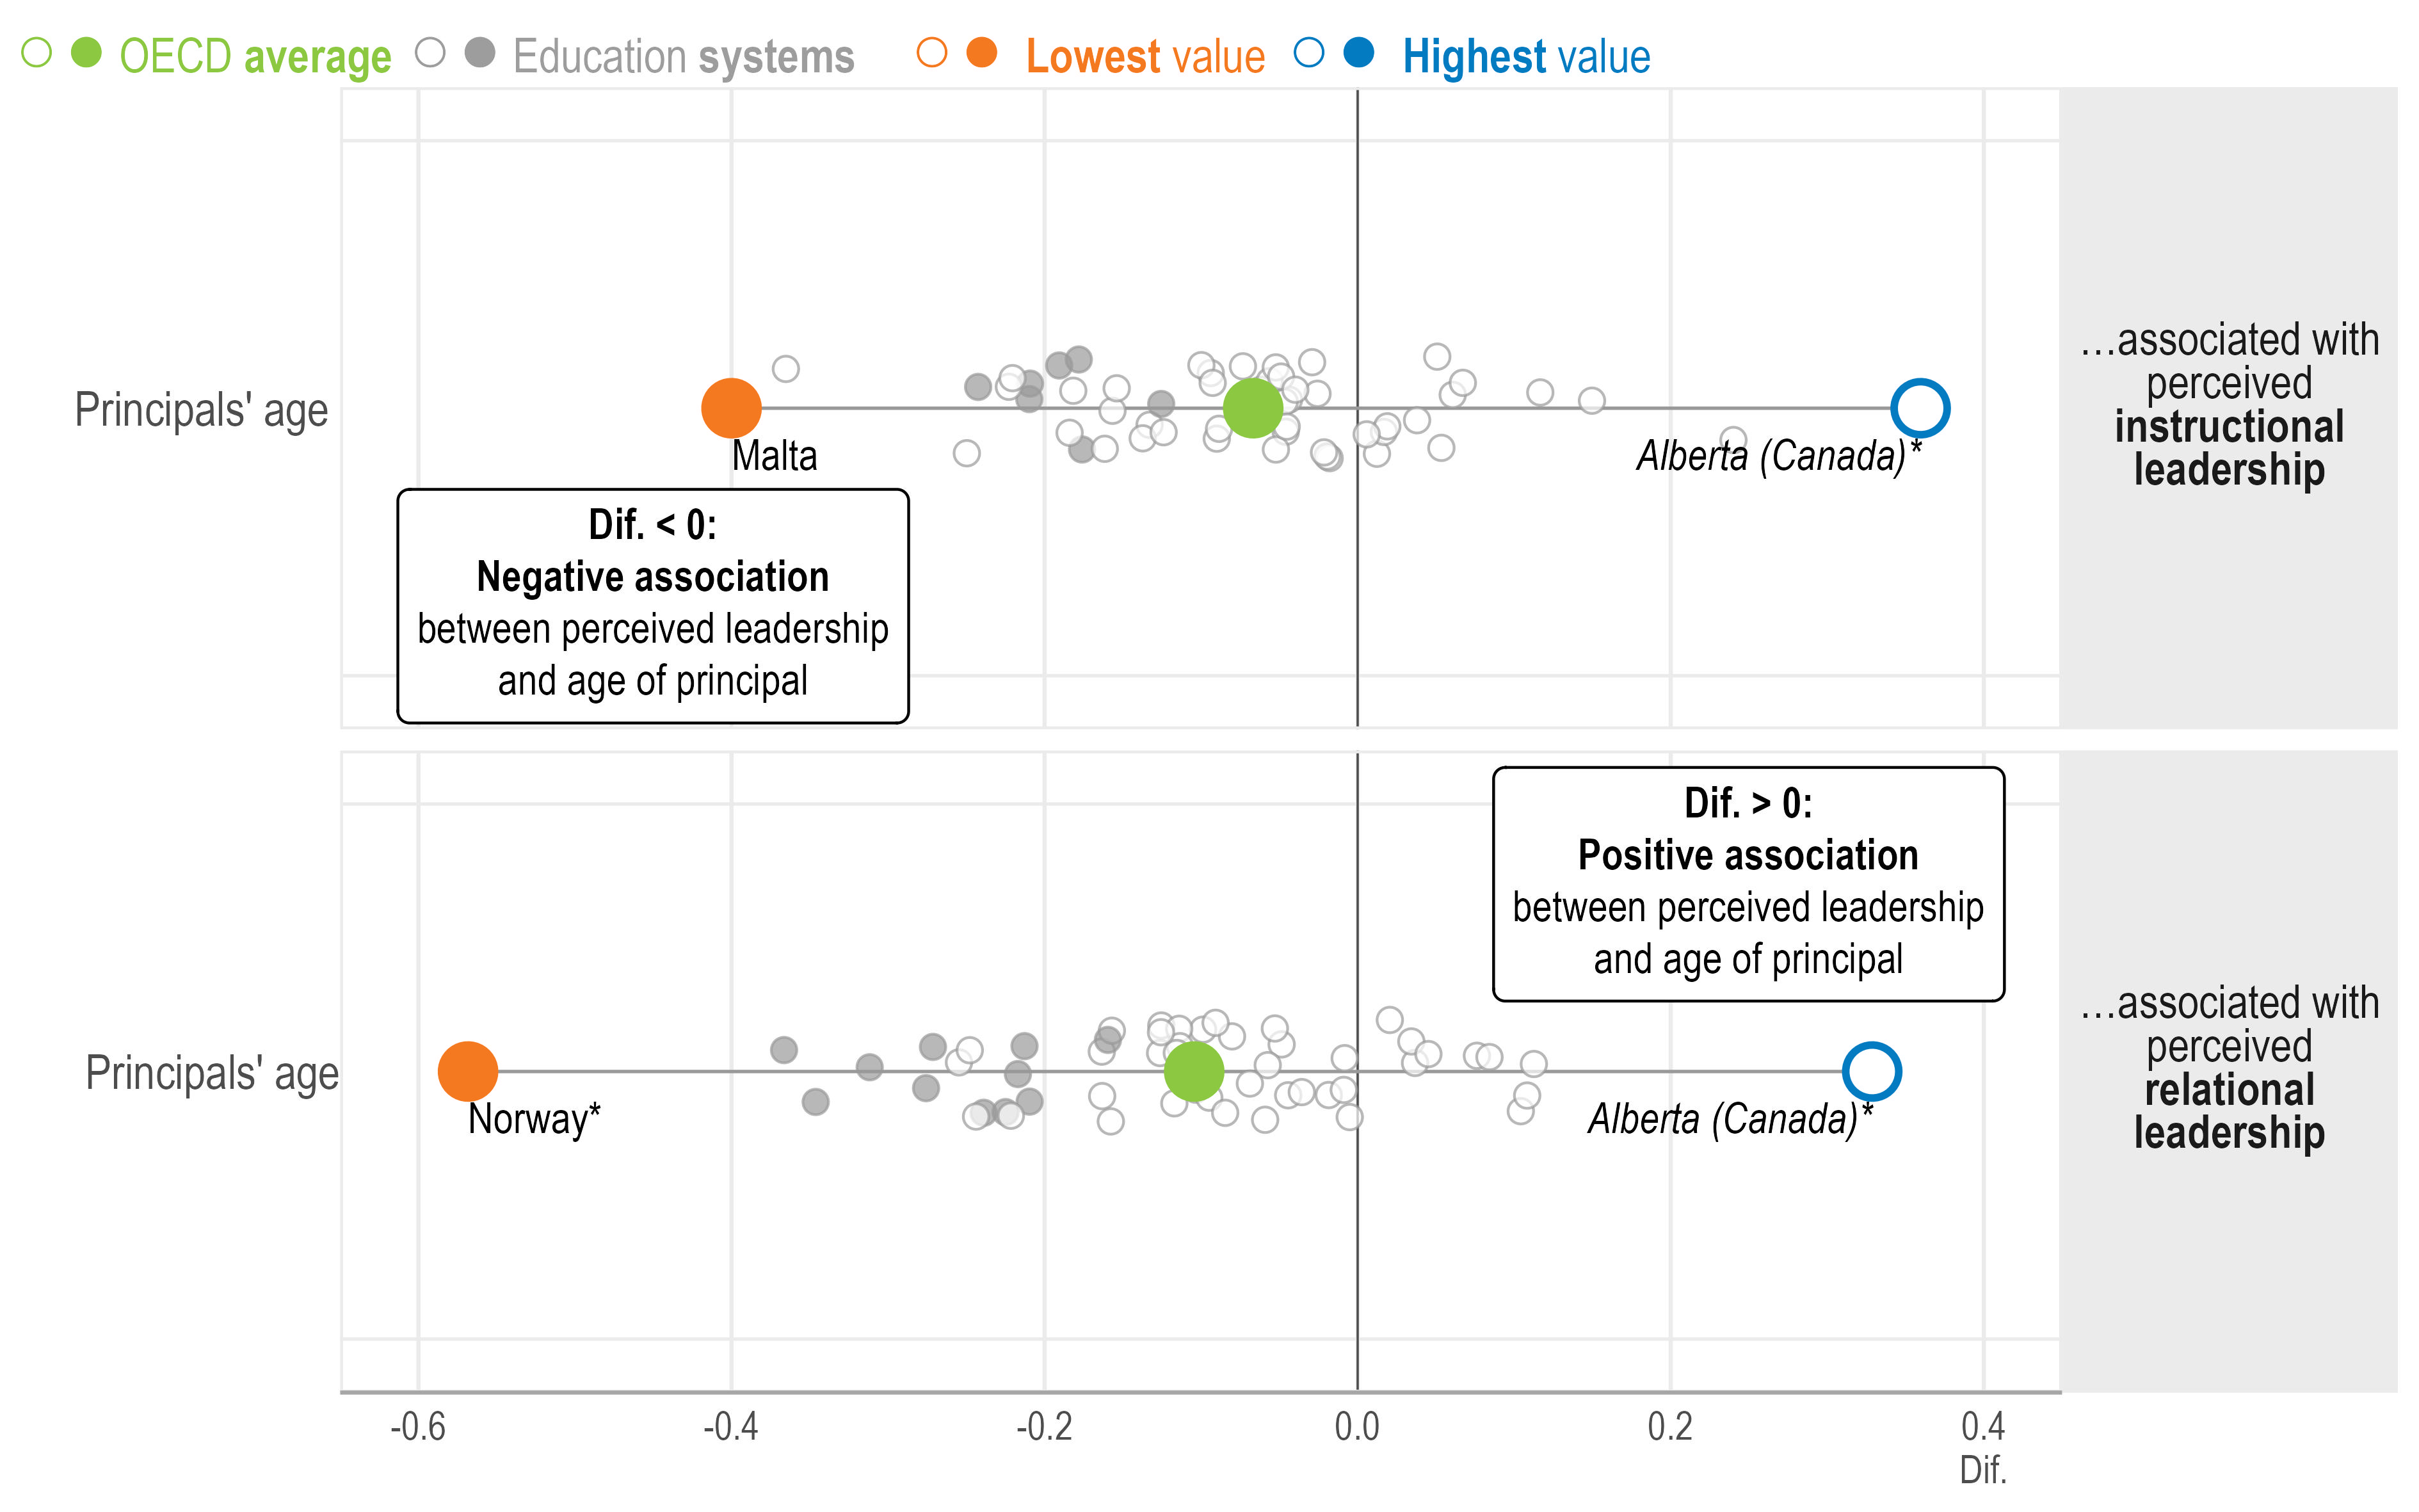
Younger principals are more likely to be perceived as demonstrating strong instructional and relational leadership.
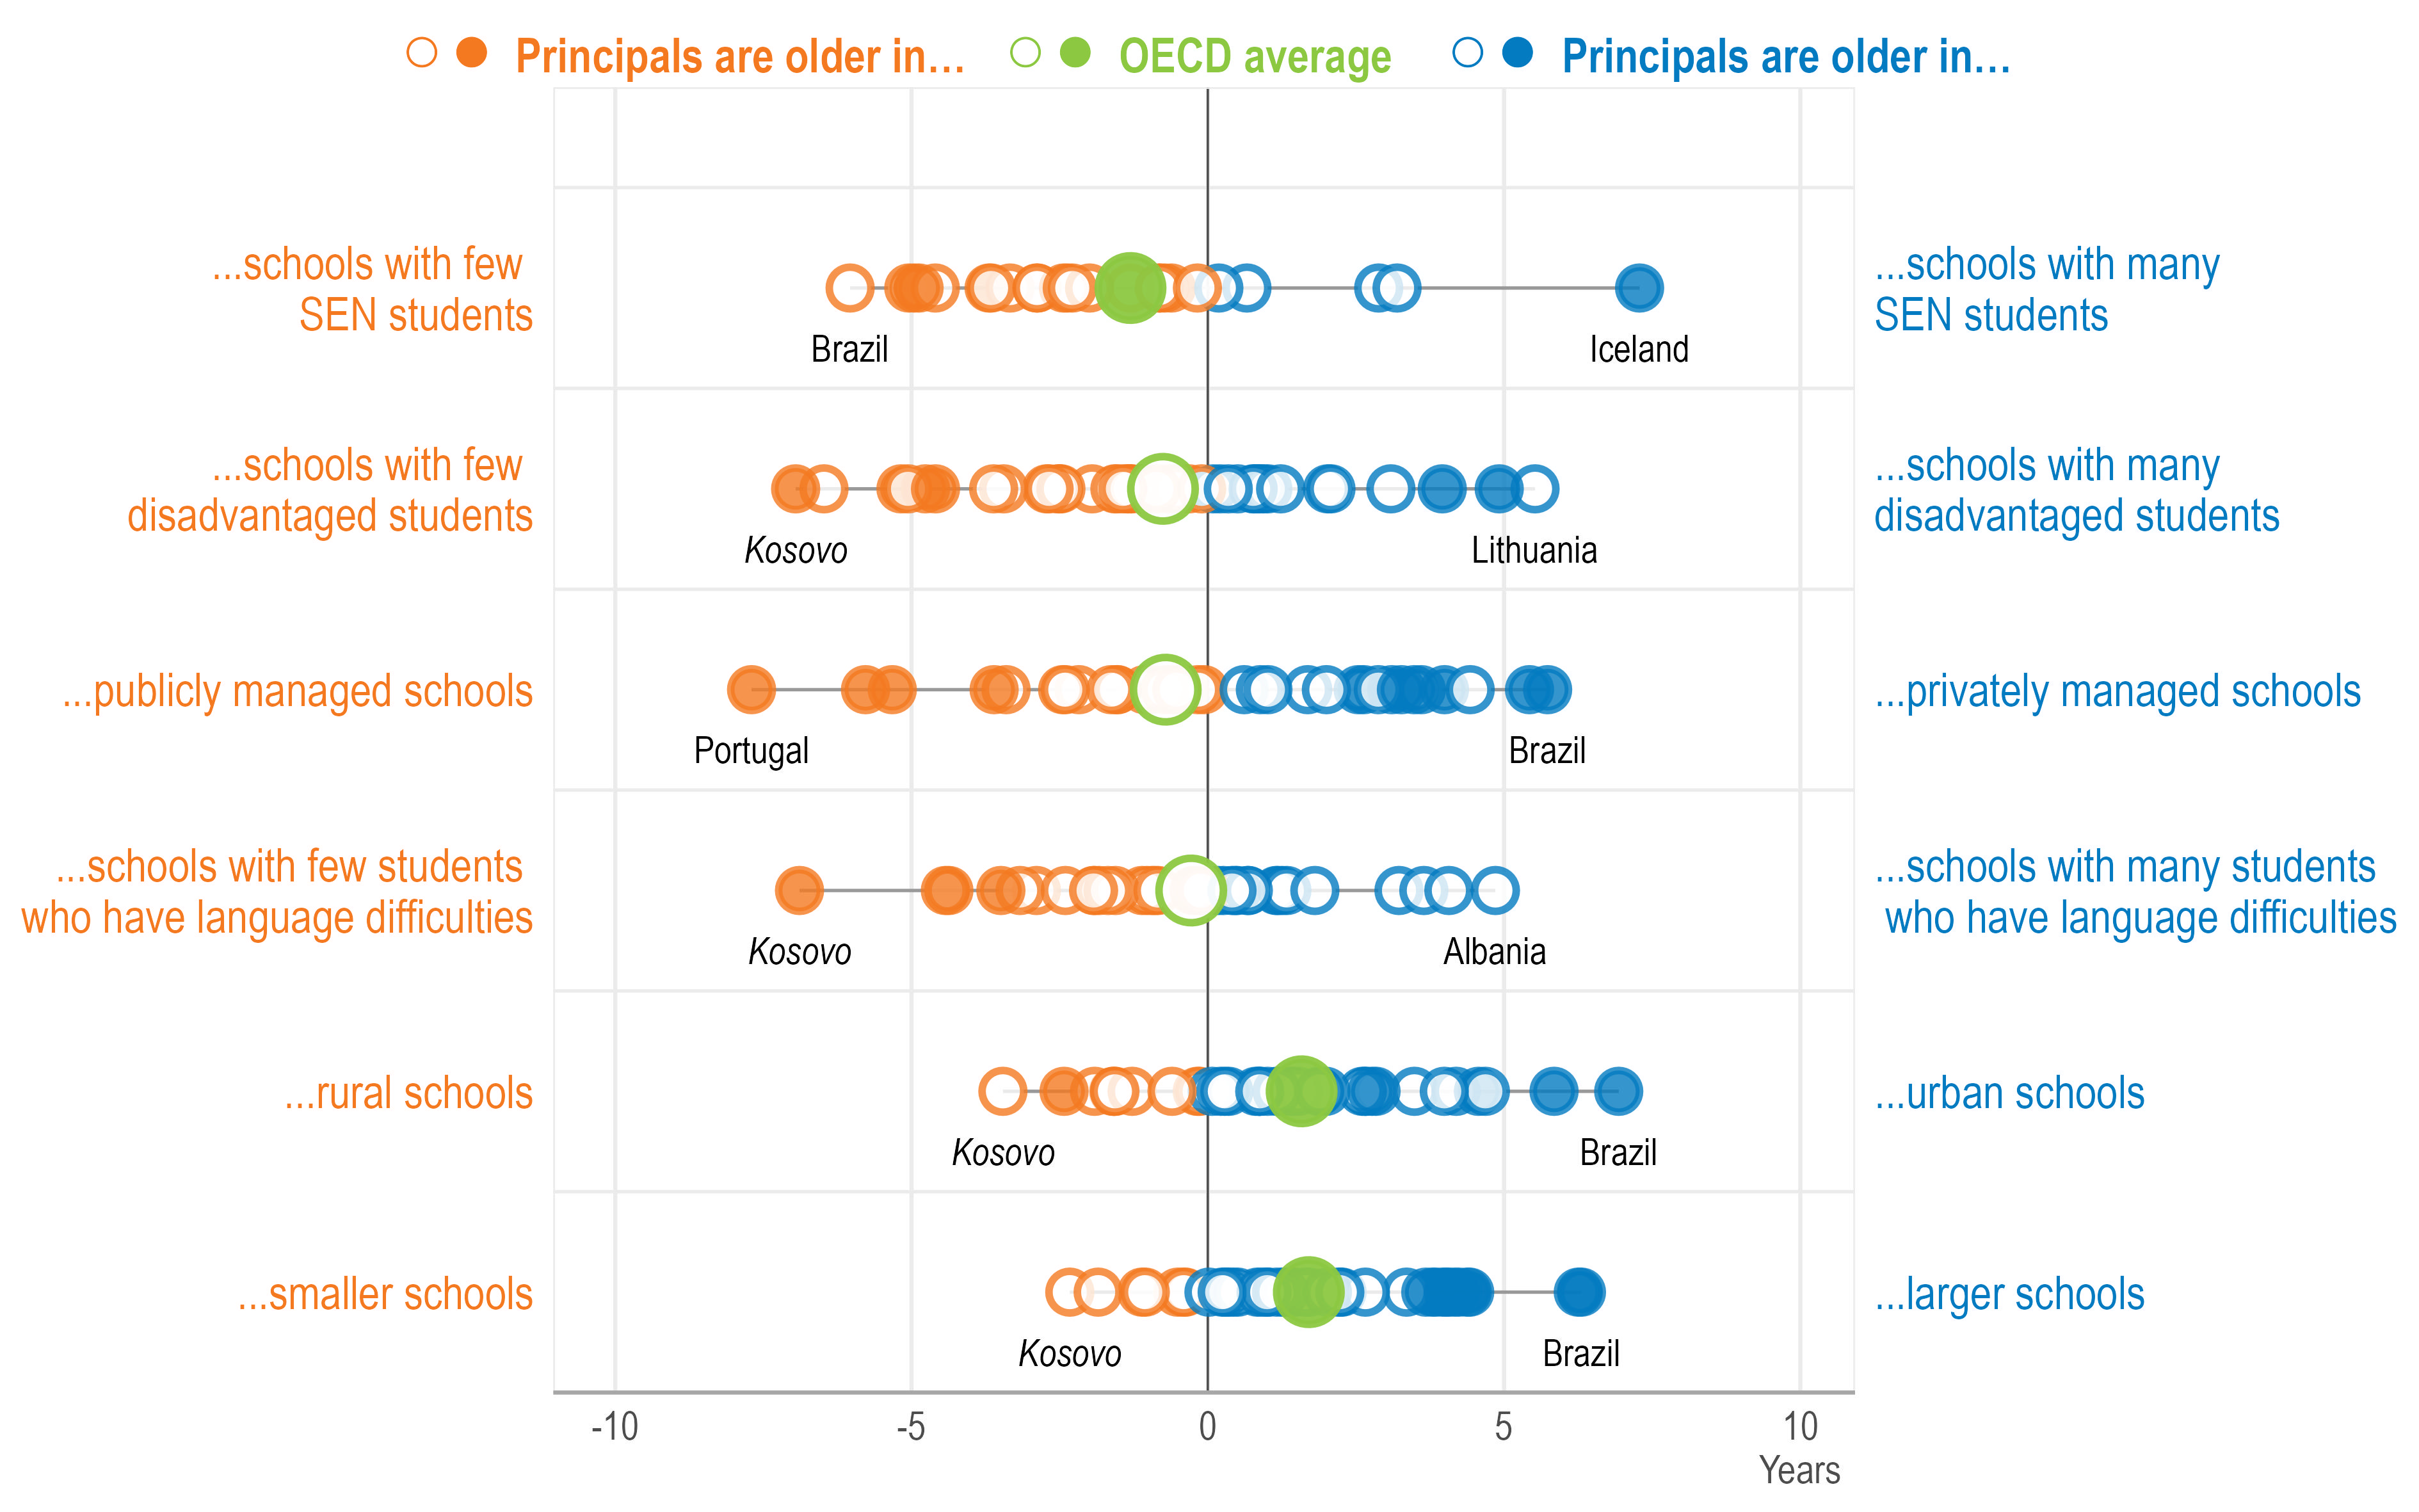
Principals tend to be older in urban and larger schools (750 students or more), and schools with a lower share of students with special education needs (10% or less).
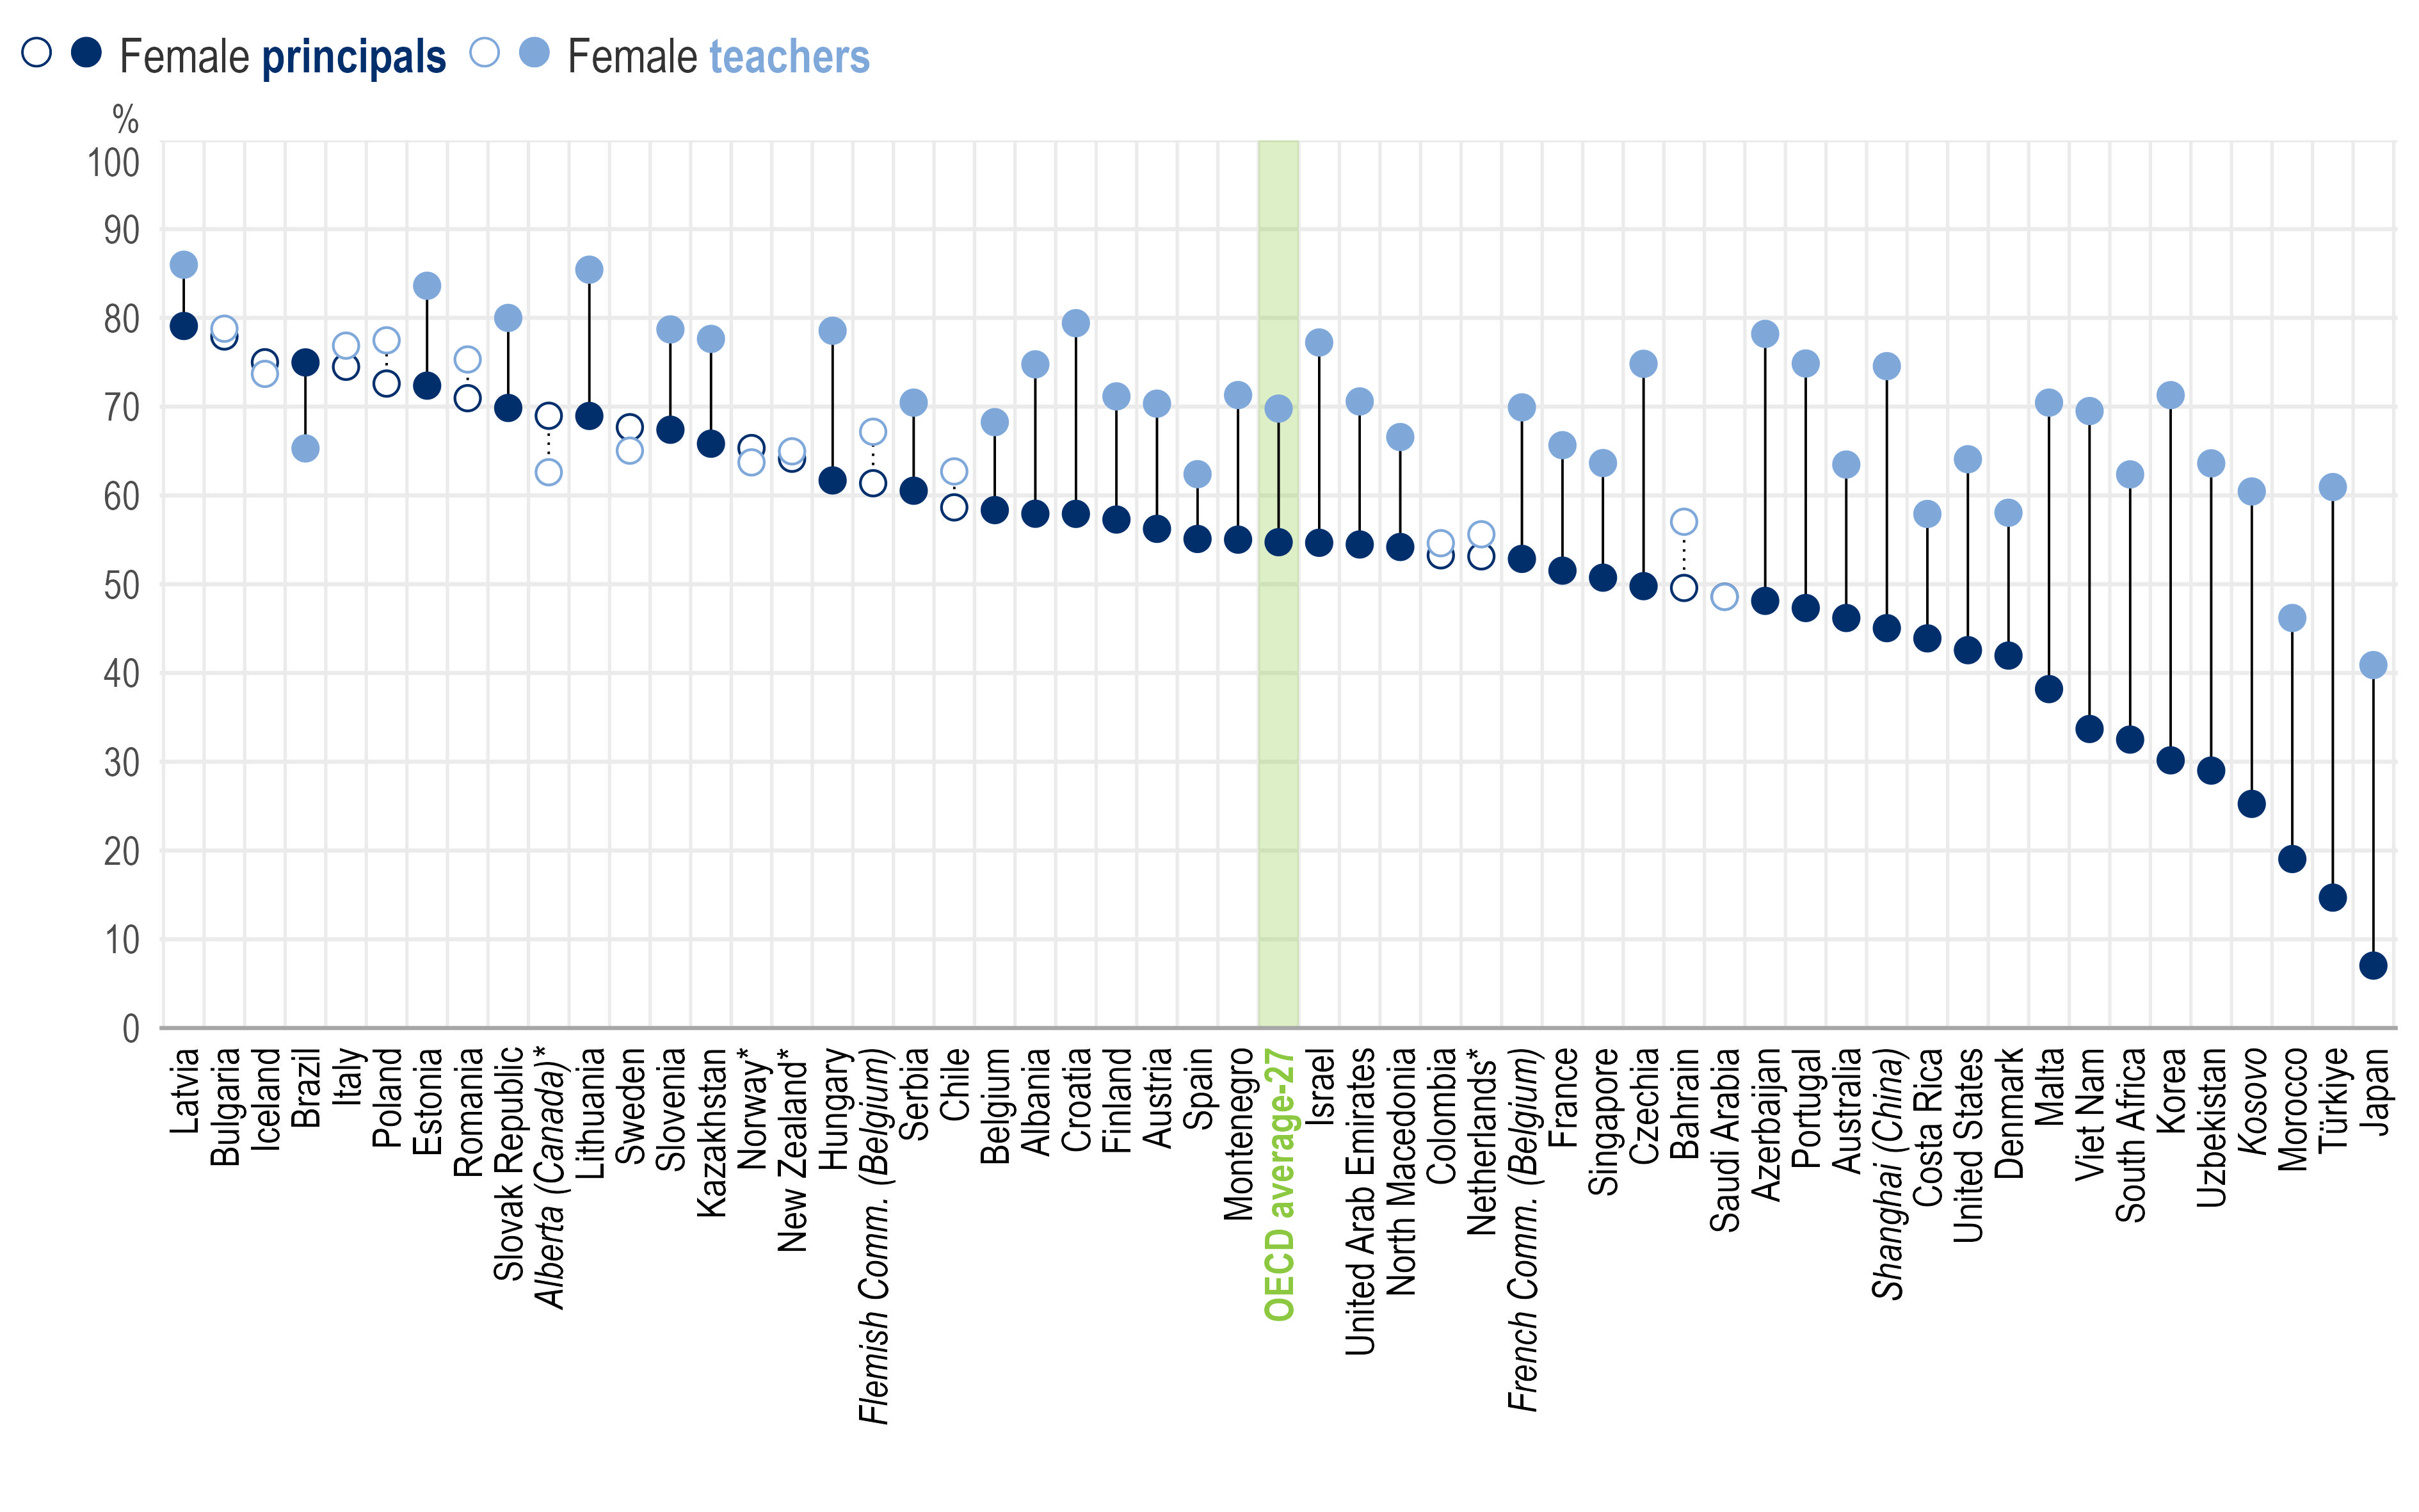
School leadership is more gender-balanced than the teaching workforce, on average. However, this varies across education systems. The share of female principals ranges from 30% or below in Japan, Korea, Kosovo, Morocco, Türkiye and Uzbekistan to above 70% in Brazil, Bulgaria, Estonia, Iceland, Italy, Latvia, Poland and Romania.
Principals in smaller schools (fewer than 250 students) are generally perceived as more valued leaders. In larger schools, greater administrative demands, more complex leadership structures and more challenging school climates may make it harder for principals to engage in effective instructional and relational leadership.
In most education systems, over 90% of principals are satisfied with their jobs overall. Yet, in Alberta (Canada)*, France, Japan and Norway*, the share of principals satisfied with their jobs decreased by 7 to 10 percentage points between 2018 and 2024.
Principals who are satisfied with their jobs tend to be more valued by their teachers, both as instructional and relational leaders. Principals who feel supported and satisfied may be better placed to lead and build strong relationships with teachers. Teachers’ appreciation may, in turn, strengthen principals’ job satisfaction and sense of effectiveness.
Principals most frequently report stress from excessive administrative work. Between 2018 and 2024, on average, the share of principals reporting extra duties due to staff absences, school discipline and parent concerns as major sources of stress increased by 4 percentage points, reaching 45%, 49% and 53%, respectively.
* For countries highlighted with an asterisk (*), estimates should be interpreted with caution due to a higher risk of non-response bias. See the Reader's Guide and Annex A for more detail.
School leadership matters for school outcomes, such as student achievement and the quality of teaching and learning (Grissom, Egalite and Lindsay, 2021[1]; Leithwood, Harris and Hopkins, 2020[2]). TALIS 2024 data show that valued leadership1 is associated with better school climate, better teacher professional outcomes, lower teacher attrition and fewer perceived teacher shortages (see Chapter 1). However, leadership under similar conditions can still vary in terms of style and effectiveness due to individual and school-context factors. Understanding how these factors interact with how teachers perceive their principals’ leadership can help in designing more targeted and effective policies.
This chapter first analyses the relationship between principals’ individual characteristics and valued leadership. Then, it explores how school context is associated with valued leadership. The chapter also examines cross-country variation and changes over time in the individual and school-context factors associated with valued leadership. Finally, it looks at principals’ well-being and job satisfaction, and their link with valued leadership.
The relationships presented in this chapter are based on regression analyses, which examine how two variables are related while taking other relevant factors into account that may influence the relationship. Depending on the level of analysis, the regression models control for teacher- or principal-level characteristics (i.e. gender and age), as well as school characteristics (i.e. school governance type, school size and school intake of students from socio-economically disadvantaged homes).2 The relationships identified and discussed meet the following conditions:
coefficients for OECD and TALIS averages are statistically significant;3
at least two-thirds of participating education systems with available data have coefficients with the same sign as OECD and TALIS averages, regardless of statistical significance.
To note, the design of TALIS does not allow for the establishment of causal relationships. All regression analyses presented in this report should therefore be interpreted as identifying the presence (or absence) of statistical associations, i.e. whether or not variation in one variable is systematically associated with variation in another. They do not permit conclusions about causality; in other words, they cannot determine whether variation in one variable would cause a change in another, while holding all other factors constant.
Age
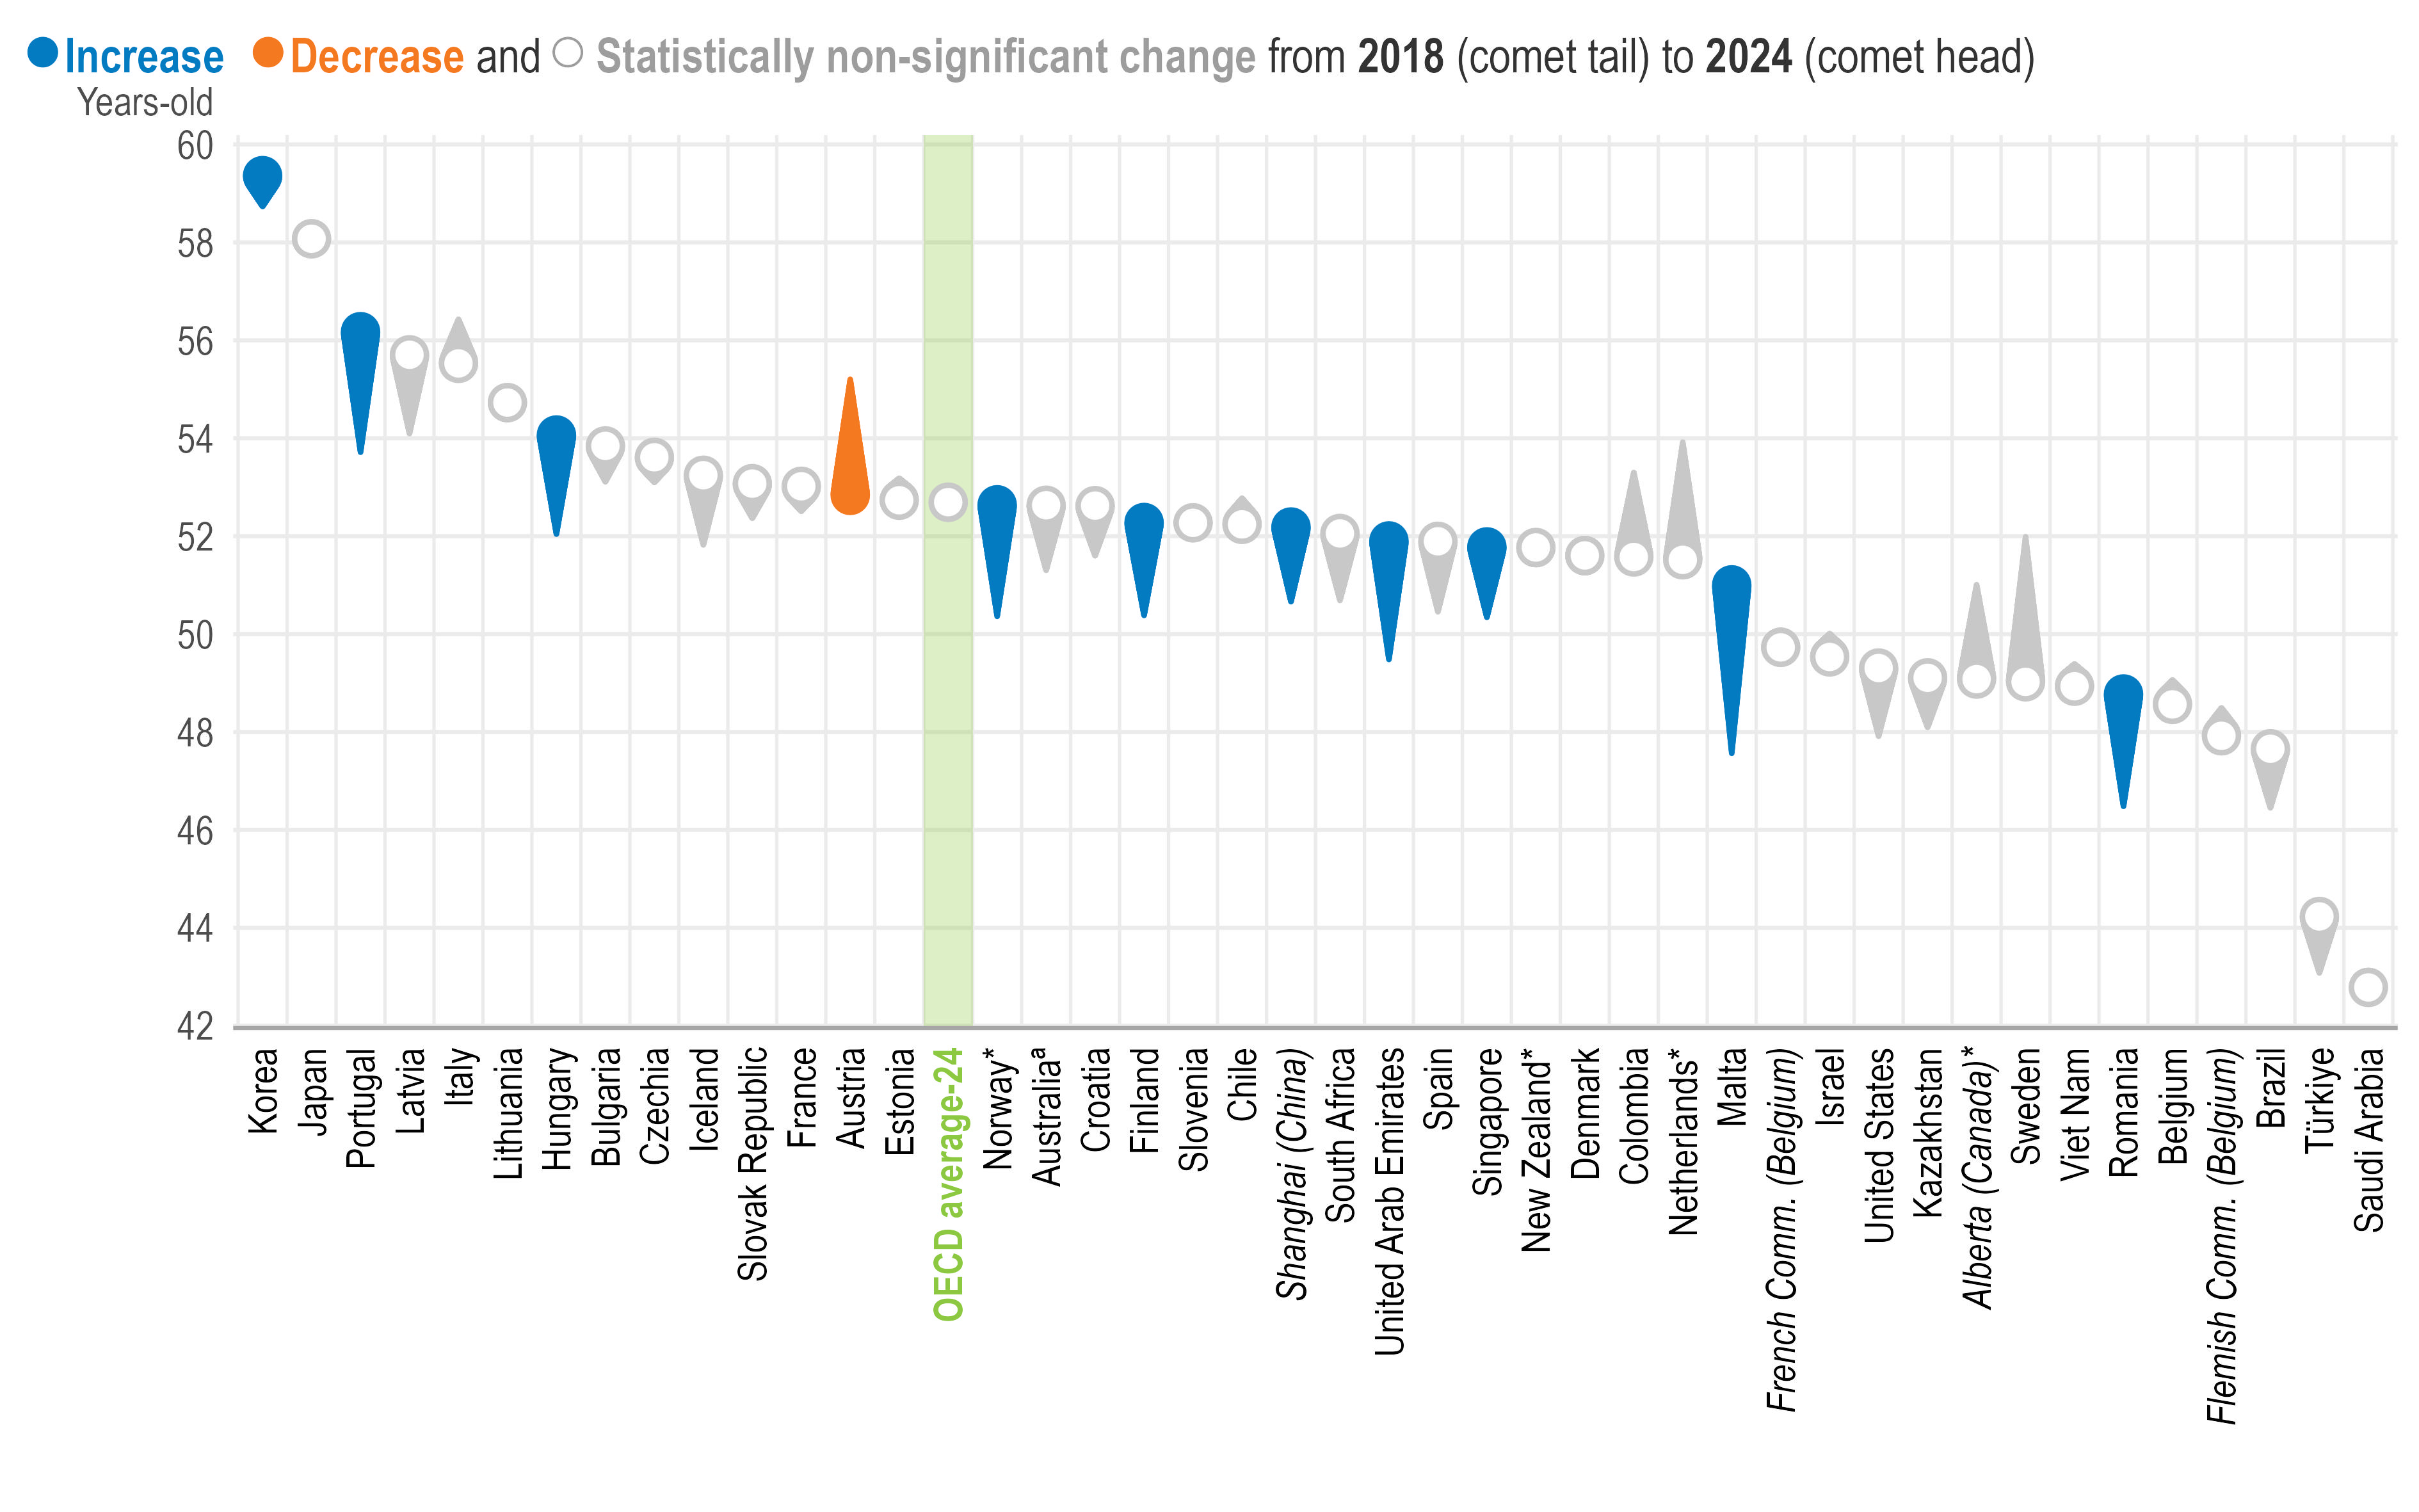
The average age of principals is 53, ranging from 43 in Saudi Arabia to 59 in Korea (Table 2.1). Between 2018 and 2024, the average age of principals increased by two to three years in Hungary, Malta, Norway*, Portugal, Romania and the United Arab Emirates (Figure 2.1). These changes over time are consistent with broader population ageing trends and increases in retirement age. However, population ageing alone cannot fully explain the rise in principals’ average age. In several countries with ageing populations, principals’ average age did not increase over the same period. In Austria, for example, it fell from 55 to 53 years, despite the country having a quickly growing old-age dependency ratio (OECD, 2025[3]). Austria promotes earlier entry into school leadership through transparent, competency-based recruitment, structured leadership training and leadership development programmes that build a pipeline of qualified future principals (Box 2.1).
Average age of lower secondary principals
Note: *Estimates should be interpreted with caution due to a higher risk of non-response bias.
ª Estimates for TALIS 2018 and the change between TALIS 2018 and TALIS 2024 should be interpreted with caution due to a higher risk of non-response bias.
Education systems are sorted in descending order by the average age of lower secondary principals in 2024.
Source: OECD, TALIS 2018 and TALIS 2024 Databases, Table 2.2.
Competency-based recruitment and open advertisement of positions
Under the Education Reform Act 2017 (Bildungsreformgesetz 2017, BGBl. I Nr. 138/2017), a uniform and standardised selection procedure for school principals was introduced. Principal positions are now publicly advertised by the responsible Board of Education and candidates are assessed by a formal committee (Begutachtungskommission) against a defined requirement profile – centred on pedagogical aptitude, a minimum of five years of teaching experience, and demonstrated leadership and management skills. By replacing informal or seniority-based appointment practices with open, competency-focused selection, this reform creates conditions under which qualified teachers can realistically compete for leadership positions at earlier points in their careers.
Structured leadership preparation pathways
School principals in Austria come from the teacher ranks. Since 2017, Austria has required all school principal candidates to hold at least 20 European Credit Transfer and Accumulation System (ECTS) credits from the Professional Leadership in Schools university course – or equivalent certification – prior to appointment, with the full 60-ECTS programme to be completed within 4.5 years of taking up the role. This requirement, extended to all tenured principals from 2023, represents a shift from a system where seniority served as the primary marker of readiness, toward one where leadership credentials must be actively acquired. By creating a formal, accessible preparation pathway, the reform enables teachers to build the qualifications needed for principalship earlier in their careers, potentially lowering the age at which they are both eligible and ready to apply.
Leadership Academy Austria
The Leadership Academy Austria (LEA), an initiative of the Austrian Federal Ministry of Education, operated from 2004 to 2018 and developed leadership capacity across all levels of the education system through cohort-based programmes combining plenary lectures, collegial coaching and practical project work. The Academy engaged over 3 000 education professionals during its operation. By identifying and cultivating leadership potential among practising teachers and middle leaders – rather than waiting for career-end appointment – the LEA contributed to building a pipeline of principals ready to take on leadership roles at a younger age. While the programme is no longer active, some of its effects on the current principal workforce may still be evident today.
Sources:
European Commission/EACEA/Eurydice (2025). Management staff for early childhood and school education: Austria. European Education and Culture Executive Agency. https://eurydice.eacea.ec.europa.eu/eurypedia/austria/management-staff-early-childhood-and-school-education
Austrian Federal Ministry of Education (BMB) (n.d.). Leadership Academy. https://www.bmb.gv.at/Themen/schule/bef/bec/lea.html
Austrian Federal Ministry of Education (2017). 2017 Education Reform Act (Bildungsreformgesetz 2017, BGBl. I Nr. 138/2017). https://www.ris.bka.gv.at/eli/bgbl/I/2017/138
Schratz, M., & Schley, W. (2014). Educational leaders as change agents in system development: The Austrian Leadership Academy. Journal of Contemporary Educational Studies, 4, 12–27.
Analysing principals' age across school characteristics can reveal differences in the attractiveness of various school contexts. Principals tend to be older in urban and larger schools, and those with a lower share of special education needs (SEN) students (10% or less), on average (Figure 2.2). Small rural schools face greater recruitment and turnover challenges, and, according to Lee and Mao (2023[4]), have limited financial incentives to attract candidates. This may be why they offer earlier or more accessible leadership opportunities and why younger principals are disproportionately represented in these kinds of school.
Based on responses of lower secondary principals
Note: Statistically significant differences are highlighted with filled circles (see Annex B).
A rural school is in a rural area or village of up to 3 000 people; an urban school is in a city of over 100 000 people.
A publicly managed school is a school that is managed by a public education authority, government agency, municipality, or governing board appointed by the government or elected by public franchise. A publicly managed school may not necessarily be publicly funded.
Smaller schools have fewer than 250 enrolled students. Larger schools have 750 students or more.
Schools with many disadvantaged students have at least 30% of students from socio-economically disadvantaged homes, while schools with few disadvantaged students have fewer than 10% of students from such homes. Socio-economically disadvantaged homes are those that lack the basic necessities or advantages of life, such as adequate housing, nutrition or medical care.
Schools with many special education needs (SEN) students have at least 30% of students with special education needs, while schools with few SEN students have fewer than 10%. Students with special education needs are those for whom a special education need has been formally identified because they are mentally, physically or emotionally disadvantaged.
Schools where many students have language difficulties have at least 10% of students who have difficulty understanding the language(s) of instruction, while schools where few students have language difficulties have no students who have difficulty understanding the language(s) of instruction.
Source: OECD, TALIS 2024 Database, Table 2.1.
Principals’ age is associated with teachers’ perceptions of their principals’ leadership. Based on regression analyses using TALIS 2024 data, teachers are less likely, on average, to perceive older principals as strong instructional and relational leaders (Figure 2.3). Principals who attain leadership positions relatively early in their careers may represent a selected group who have progressed rapidly through leadership pathways and been identified as having leadership potential. Research also indicates that, in rural schools, novice principals often rely on strong relationships, accessibility and visibility to build positive school cultures and to develop instructional leadership agendas (Wieczorek and Manard, 2018[5]).
Change in the school-level averages of lower secondary principals’ instructional and relational leadership scales1 associated with a one-standard-deviation increase in principals’ age2,3
Note: *Estimates should be interpreted with caution due to a higher risk of non-response bias.
Statistically significant coefficients are highlighted with filled circles (see Annex B). Filled circles above 0 indicate a positive association, while those below 0 reflect a negative relationship.
1. Standardised scale scores with a standard deviation of 2 and the value of 10 corresponding to the item mid-point value of the response scale. For more information on the scales, see Annex B.
2. Years standardised at the international level.
3. Results are based on school-level linear regression analyses controlling for principals’ gender and school characteristics (i.e. school governance type, school size and school intake of students from socio-economically disadvantaged homes).
Source: OECD, TALIS 2024 Database, Table 2.4.
Gender
Gender balance is an important consideration in occupations because it promotes equal opportunity while ensuring that talent and perspectives are drawn from the full population (Azmat and Boring, 2020[6]; Fine, Sojo and Lawford-Smith, 2020[7]).
School leadership is more gender-balanced than the teaching workforce, on average (Figure 2.4). However, this pattern varies across education systems: school leadership is male-dominated in some, while in others the feminisation of the teaching profession is also reflected among principals. Based on TALIS 2024 data, the share of female principals ranges from 30% or below in Japan, Korea, Kosovo, Morocco, Türkiye and Uzbekistan to above 70% in Brazil, Bulgaria, Estonia, Iceland, Italy, Latvia, Poland and Romania.
Where women are overrepresented among principals, they also tend to be overrepresented among teachers. Since most principals were previously teachers, improving gender balance in school leadership starts with recruiting more male teachers. Conversely, systems with low shares of female principals should examine whether women face barriers to leadership. Research shows that women often face structural and cultural barriers when pursuing school leadership positions, including biased hiring practices, exclusion from informal networks, limited mentoring opportunities and stereotypes about leadership (Harris et al., 2024[8]; Martínez, Molina-López and de Cabo, 2021[9]; Murakami and Törnsen, 2017[10]).
Percentage of female lower secondary principals and teachers
Note: *Estimates should be interpreted with caution due to a higher risk of non-response bias.
Statistically significant differences are highlighted with filled circles and solid lines (see Annex B).
Education systems are sorted in descending order by the percentage of lower secondary female principals.
Source: OECD, TALIS 2024 Database, Table 2.7.
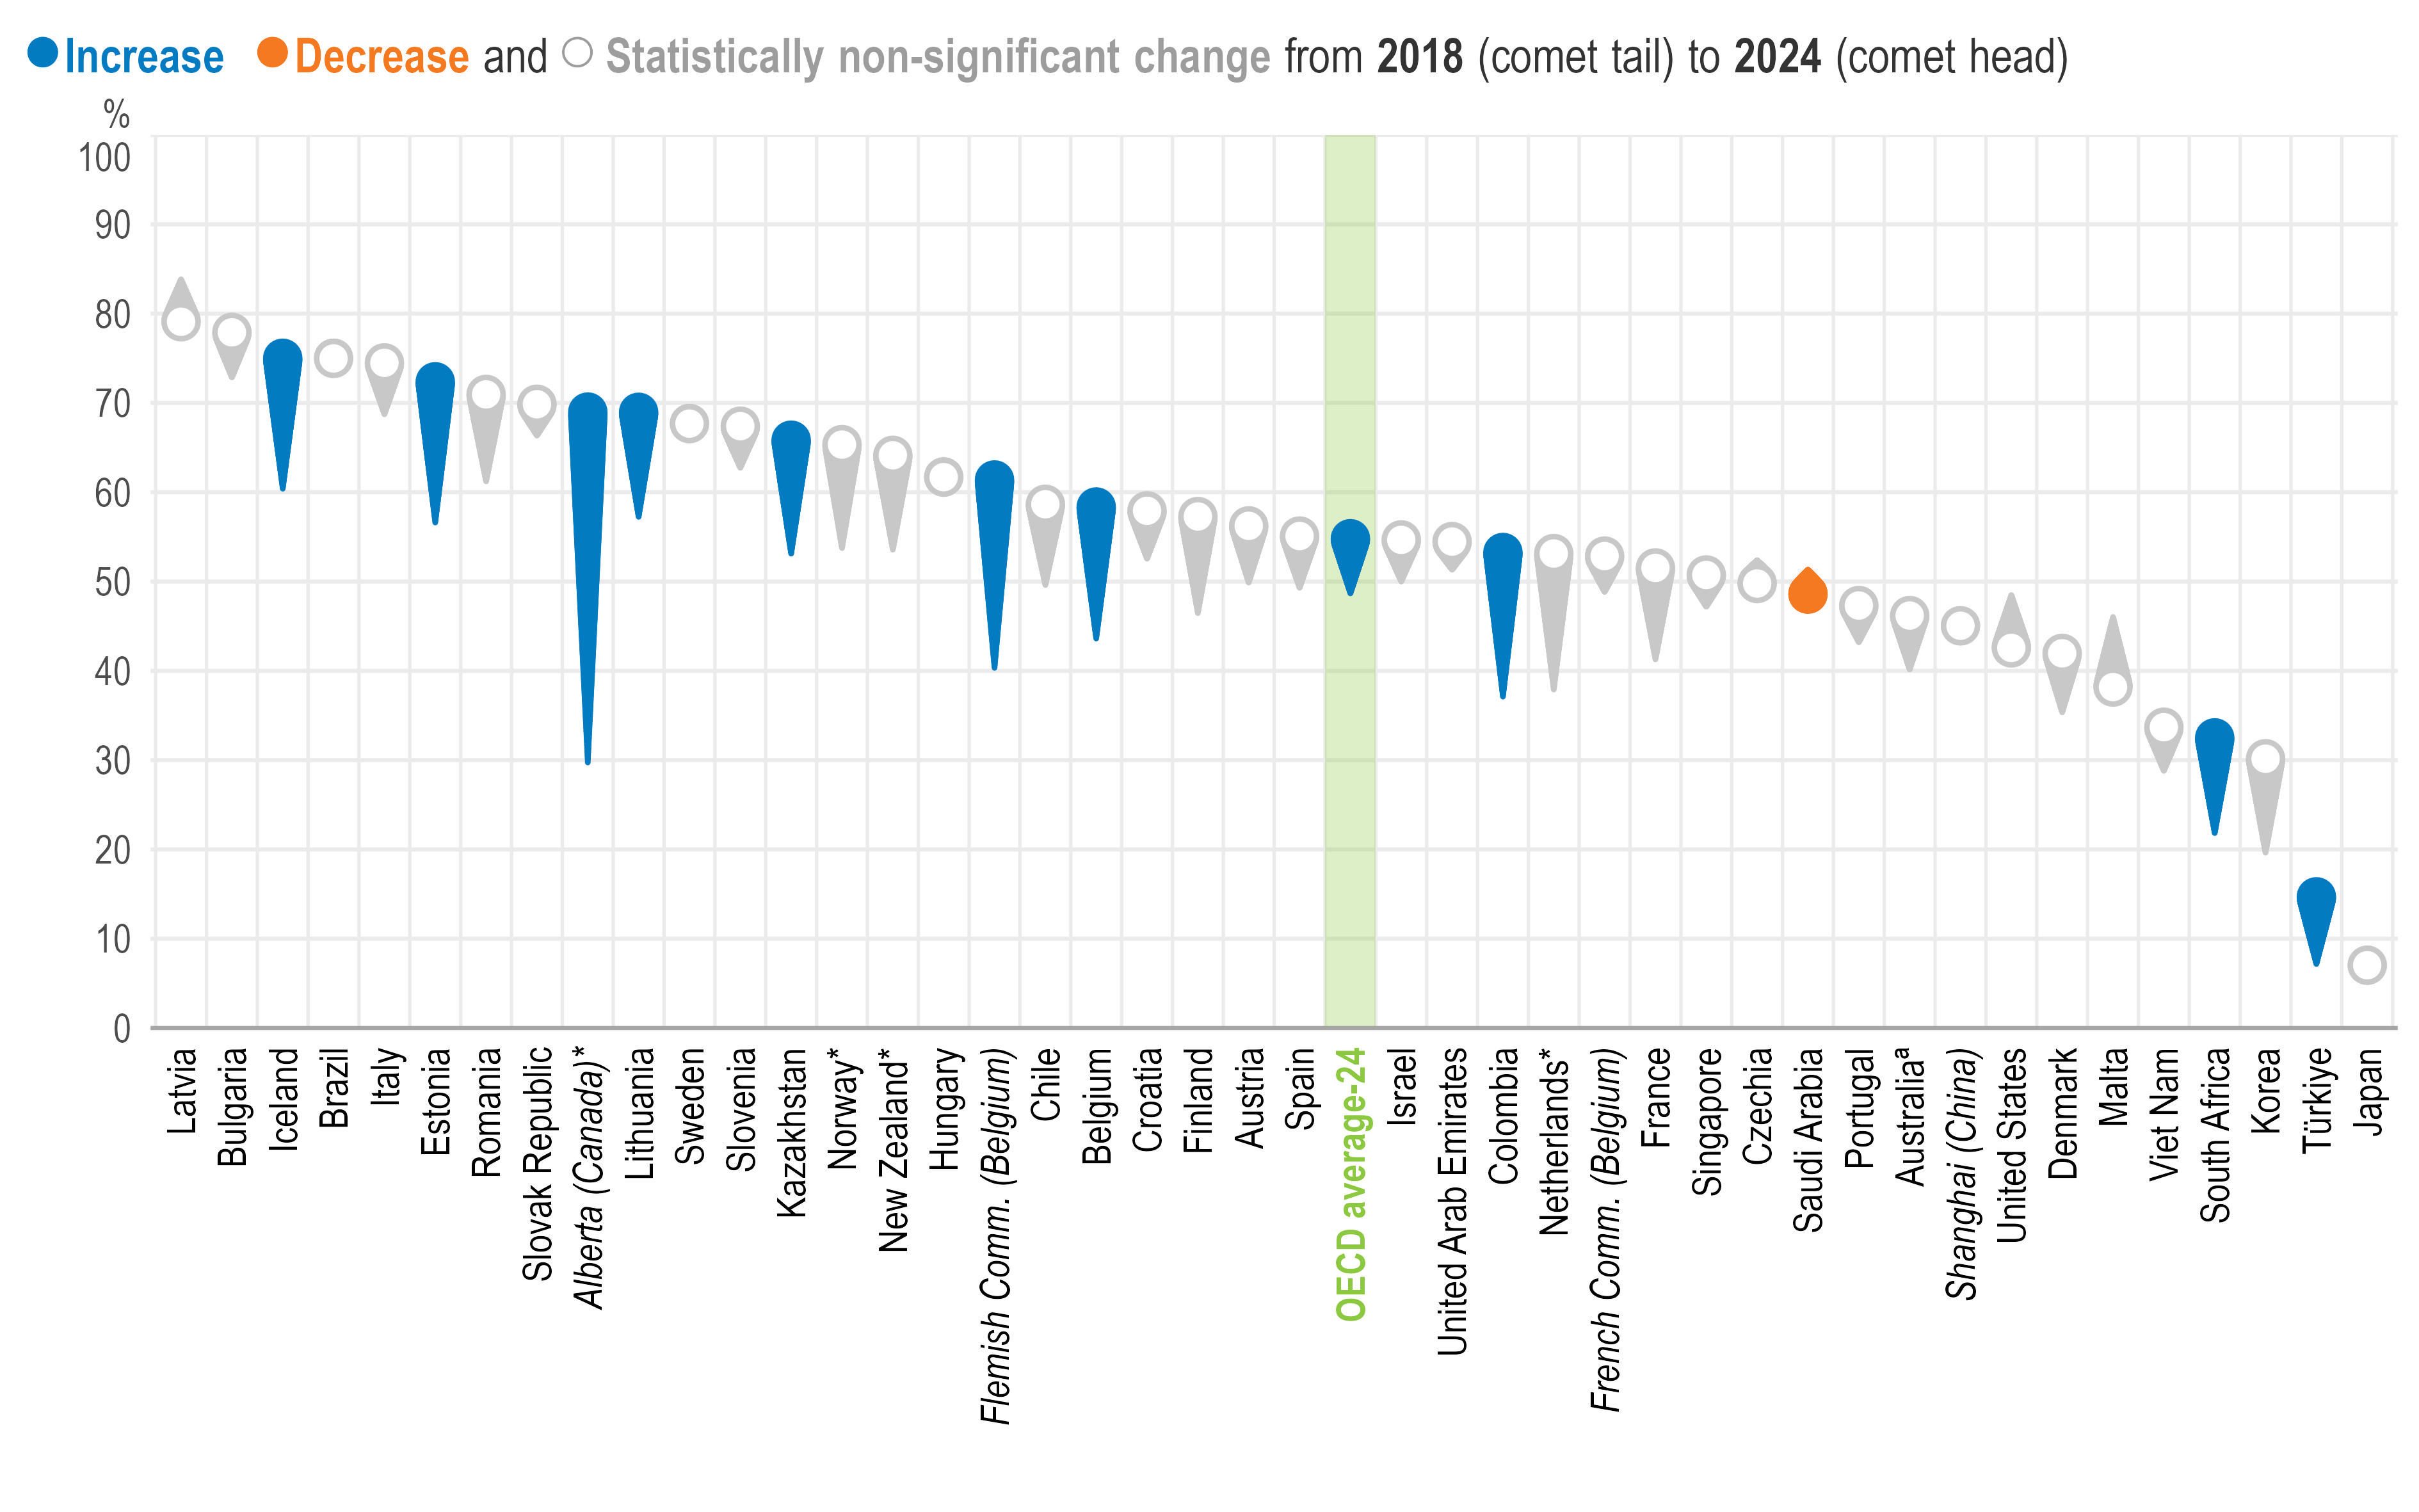
On average, the share of female principals increased by 6 percentage points, from 49% to 55%, between 2018 and 2024 (Figure 2.5). Some education systems, such as Brazil and Estonia, promote equity in school leadership through transparent, merit-based recruitment (Box 2.2). South Africa provides targeted support to reduce barriers to women’s advancement, while some, such as Colombia, combines both approaches (Box 2.2).
Percentage of female lower secondary principals
Note: *Estimates should be interpreted with caution due to a higher risk of non-response bias.
ª Estimates for TALIS 2018 and the change between TALIS 2018 and TALIS 2024 should be interpreted with caution due to a higher risk of non-response bias.
Education systems are sorted in descending order by the percentage of female lower secondary principals in 2024.
Source: OECD, TALIS 2018 and TALIS 2024 Databases, Table 2.8.
In Brazil, Conditionality I of the Value-Added Annual Total per Student Results (VAAR) component of the Fund for the Maintenance and Development of Basic Education and the Valorisation of Education Professionals (Fundeb), enacted in 2020, ties a portion of federal basic education funding to the adoption of merit-based principal selection processes. To access this funding, educational networks must select principals on the basis of verifiable competencies – including qualifications, management experience and the defence of a pedagogical plan – rather than political appointment. Compliance is publicly monitored through the public Integrated System of Monitoring, Execution and Control (Sistema Integrado de Monitoramento, Execução e Controle) platform. While the policy's primary aims are anti-patronage and educational quality, transparent and competency-based selection may carry an indirect gender effect by reducing reliance on informal networks and political connections, which have historically tended to favour male candidates.
In Estonia, school principals must meet nationally established qualification requirements and are appointed through an open recruitment process. When a principal position becomes vacant, the school owner is required to launch a public competition. Candidates are evaluated by a selection committee that typically includes representatives from various stakeholder groups. The committee is expected to select the candidate best qualified to lead the school. The recruitment process does not include gender-based preferences or quotas.
In Colombia, Decree Law 1278 of 2002 established merit-based recruitment, retention and promotion procedures for teachers and principals through public competitive examinations based on objective criteria, including pedagogical competencies, academic qualifications and professional experience. By relying on transparent selection processes rather than discretionary appointments, the statute provides an equitable framework for access to school leadership positions. This framework has been reinforced by the 2022 CONPES Document 4080, Colombia’s National Public Policy for Gender Equality for Women, which promotes gender mainstreaming across public institutions, encourages women’s leadership and supports investments in postgraduate training for teachers and school leaders. Together, these measures have contributed to increased female representation in school leadership by combining merit-based recruitment with broader efforts to strengthen women’s leadership opportunities and qualifications.
In 2013, South Africa’s Department of Basic Education launched the Support Network for Female Principals in recognition that women made up around 68% of the teaching force but only 36% of principalships. The network was designed to support women already in school leadership roles through peer exchange and formation of sustainable provincial networks. Building on this model, the Eastern Cape Department of Education in August 2022 held a Provincial Women Capacity Building and Wellness Programme, bringing together female principals and deputy principals from all education districts across the province with the aim of empowering women at the workplace and building their capacity to compete for senior positions.
Sources:
Departamento Nacional de Planeación (2022). Documento CONPES 4080: Política Pública Nacional de Equidad de Género para las Mujeres. Bogotá: DNP. Available at: https://colaboracion.dnp.gov.co/CDT/Conpes/Econ%C3%B3micos/4080.pdf
Ministerio de Educación Nacional de Colombia (2002). Decreto Ley 1278 de 2002, por el cual se expide el Estatuto de Profesionalización Docente. Bogotá: Ministerio de Educación Nacional. Available at: https://www.mineducacion.gov.co/1621/articles-86102_archivo_pdf.pdfMinistério da Educação (n.d.). Condicionalidade I – FUNDEB. https://www.gov.br/mec/pt-br/financiamento-da-educacao-basica/como-funciona-fundeb/condicionalidades-e-indicadores/condicionalidades/condicionalidade-i
Eastern Cape Department of Education (2022). ECDoE capacitates Women with leadership skills. ECDoE Newsroom, 20 August 2022. Retrieved from https://eceducation.gov.za/news-details/ecdoe-capacitates-women-with-leadership-skills
European Commission (2020). A Union of Equality: Gender Equality Strategy 2020–2025. COM( 2020) 152 final, 5 March 2020. https://eur-lex.europa.eu/legal-content/EN/TXT/?uri=CELEX%3A52020DC0152
Riigi Teataja (2010). Basic Schools and Upper Secondary Schools Act (Põhikooli- ja gümnaasiumiseadus), consolidated text, in force 28.02.2026–30.12.2026. https://riigiteataja.ee/en/akt/521062016007?leiaKehtiv=
South Africa Department of Basic Education (2013). Launch of the Support Network for Female Principals. Ministry of Basic Education, Pretoria. https://www.gov.za/minister-motshekga-launches-supporting-networks-female-principals
South Africa Department of Basic Education (2022). Eastern Cape Provincial Support Network for Women Leaders. Department of Basic Education, Pretoria.
Identifying the types of schools where gender imbalances in school leadership are most pronounced can inform policies aiming to promote more balanced representation among principals. TALIS 2024 data show consistent differences in gender balance among principals by school governance type and school size. On average, there are lower shares of women principals in publicly managed and larger schools (750 students or more) than in privately managed and smaller ones (fewer than 250 students) (Table 2.9). That may be because publicly managed larger schools often have more formalised and hierarchical career structures, which the literature suggests can reinforce existing gender biases and barriers to women’s advancement into leadership roles (Eagly and Karau, 2002[11]; Harris et al., 2024[12]).
Gender biases can mediate the relationship between principals' gender and how their leadership is perceived by teachers (Eagly, Johannesen-Schmidt and Van Engen, 2003[13]; Eagly and Karau, 2002[11]; Lee, Smith and Cioci, 1993[14]). According to Lee, Smith and Cioci (1993[14]), women teachers tend to feel more empowered in schools led by women principals, whereas men teachers tend to feel less empowered in such settings. The qualitative study conducted by Shaked, Glanz and Gross (2018[15]) highlights that female principals tend to rely on their instructional knowledge and experience, while male principals often rely on their decision-making ability and hierarchical authority.
TALIS 2024 shows that women principals are more highly rated as instructional leaders,4 on average, and in Alberta (Canada), Croatia, Denmark, Estonia, Saudi Arabia and Shanghai (China) (Table 2.10). However, regression analyses also show that, on average:
female teachers tend to rate female principals more highly than male principals as instructional leaders (Table 2.11); and
male teachers are more likely to rate male principals more highly as relational leaders5 compared to female principals (Table 2.12).
Research has shown that the effectiveness of school leadership is context-dependent, hence successful leadership is mediated by school context (Clarke and O’Donoghue, 2017[16]; Hallinger, 2018[17]; Leithwood, Harris and Hopkins, 2020[2]). Understanding how teachers’ perceptions of their principals’ leadership vary across school contexts can help design more targeted and effective policies.
Based on regression analyses, school size is a factor in how teachers perceive their principals’ instructional and relational leadership (Table 2.13). But, other school characteristics, such as location, governance type and intake of students from socio-economically disadvantaged homes, who have language difficulties, or who have special education needs, are not associated with teachers’ views about their principals’ leadership (Tables 2.14, 2.15, 2.16, 2.17 and 2.18).
School size
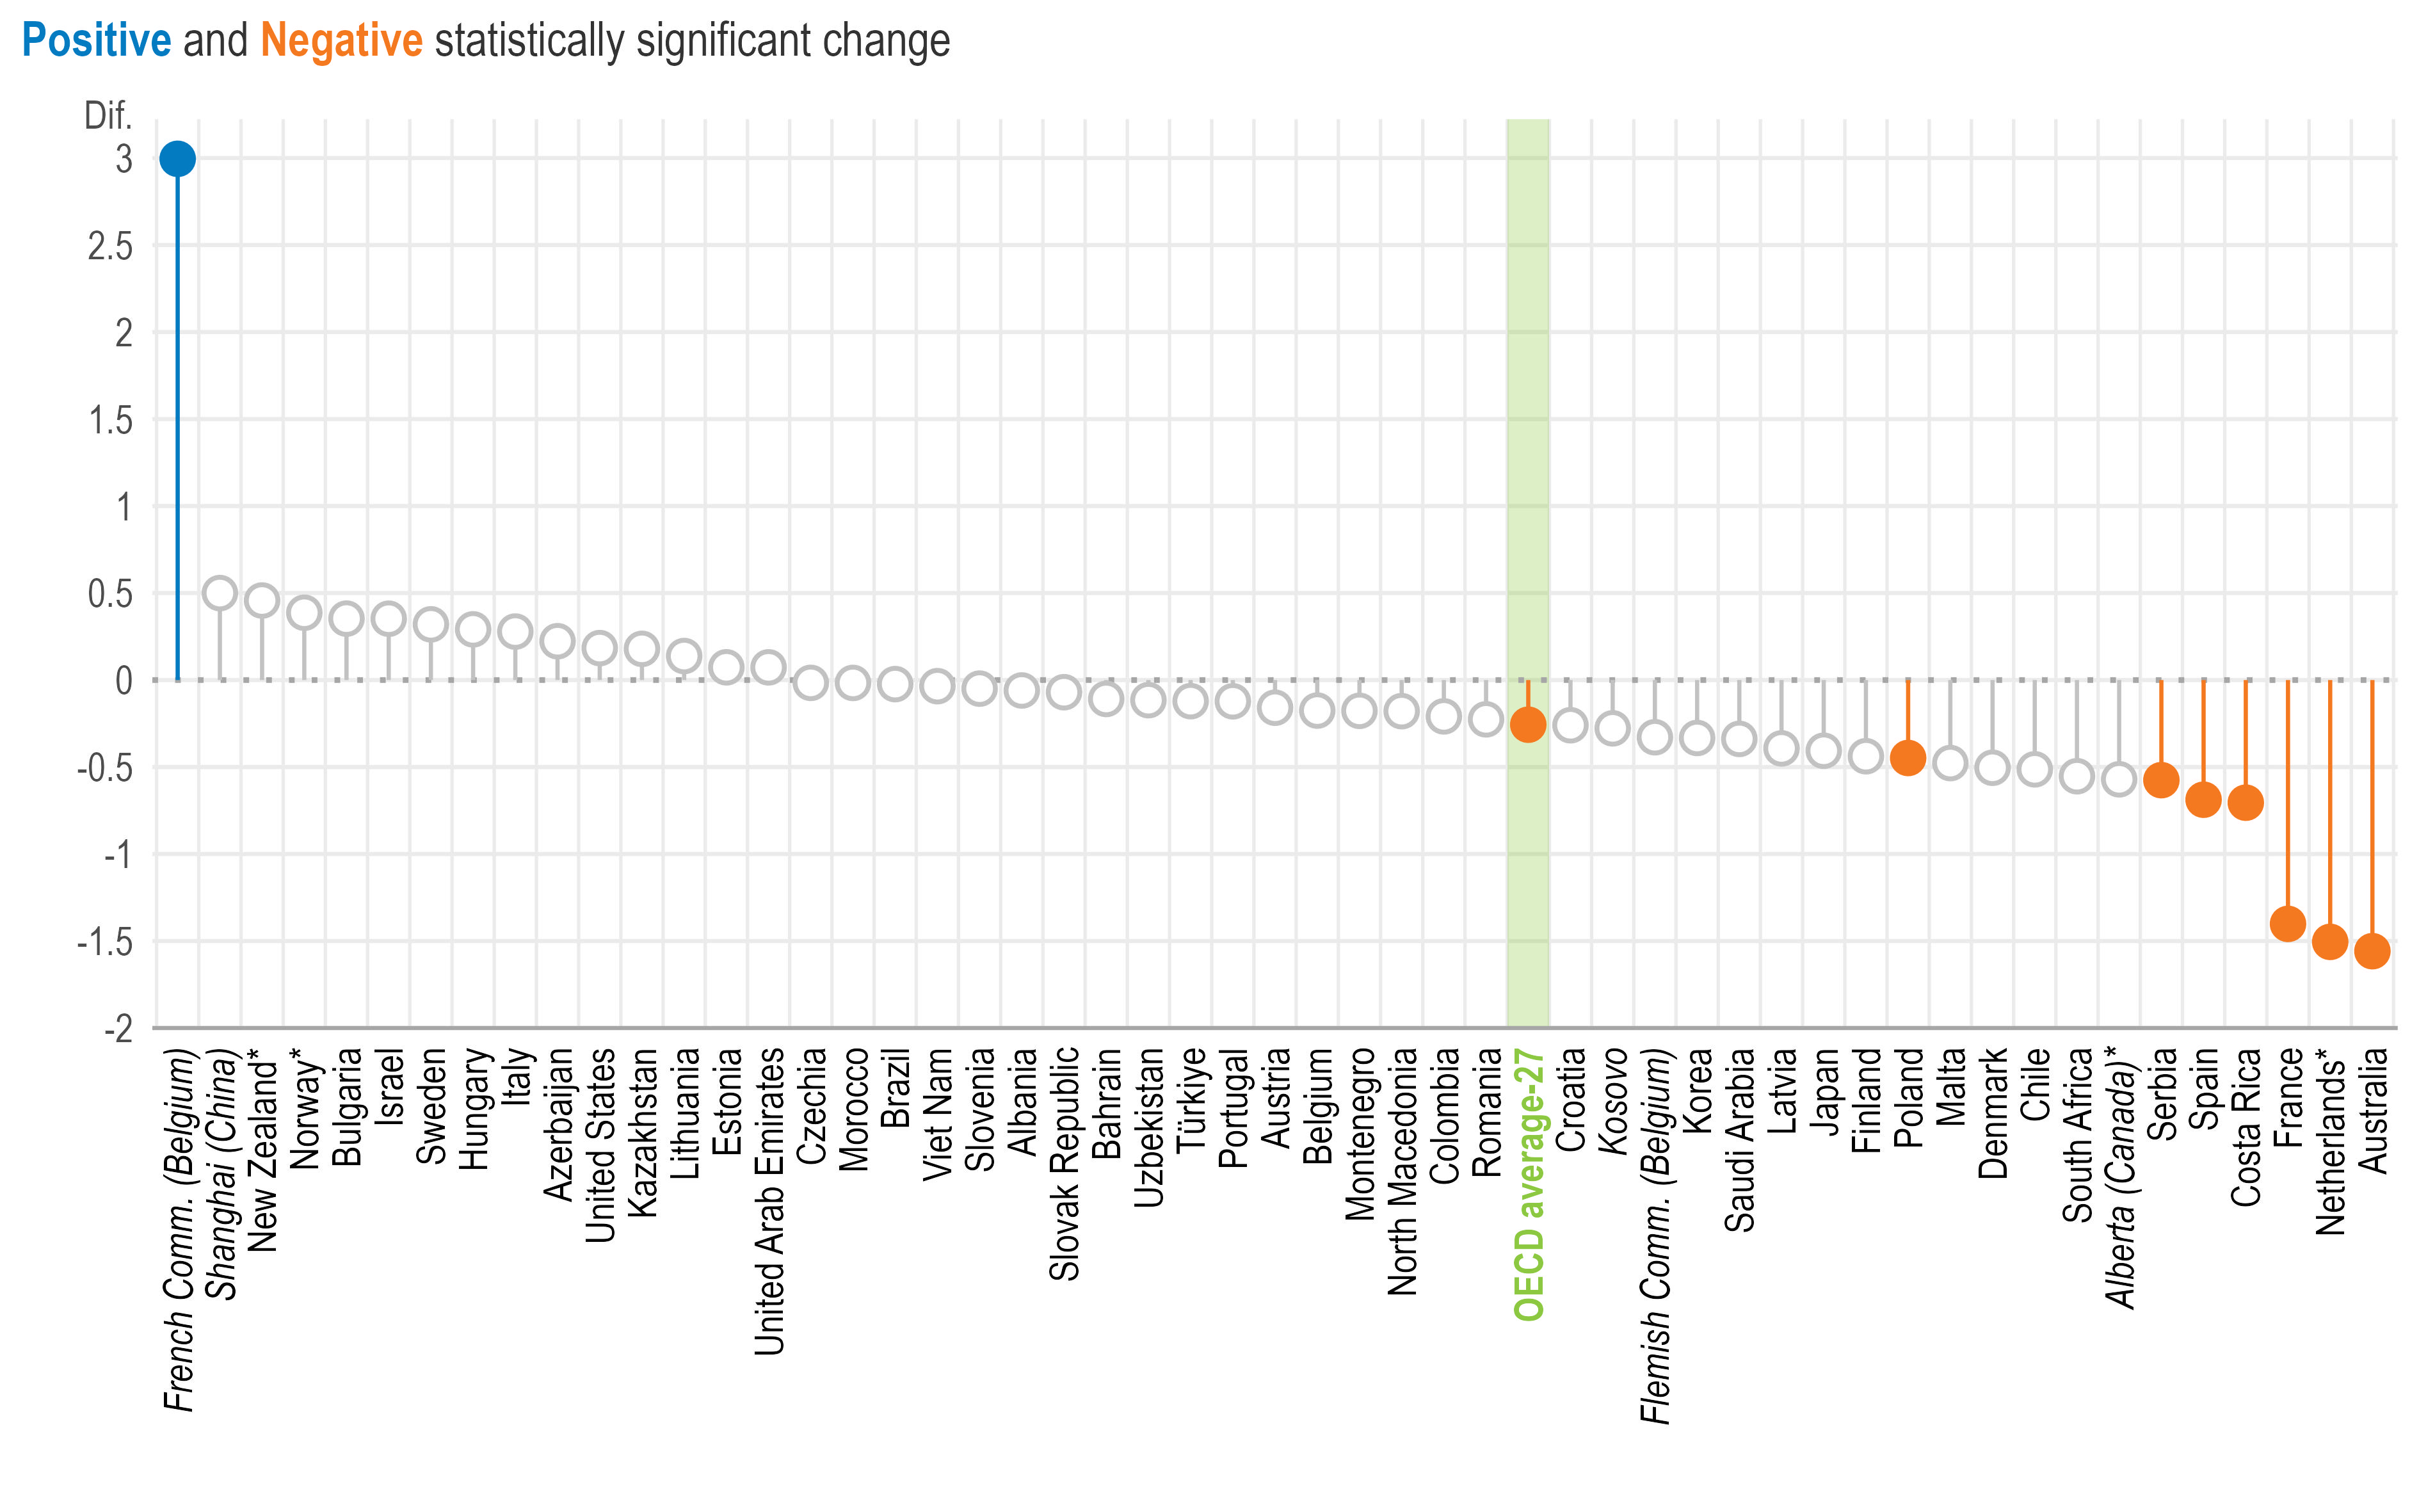
Teachers in larger schools judge their principals to be weaker instructional leaders, on average (Figure 2.6). This holds while controlling for principal and school characteristics, including school location. The only exception is the French Community of Belgium, where principals in larger schools are more valued as instructional leaders than their colleagues in smaller schools.
Several factors may explain this pattern. It could be that onerous administrative demands limit principals’ engagement with teaching and learning. Alternatively, instructional leadership in larger schools may be more often delegated to middle managers within more complex leadership structures. As principals cannot devote much time to teaching, this also likely contributes to the organisational challenges that are more common in larger schools. Consistent with this interpretation, principals who rate themselves highly as instructional leaders also tend to report stronger organisational management skills (Sebastian et al., 2019[18]), suggesting that both forms of leadership become more complex as school size increases.
Change in the school-level average of lower secondary principals’ instructional leadership scale1 associated with larger schools (750 students or more)2,3
Note: *Estimates should be interpreted with caution due to a higher risk of non-response bias.
Statistically significant coefficients are highlighted with filled circles (see Annex B). Filled circles above 0 indicate a positive association, while those below 0 reflect a negative relationship.
1. Standardised scale scores with a standard deviation of 2 and the value of 10 corresponding to the item mid-point value of the response scale. For more information on the scales, see Annex B.
2. The reference category is under 250 students enrolled. The regression model also controls for whether the number of students enrolled is between 250 and 749.
3. Results are based on school-level linear regression analysis controlling for principal characteristics (i.e. gender and age [standardised at the international level]) and school characteristics (i.e. school governance type, school intake of students from socio-economically disadvantaged homes and school location).
Source: OECD, TALIS 2024 Database, Table 2.13.
Teachers in larger schools do not think as highly of their principals as relational leaders as in smaller schools, on average (Table 2.13). This may be because greater organisational complexity limits principals’ interactions with teachers, creating a less connected school climate and compromising strong relational leadership. In Belgium’s French Community and Italy, however, principals in larger schools are more highly rated as relational leaders than their peers in smaller schools.
After accounting for school location, as well as principal and other school characteristics, the link between school size and relational leadership is no longer consistently observed across education systems (Table 2.13). For Italy, for instance, the relationship between school size and relational leadership no longer holds after accounting for school location. This finding suggests that the observed relationship is partly explained by the fact that smaller schools are more often located in less populated, rural communities. In most education systems, larger schools tend to be in urban areas (Table 2.19).
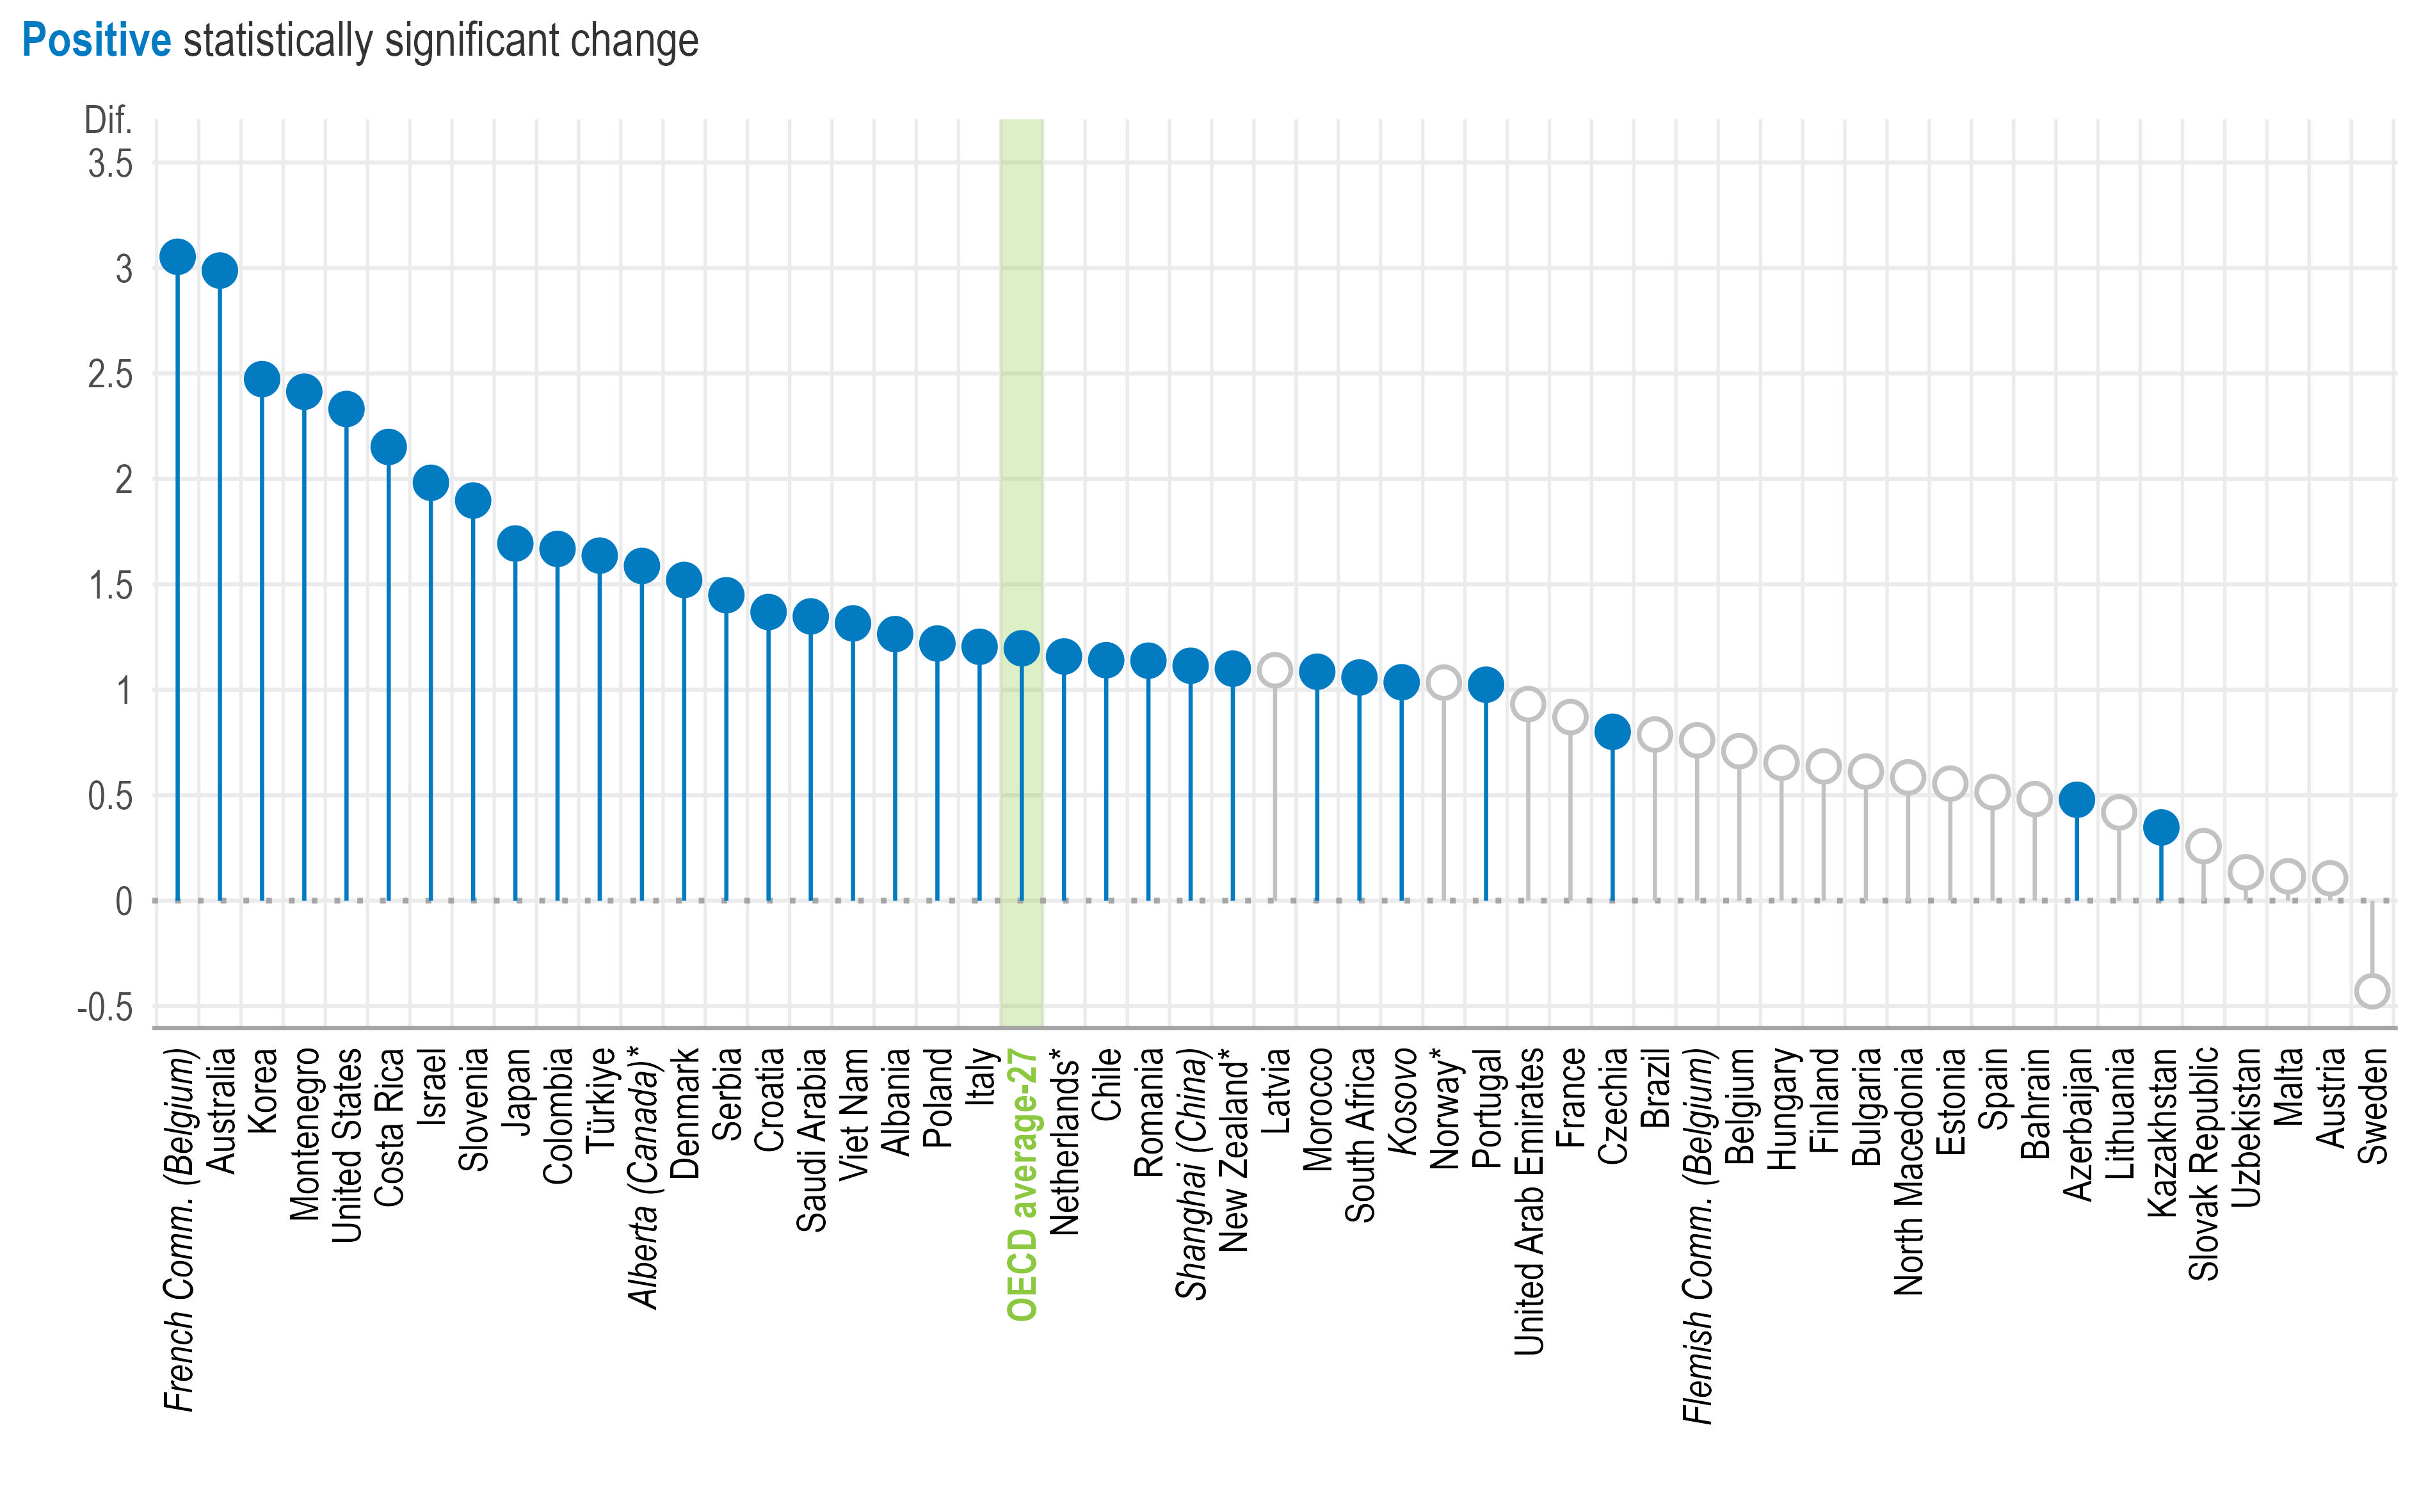
School climate may also help explain why leadership is perceived less positively in larger schools. TALIS 2024 results show that principals in larger schools report more safety and behavioural problems (Figure 2.7), while teachers tend to report poorer teacher-student relations (Table 2.21). Managing these more challenging conditions may demand more of principals’ time and attention, leaving less scope for instructional and relational leadership.
Change in lower secondary principals’ school delinquency and violence scale1 associated with larger schools (750 students or more)2,3
Note: *Estimates should be interpreted with caution due to a higher risk of non-response bias.
Statistically significant coefficients are highlighted with filled circles (see Annex B). Filled circles above 0 indicate a positive association, while those below 0 reflect a negative relationship.
1. Standardised scale scores with a standard deviation of 2 and the value of 10 corresponding to the item mid-point value of the response scale. For more information on the scales, see Annex B.
2. The reference category is under 250 students enrolled. The regression model also controls for whether the number of students enrolled is between 250 and 749.
3. Results are based on school-level linear regression analysis controlling for principal characteristics (i.e. gender and age [standardised at the international level]) and school characteristics (i.e. school governance type, school intake of students from socio-economically disadvantaged homes and school location).
Source: OECD, TALIS 2024 Database, Table 2.20.
Individual factors
On average in primary education, older principals are less likely to be perceived by teachers as strong relational leaders (Table 2.4). The opposite pattern is observed in the United Arab Emirates, where principals’ age is positively associated with valued leadership. The United Arab Emirates has also seen an ageing of its principal population in primary education. Between 2018 and 2024, the average age of principals increased by 3 years, from 49 to 52 (Table 2.2).
On average, primary principals tend to be older in urban and larger schools (750 students or more), and schools with a smaller share of socio-economically disadvantaged students (10% or less) or no students with difficulties understanding the language(s) of instruction; this, compared to in rural and smaller schools (fewer than 250 students), and schools with higher shares of these student populations (Table 2.1).
The gender composition of primary school leadership differs markedly from lower secondary education: on average, the share of female principals in primary education is 10 percentage points higher than in lower secondary education (Table 2.9). This gap varies considerably, however, from 11 percentage points in Saudi Arabia to 26 percentage points in France. In primary education, female principals are more commonly found in privately managed and smaller schools, and in those with 10% or fewer socio-economically disadvantaged students.
School contexts
Teachers in larger schools and schools where a larger share of students have difficulties understanding the language(s) of instruction (11% or more) rate primary principals lower as both instructional and relational leaders than principals in smaller schools and schools without such students (Tables 2.13 and 2.17).
Job satisfaction and well-being
Similar to lower secondary education, over 90% of primary principals are, on average, satisfied with their jobs (Table 2.22). In primary education, experienced principals (with 10 or more years' experience) are more likely to report being satisfied with their jobs.
Primary school principals who report having extra duties due to absent school staff or being intimidated or verbally abused by students as sources of stress "quite a bit" or "a lot" score lower on instructional leadership (Table 2.32). Women principals are more likely, on average, to report extra duties due to absent staff as a major source of stress (Table 2.34). Between 2018 and 2024, four out of nine education systems saw an increase in the share of principals reporting this stressor, ranging from a 13 percentage point-increase in Spain to 30 percentage points in Australiaª (Table 2.33). On average, too much administrative work is a more common source of stress for primary principals than for their peers in lower secondary education (Table 2.36). Within primary education, principals in publicly managed schools, in schools with a larger share of students from socio-economically disadvantaged homes and a larger share of students with special education needs (above 30%) are more likely to report administrative work as a source of stress.
Note: ª Estimates for TALIS 2018 and the change between TALIS 2018 and TALIS 2024 should be interpreted with caution due to a higher risk of non-response bias.
There is ample research evidence that shows the positive association between employee well-being, job satisfaction and performance (Bakker and Demerouti, 2007[19]; Harter, Schmidt and Hayes, 2002[20]; Judge et al., 2001[21]; Warr, 1999[22]). Leithwood, Harris and Hopkins (2020[2]) argue that successful school leaders sustain staff motivation, resilience and organisational commitment. Principals who are satisfied with their jobs are generally better able to foster such environments.
Job satisfaction
TALIS measures job satisfaction by asking principals to rate their agreement (“strongly disagree”; “disagree”; “agree”; “strongly agree”) with statements reflecting both positive and negative aspects of their profession (“The advantages of this profession clearly outweigh the disadvantages”; “If I could decide again, I would still choose this job/position”; “I regret that I decided to become a principal”; “All in all, I am satisfied with my job”) and current work environment (“I would like to change to another school if that were possible”; “I enjoy working at this school”; “I would recommend this school as a good place to work”). The scale of job satisfaction is based on these items.6
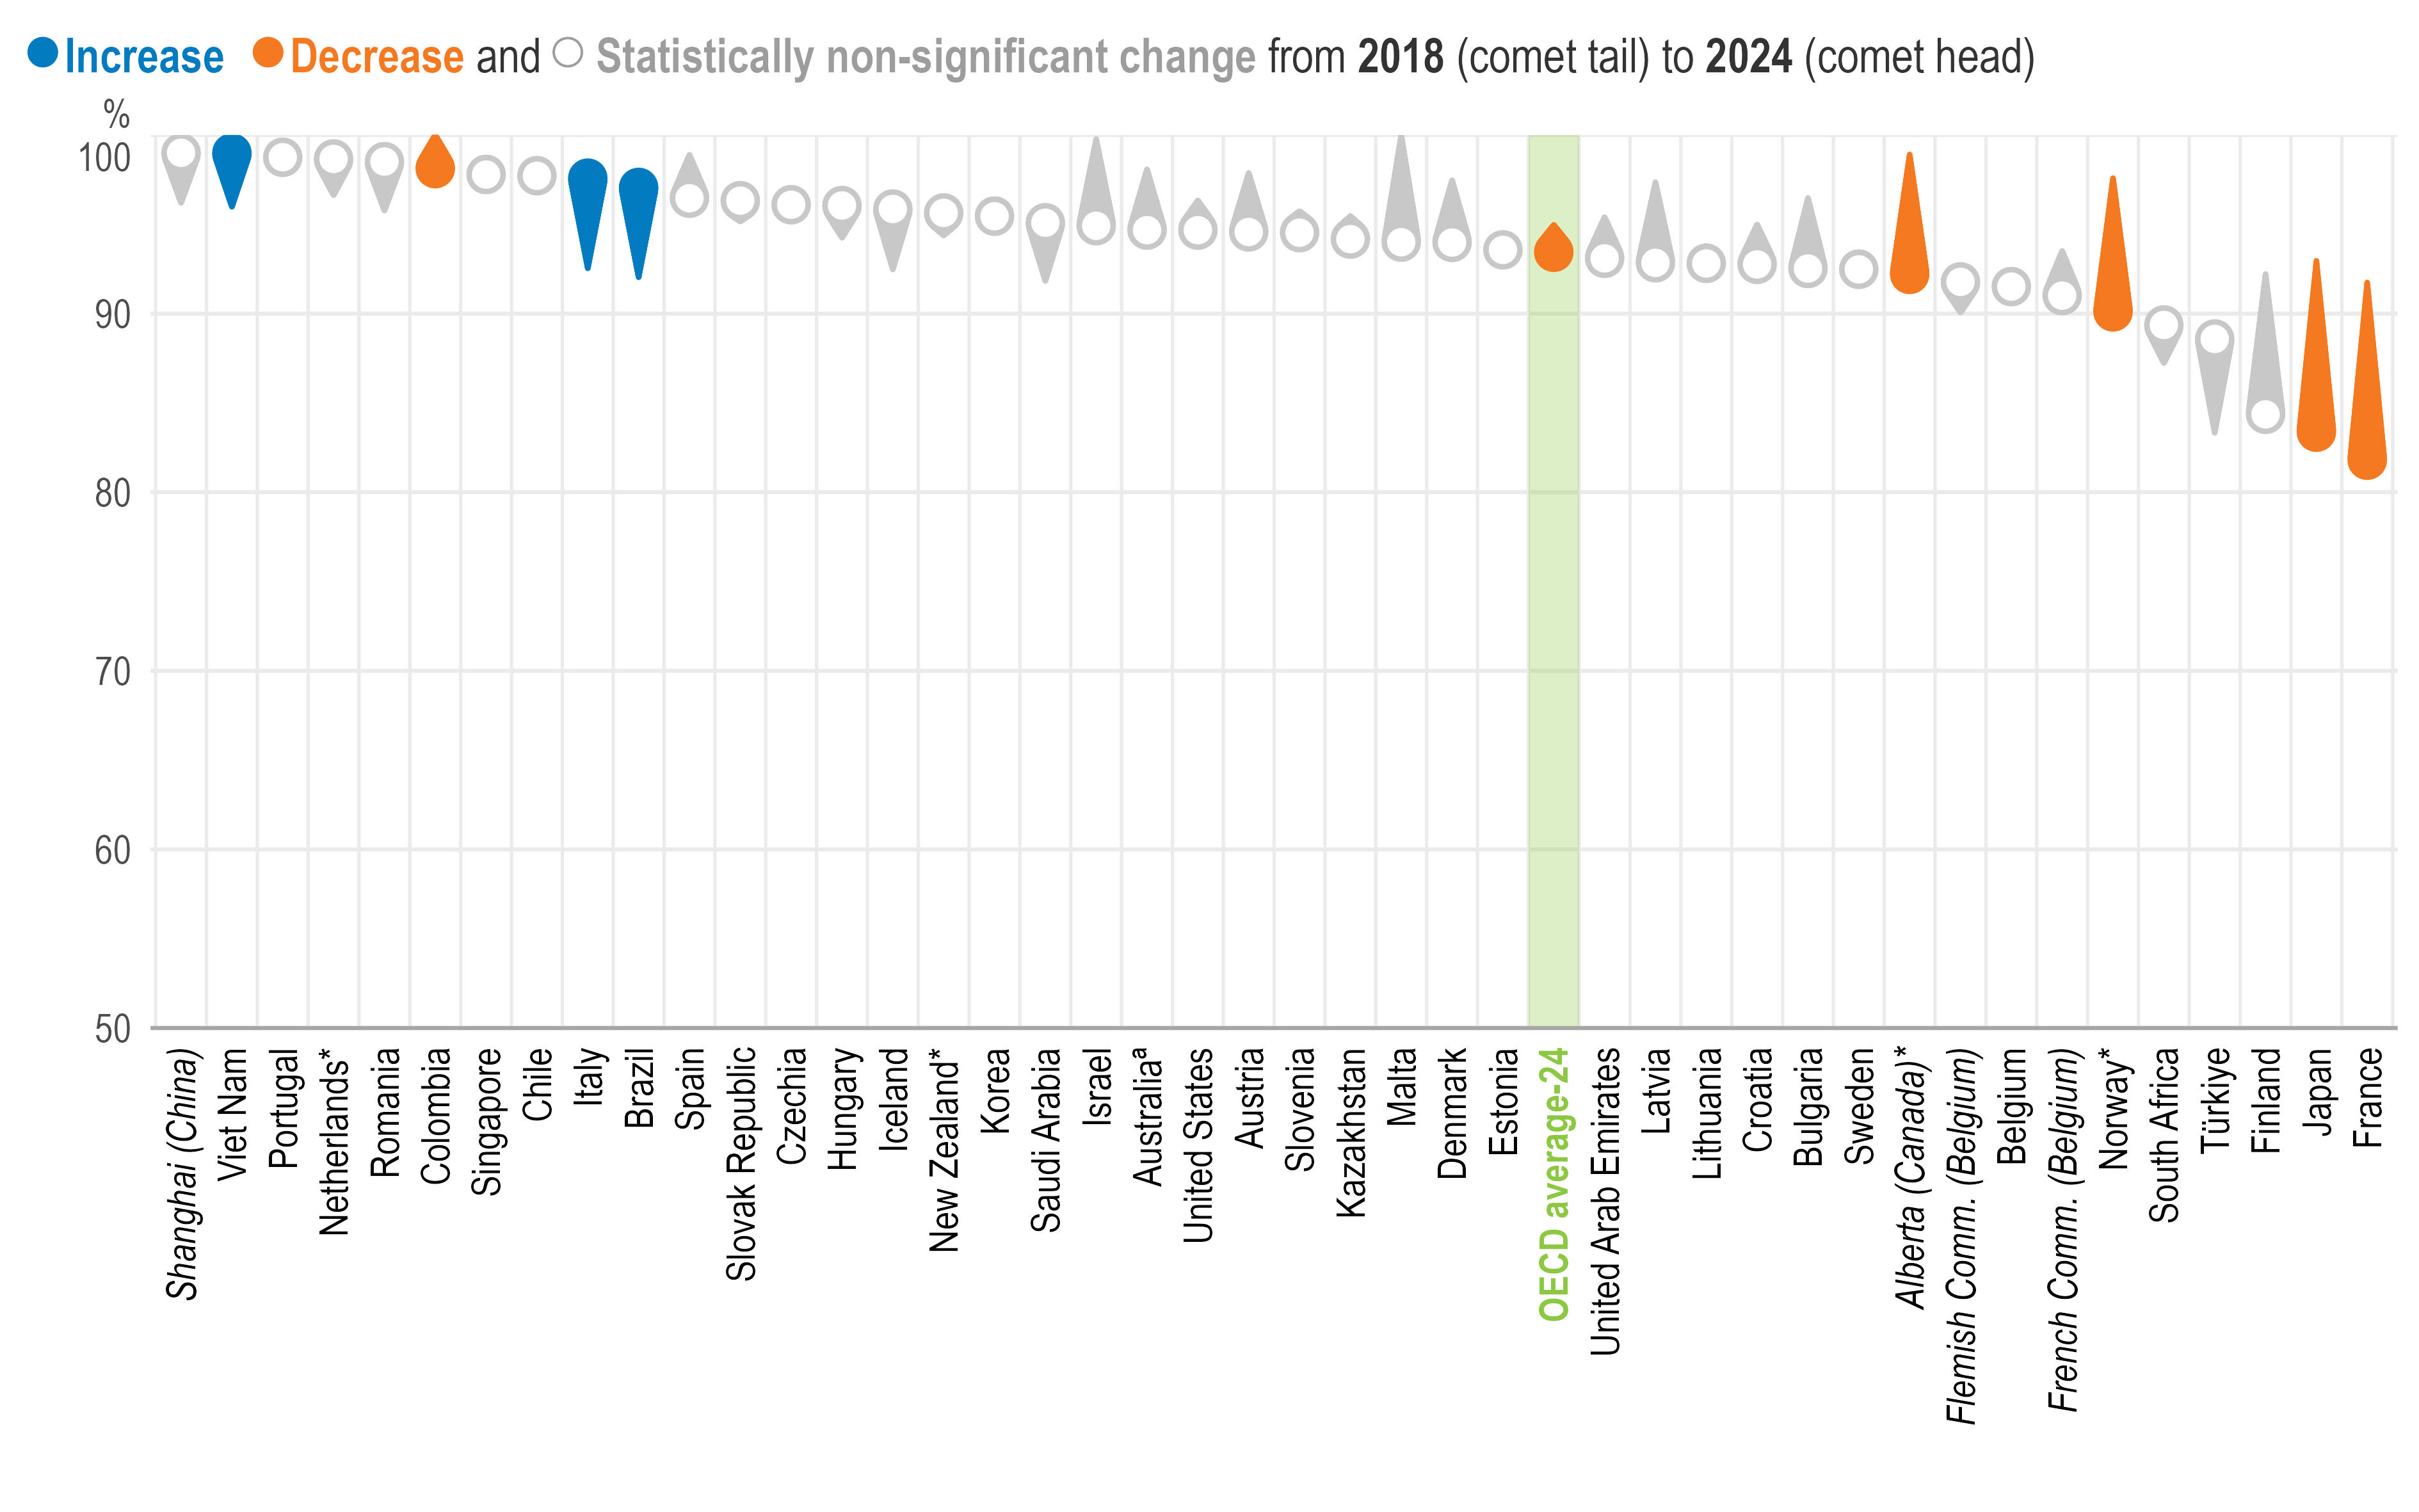
Percentage of lower secondary principals who "agree" or "strongly agree" that, all in all, they are satisfied with their jobs
Note: *Estimates should be interpreted with caution due to a higher risk of non-response bias.
ª Estimates for TALIS 2018 and the change between TALIS 2018 and TALIS 2024 should be interpreted with caution due to a higher risk of non-response bias.
Education systems are sorted in descending order according to the percentage of lower secondary principals in 2024 who "agree" or "strongly agree" that, all in all, they are satisfied with their jobs.
Source: OECD, TALIS 2018 and TALIS 2024 Databases, Table 2.23.
Over 90% of principals are, all in all, satisfied with their jobs (Table 2.22) in most education systems. Yet, in Alberta (Canada)*, France, Japan and Norway*, the share of principals satisfied with their jobs decreased by 7 to 10 percentage points between 2018 and 2024 (Figure 2.8).
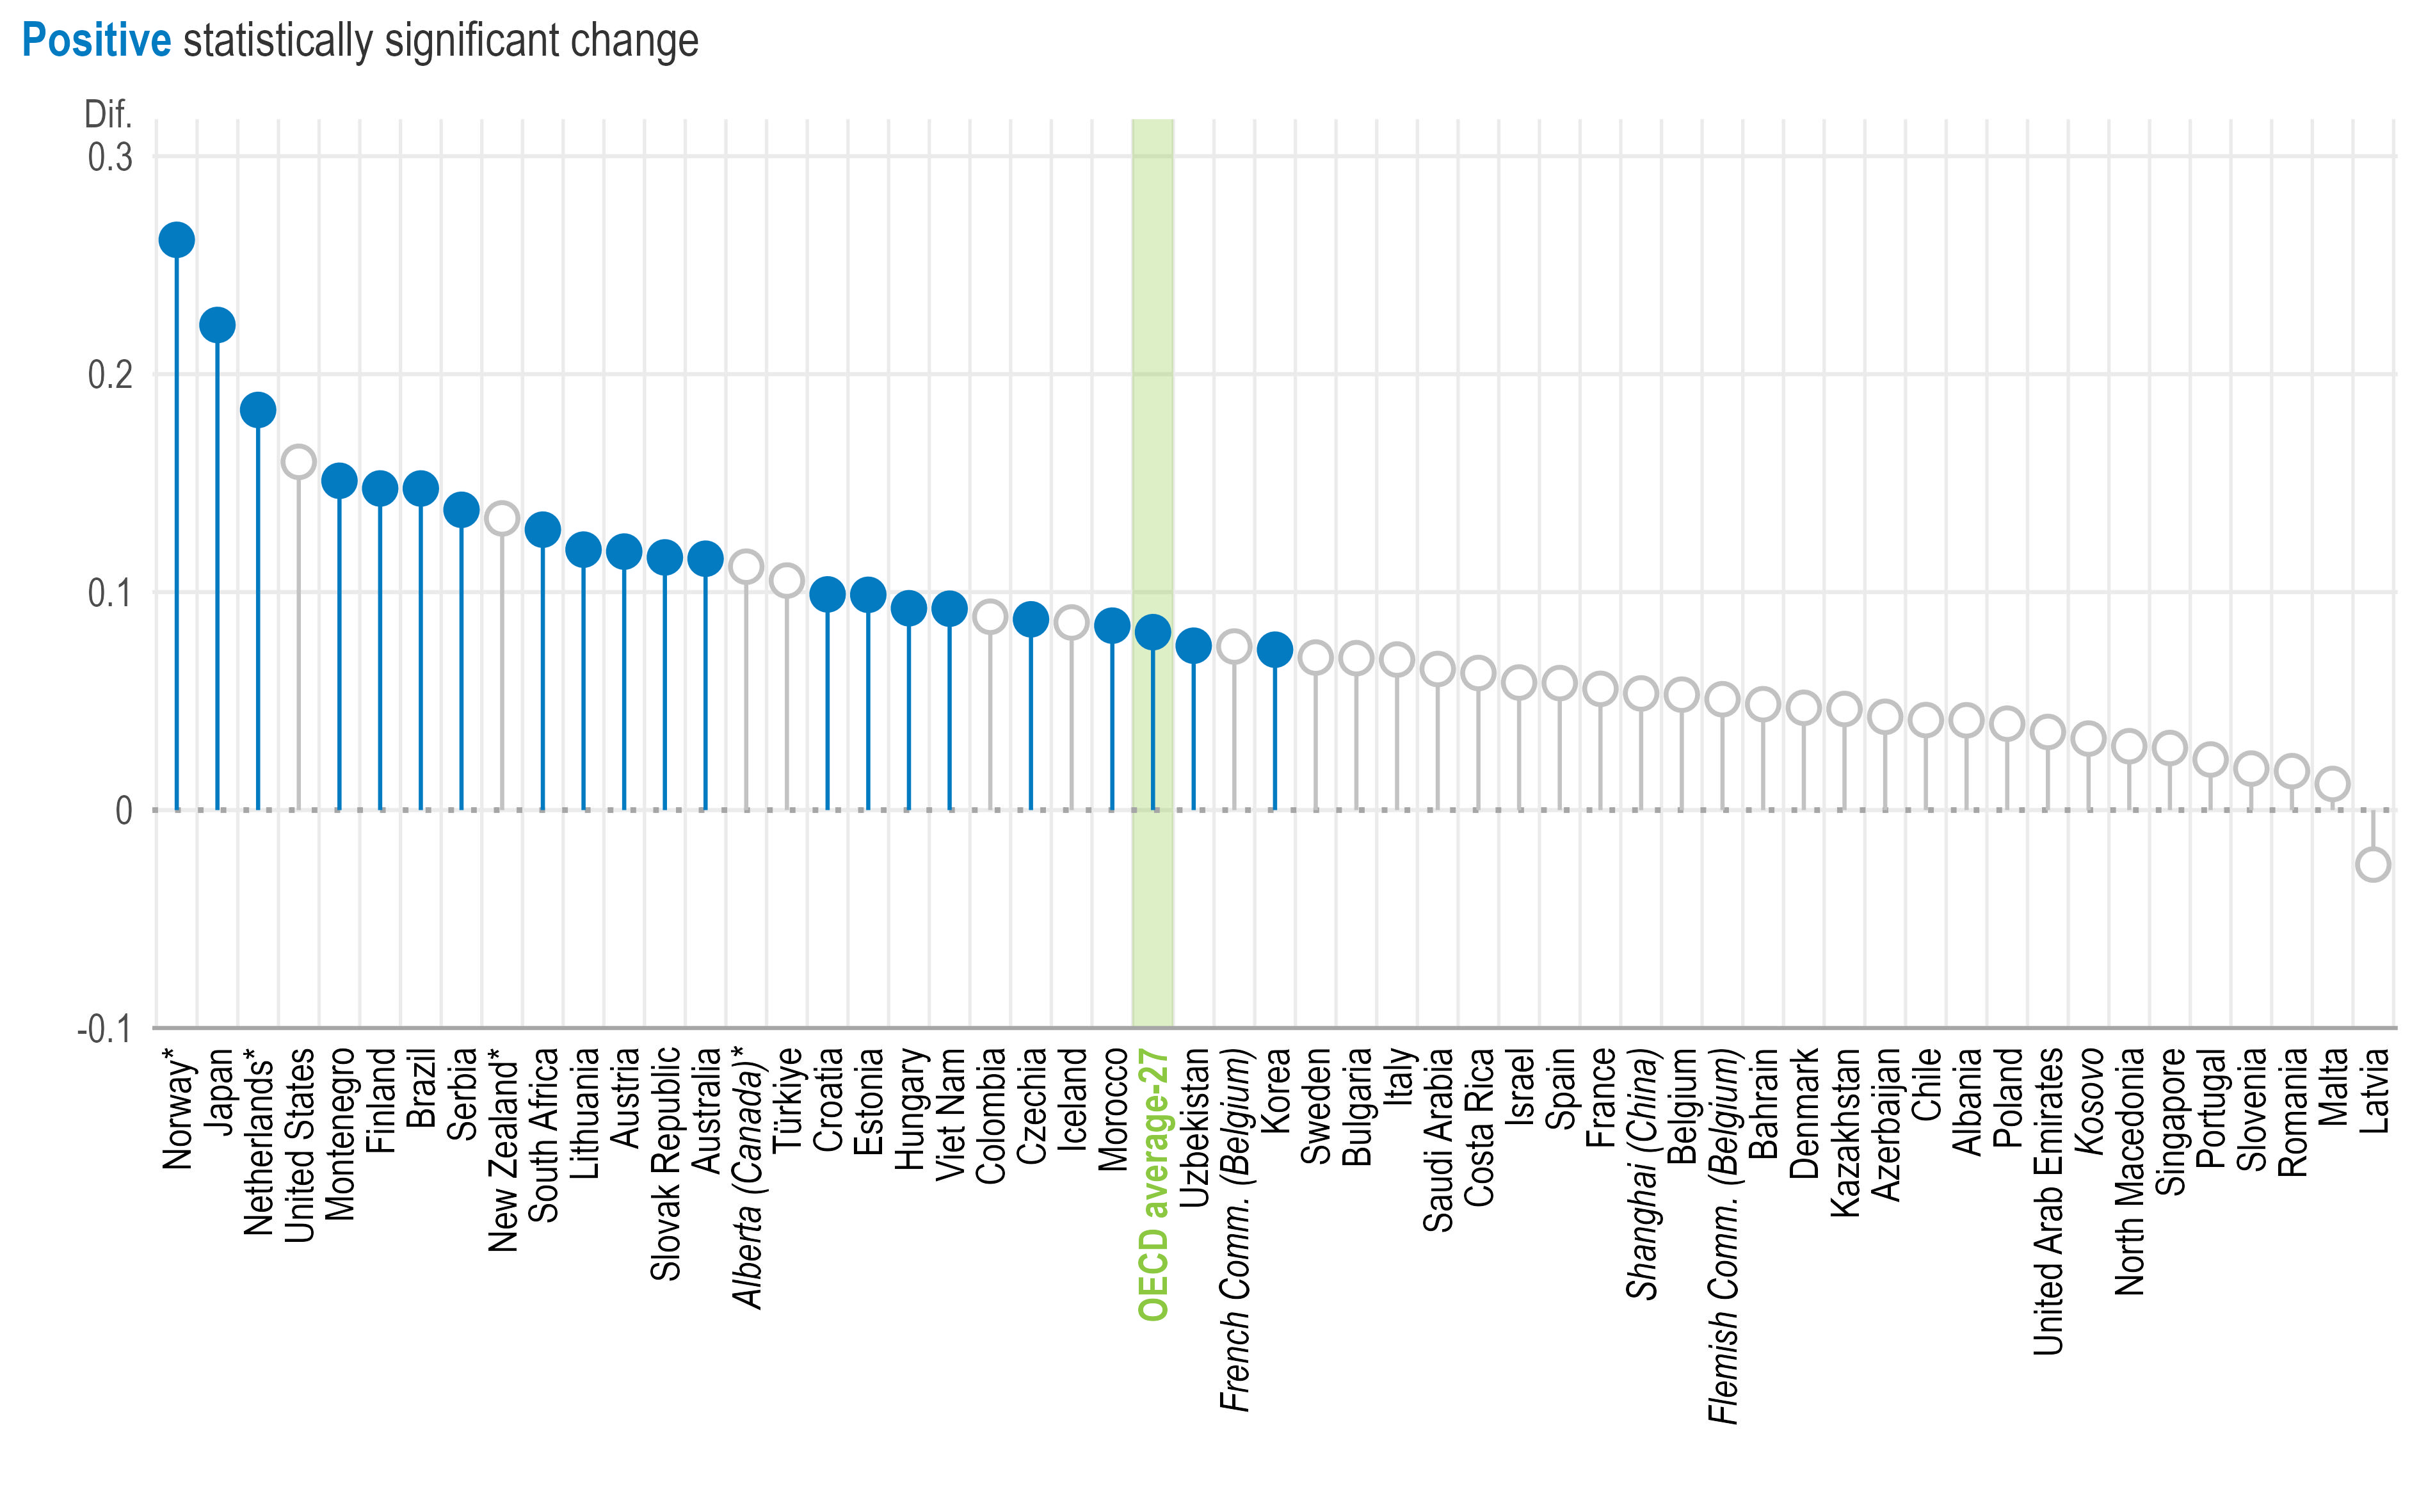
Principals who are, overall, satisfied with their jobs tend to be more valued by their teachers, both as instructional (Figure 2.9) and relational leaders (Table 2.25). Principals who feel supported and satisfied in their roles likely make more effective leaders and build stronger relationships with teachers. And feeling appreciated by their teachers, in turn, reinforces their job satisfaction and sense of effectiveness.
Change in the school-level average of lower secondary principals’ instructional leadership scale1 associated with a one-unit increase in the scale of job satisfaction1,2
Note: *Estimates should be interpreted with caution due to a higher risk of non-response bias.
Statistically significant coefficients are highlighted with filled circles (see Annex B). Filled circles above 0 indicate a positive association, while those below 0 reflect a negative relationship.
1. Standardised scale scores with a standard deviation of 2 and the value of 10 corresponding to the item mid-point value of the response scale. For more information on the scales, see Annex B.
2. Results are based on school-level linear regression analysis controlling for principal characteristics (i.e. gender and age [standardised at the international level]) and school characteristics (i.e. school governance type, school size and school intake of students from socio-economically disadvantaged homes).
Source: OECD, TALIS 2024 Database, Table 2.25.
Malta and Morocco have the widest within-country disparities (over 6 index points, equivalent to more than three standard deviations, between the top and bottom deciles) in principals’ job satisfaction (Table 2.26). The inter-decile range measures the gap between the top 10% and bottom 10% of schools, showing how widely principals’ well-being varies within education systems. This result suggests that individual factors and school contexts are the main drivers of job satisfaction.
Despite being less valued as leaders, older and more experienced (over 10 years) principals tend to be more satisfied with their jobs than their younger and less experienced peers (Table 2.22). On average, the share of principals at age 60 or above who are satisfied with their jobs is 8 percentage points higher compared to principals under age 40. Older and more experienced principals may be more satisfied with their jobs because they have developed greater confidence, stability and coping strategies over time, and may also benefit from greater job security and higher pay (see Chapter 4). Principals who are more satisfied with their work are also more likely to remain in the profession and accumulate experience. Research indicates that younger principals tend to report lower job satisfaction, partly because they experience greater difficulties in their work (Wang, Pollock and Hauseman, 2018[23]).
Principals’ job satisfaction also varies by school size (Table 2.27). On average, the share of principals who are satisfied with their jobs is larger in schools with 750 students or more than in schools with fewer than 250 students. Education systems with the largest differences (between 16 to 22 percentage points) include Finland, Japan and Sweden. Principals in larger schools may report higher job satisfaction because broader professional opportunities make their roles more rewarding. Research shows that opportunities for personal development are a key intrinsic job resource linked to higher job satisfaction (Skaalvik, 2023[24]).
Well-being
TALIS measures principals’ well-being by asking principals to what extent (“not at all”; “to some extent”; “quite a bit”; “a lot”) they experience stress and health issues in their work. Does their job leave them time for their personal life? Does it negatively impact their mental and physical health? The scale of principals’ workplace stress and health issues summarises principals’ responses to these items.7
A certain level of stress can motivate professionals to perform well and take responsibility for their work. However, when stress becomes excessive it can result in mental or physical health problems and burnout. Around three in five (61%) principals report experiencing stress “quite a bit” or “a lot” in their work, on average, ranging from below 20% in Azerbaijan and Kazakhstan to over 80% in Bulgaria, Hungary, Italy, Portugal and Belgium’s Flemish Community (Table 2.28).
Differences in well-being
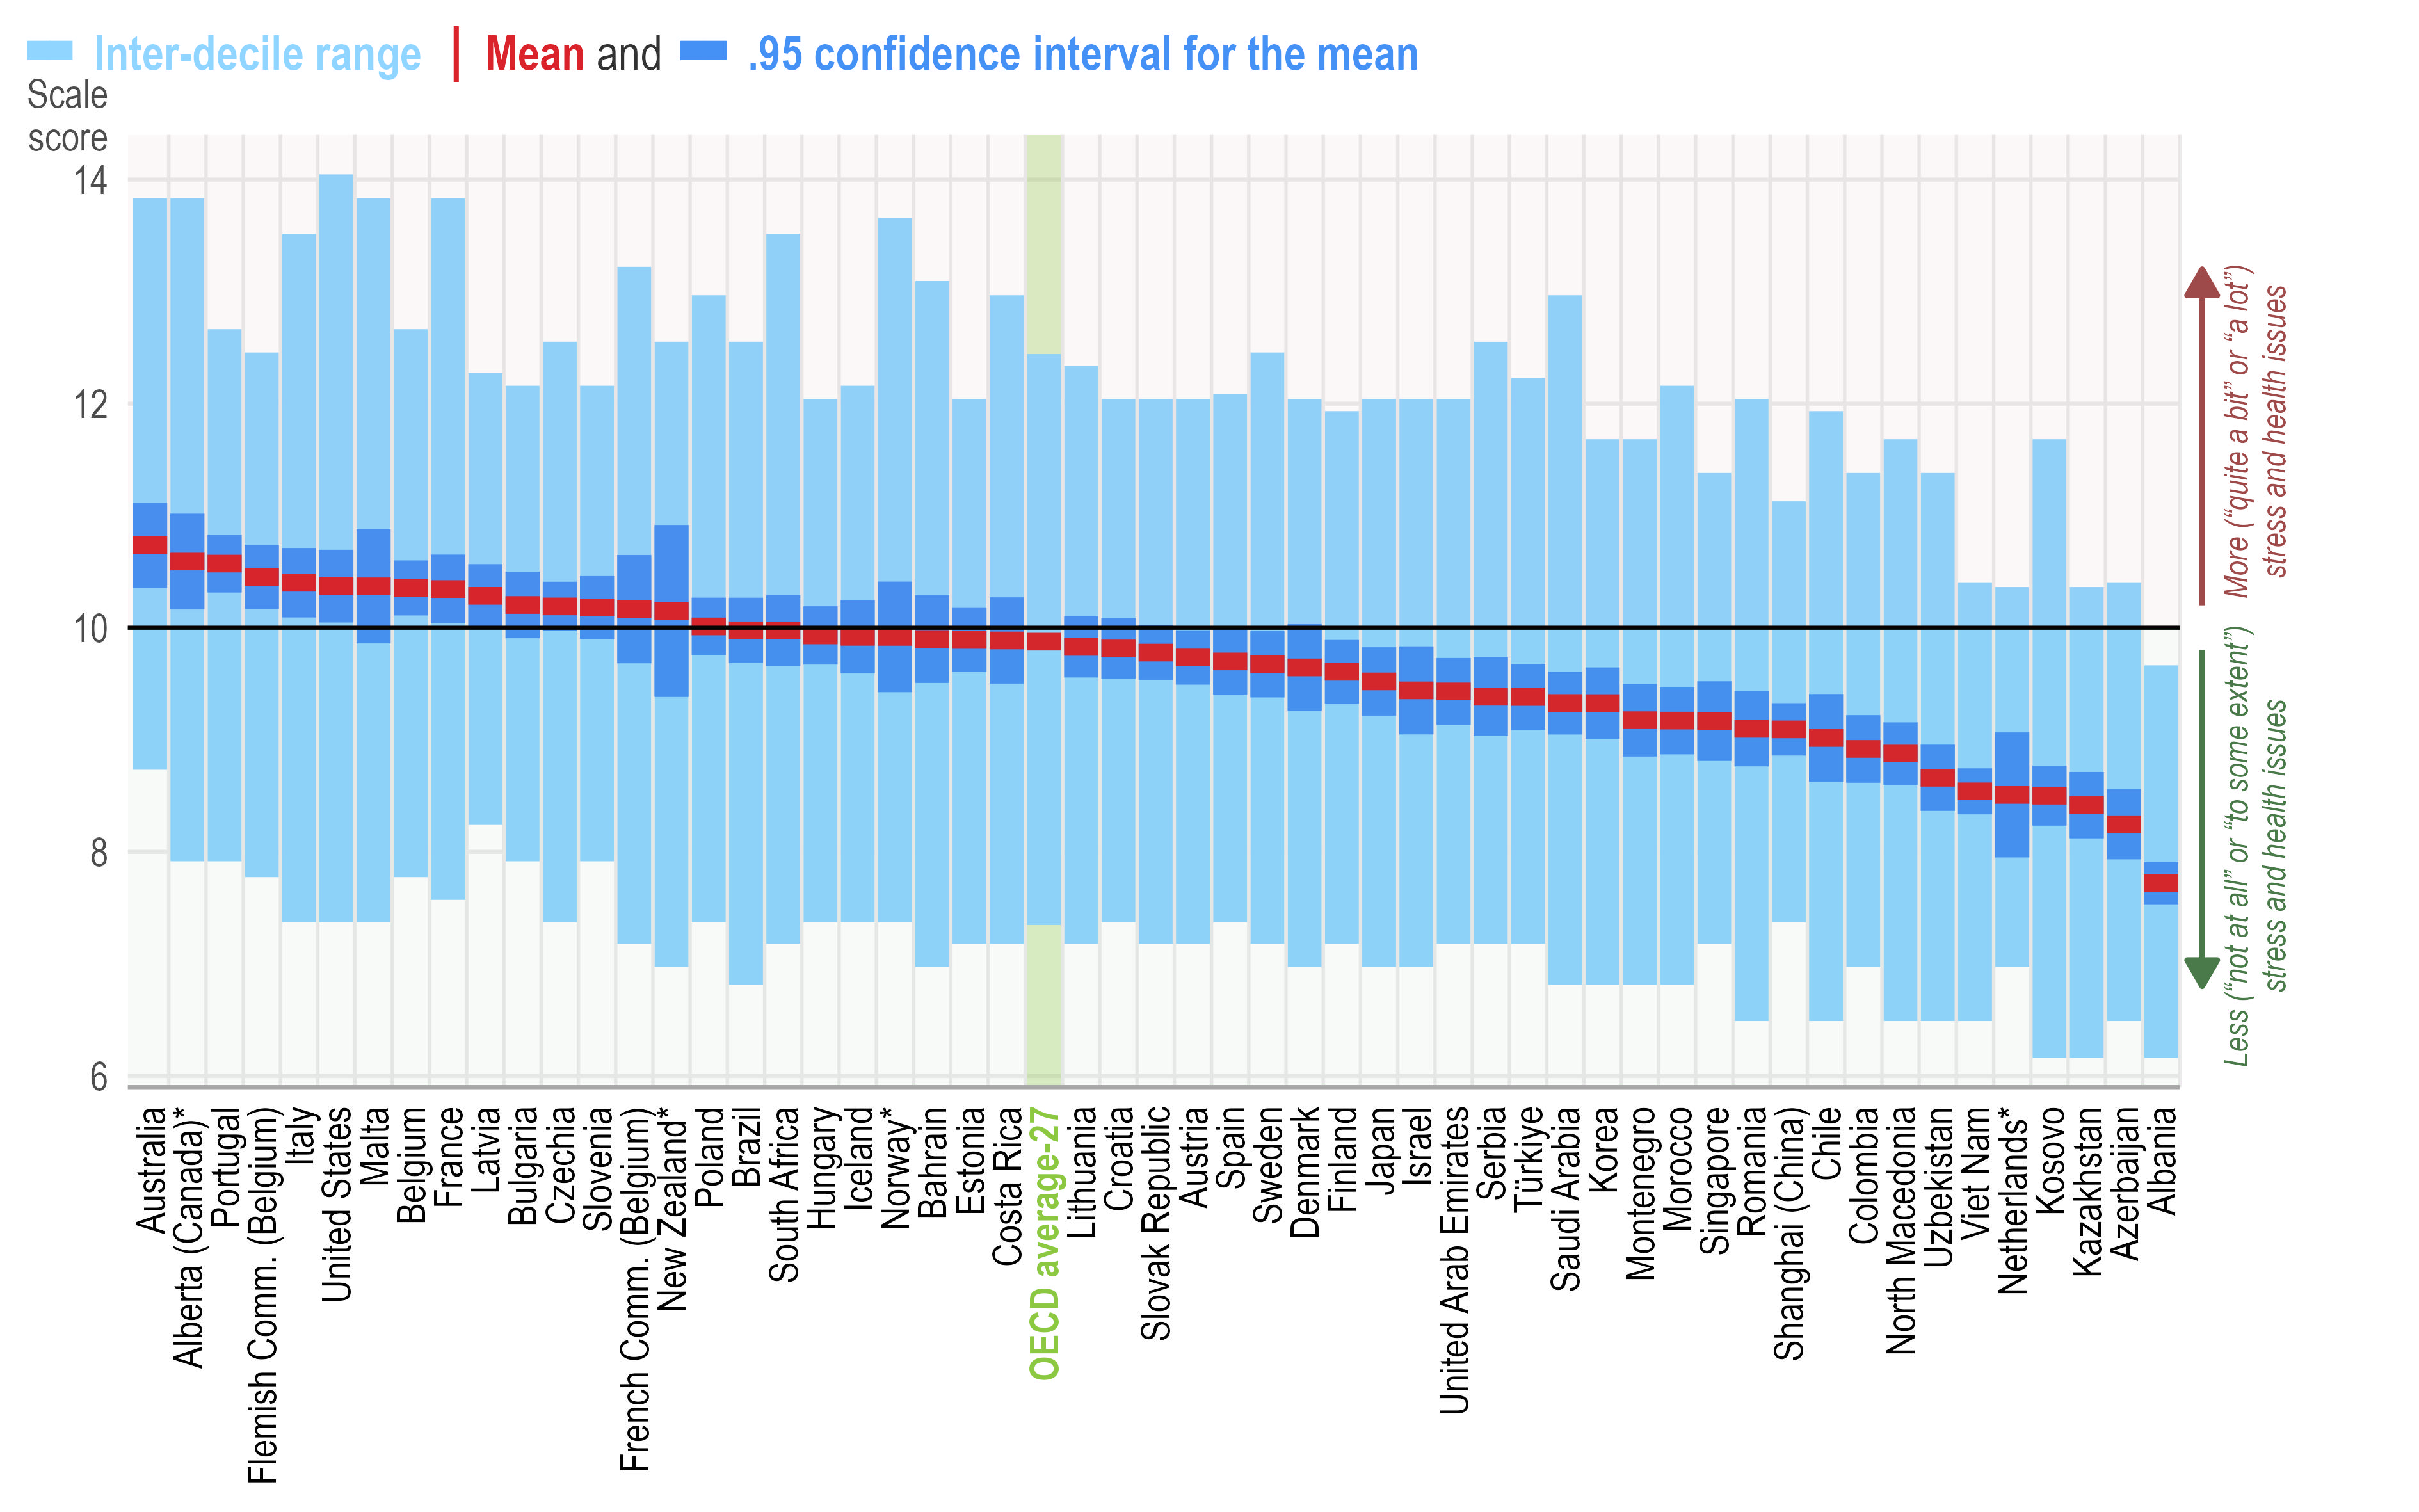
The country-level distributions of workplace stress and health issues highlight that disparities are widest (over 6 index points, equivalent to more than three standard deviations, between the top and bottom deciles) in the United States, Malta, South Africa, Norway*, France, Saudi Arabia, Italy and Bahrain (Figure 2.10).
Within-country imbalances in principals’ well-being are driven by differences in individual factors and school contexts. For example, studies highlight that women employees tend to be more stressed than their colleagues who are men (Gallup, 2026[25]; Gao, Ping and Liu, 2020[26]; Matud, 2004[27]), which is also the case for female and male teachers (OECD, 2025[28]). TALIS data from school leaders support these conclusions. Younger (under age 40) and less experienced (5 years or less) principals, those who are women, as well as those in urban schools and schools with more students with language difficulties (over 10%), report higher work-related stress, on average (Tables 2.28 and 2.30).
Scale of lower secondary principals’ workplace stress and health issues
Note: *Estimates should be interpreted with caution due to a higher risk of non-response bias.
Education systems are sorted in descending order by the mean scale score.
Standardised scale scores with a standard deviation of 2 and the value of 10 corresponding to the item mid-point value of the response scale. Higher values on the workplace stress and health issues scale reflect lower levels of well-being. Scale scores above 10 indicate more stress and health issues (corresponding to responses of "quite a bit" or "a lot"), scores below 10 indicate less stress and health issues (corresponding to "not at all" or "to some extent"), while scores of exactly 10 represent the mid-point of the scale between “to some extent” and “quite a bit”. For more information on the scales, see Annex B.
The inter-decile range measures the gap between the top 10% and bottom 10% of schools, showing how widely principals’ well-being vary within education systems.
A 95% confidence interval shows the range within which the true value is likely to lie, taking into account the uncertainty associated with survey estimates. It shows how precise an estimate is: narrower intervals indicate greater precision, while wider intervals indicate greater uncertainty.
Source: OECD, TALIS 2024 Database, Table 2.29.
Sources of stress
TALIS measures principals’ sources of stress by asking to what extent (“not at all”; “to some extent”; “quite a bit”; “a lot”) they encounter the following stressors in their work: having too much teacher appraisal and feedback work; having too much administrative work; having extra duties due to absent school staff; being held responsible for students’ achievement; maintaining school discipline; being intimidated or verbally abused by students; keeping up with changing requirements from authorities; addressing parent or guardian concerns; accommodating students with special education needs; being held responsible for students’ social and emotional well-being; and having to adapt the school’s practices due to unexpected disruptions.
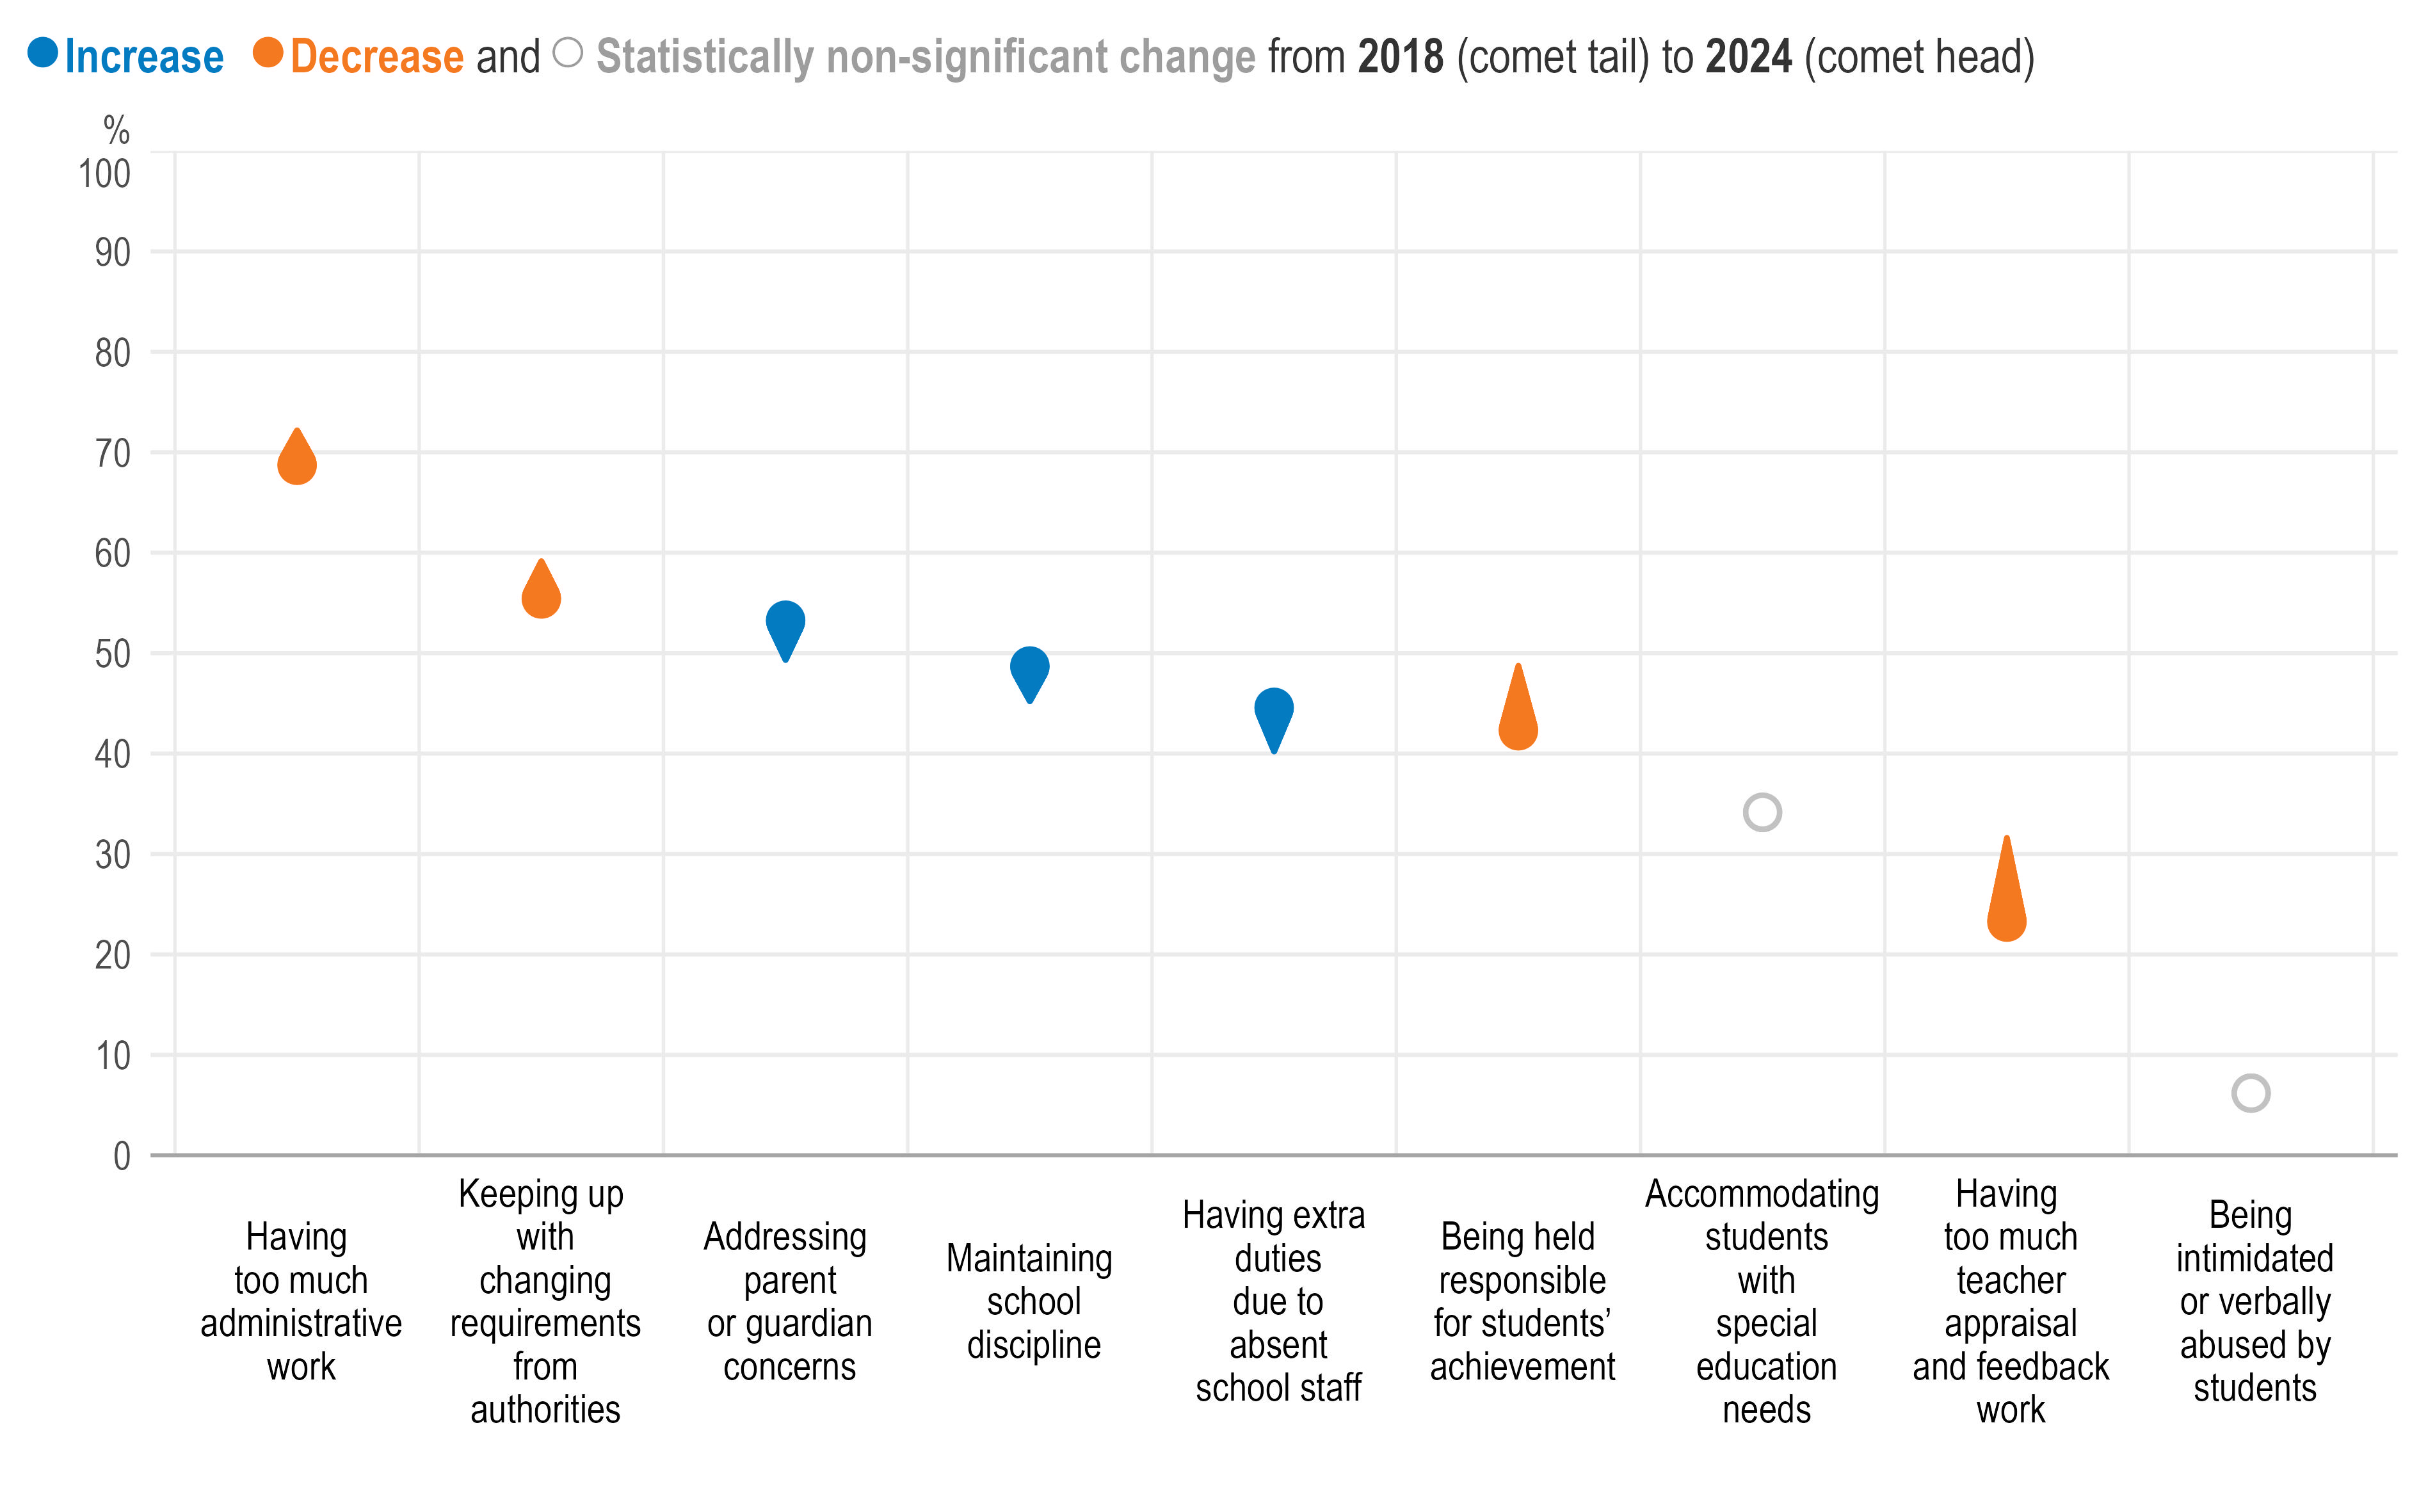
On average, principals most frequently report stress from excessive administrative work (68% of principals report it as a source of stress “quite a bit” or “a lot”), followed by changing requirements from authorities (56%) and addressing parents’ concerns (53%) (Table 2.34). Excessive administrative work is negatively associated with perceived instructional leadership (Table 2.31), suggesting that greater administrative demands may leave principals with less time to focus on teaching and learning. Stress from covering for staff absences and maintaining school discipline are also negatively associated with perceived instructional and relational leadership (Tables 2.31 and 2.32). Conversely, schools with weaker leadership are often more prone to staff absenteeism and disciplinary challenges, creating a vicious circle.
Extra duties due to staff absences, maintaining school discipline and addressing parent concerns are the only stressors principals reported more often in 2024 than 2018 (Figure 2.11). The share of principals reporting these three sources of stress increased, on average, by 4 percentage points, reaching 45%, 49% and 53%, respectively.
Percentage of lower secondary principals who report that the following are sources of stress "quite a bit" or "a lot" (OECD average-24)
Note: Education systems are sorted in descending order by the percentage of lower secondary principals in 2024 who report that the following are sources of stress "quite a bit" or "a lot".
Source: OECD, TALIS 2018 and TALIS 2024 Databases, Table 2.33.
On average, female principals are more likely to report various sources of stress, including covering for absent staff, maintaining school discipline and excessive administrative work, than their male peers (Table 2.34). Similarly, younger principals under age 40 are more likely than those aged 60 or above to report a range of work-related stressors, on average (Table 2.35).
Principals’ sources of stress also vary depending on the kinds of schools they are in:
Principals in publicly managed schools and those with a larger share of socio-economically disadvantaged students (over 30%) report excessive administrative burden as a stressor more often (Table 2.36);
Principals in rural schools, publicly managed schools, smaller schools and schools with a larger share of socio-economically disadvantaged students are more likely to report being stressed by absent school staff (Table 2.37); and
Principals in publicly managed schools, schools with a larger share of socio-economically disadvantaged students and those with more students with language difficulties (over 10%) report school discipline as a stressor more often (Table 2.38).
Differences in stress related to staff absences, disciplinary issues and administrative burden may partly reflect how principals are distributed across school types. As noted earlier, female and younger principals, who report these stressors more often than their male and older colleagues, are overrepresented in smaller schools. Results also point to principals facing cumulative stress burden in schools combining socio‑economic disadvantage and language difficulties.
Individual factors
Teachers in upper secondary schools rate experienced principals more highly as instructional leaders (Table 2.5). Upper secondary principals are, on average, one year older than their lower secondary counterparts (Table 2.1). In Portugal and Slovenia, the average age of principals in upper secondary education increased by three years between 2018 and 2024 (Table 2.2). Upper secondary principals tend to be older in urban and larger schools (750 students or more), as well as in schools with a smaller share of special education needs students (10% or less) (Table 2.1).
On average, the share of female principals in upper secondary education is similar to that in lower secondary education (Table 2.9). Between 2018 and 2024, this share increased by 12 percentage points in Portugal and 8 percentage points in Türkiye (Table 2.8). In upper secondary education, women principals are more likely than men to work in smaller schools (fewer than 250 students) (Table 2.9).
School contexts
Upper secondary principals in larger schools are less valued as instructional leaders than their colleagues in smaller schools (Table 2.13).
Job satisfaction and well-being
On average, 96% of upper secondary principals "agree" or "strongly agree" that, overall, they are satisfied with their jobs (Table 2.22). Of these, experienced principals (with 10 or more years of experience) are more likely to be happy with their jobs than principals with five years of experience or less.
The share of principals in upper secondary education who report experiencing stress "quite a bit" or "a lot" in their work is, on average, 10 percentage points lower compared to principals in lower secondary education (Table 2.28). Among the 11 sources of stress surveyed, a smaller share of upper secondary principals report experiencing stress "quite a bit" or "a lot" in six areas compared to lower secondary principals (Table 2.34). And upper secondary principals who report being held responsible for students' achievement as a source of stress "quite a bit" or "a lot" tend to be more highly valued instructional leaders (Table 2.31). Within upper secondary education, principals in privately managed schools are less likely than those in publicly managed schools to report excessive administrative work and extra duties due to staff absences, on average (Tables 2.36 and 2.37).
Note: *Estimates should be interpreted with caution due to a higher risk of non-response bias.
References
[6] Azmat, G. and A. Boring (2020), “Gender diversity in firms”, Oxford Review of Economic Policy, Vol. 36/4, pp. 760-782, https://doi.org/10.1093/OXREP/GRAA043.
[19] Bakker, A. and E. Demerouti (2007), “The Job Demands‐Resources model: State of the art”, Journal of Managerial Psychology, Vol. 22/3, pp. 309-328, https://doi.org/10.1108/02683940710733115.
[16] Clarke, S. and T. O’Donoghue (2017), “Educational Leadership and Context: A Rendering of an Inseparable Relationship”, British Journal of Educational Studies, Vol. 65/2, pp. 167-182, https://doi.org/10.1080/00071005.2016.1199772.
[13] Eagly, A., M. Johannesen-Schmidt and M. Van Engen (2003), “Transformational, Transactional, and Laissez-Faire Leadership Styles: A Meta-Analysis Comparing Women and Men”, Psychological Bulletin, Vol. 129/4, pp. 569-591, https://doi.org/10.1037/0033-2909.129.4.569.
[11] Eagly, A. and S. Karau (2002), “Role congruity theory of prejudice toward female leaders”, Psychological Review, Vol. 109/3, pp. 573-598, https://doi.org/10.1037/0033-295X.109.3.573.
[7] Fine, C., V. Sojo and H. Lawford-Smith (2020), “Why Does Workplace Gender Diversity Matter? Justice, Organizational Benefits, and Policy”, Social Issues and Policy Review, Vol. 14/1, pp. 36-72, https://doi.org/10.1111/SIPR.12064.
[25] Gallup (2026), State of the Global Workplace: 2026 Report, https://www.gallup.com/workplace/349484/state-of-the-global-workplace.aspx.
[26] Gao, W., S. Ping and X. Liu (2020), “Gender differences in depression, anxiety, and stress among college students: A longitudinal study from China”, Journal of Affective Disorders, Vol. 263, pp. 292-300, https://doi.org/10.1016/J.JAD.2019.11.121.
[1] Grissom, J., A. Egalite and C. Lindsay (2021), “How Principals Affect Students and Schools: A Systematic Synthesis of Two Decades of Research”, https://doi.org/10.59656/EL-SB1065.001.
[17] Hallinger, P. (2018), “Bringing context out of the shadows of leadership”, Educational Management Administration and Leadership, Vol. 46/1, pp. 5-24, https://doi.org/10.1177/1741143216670652.
[30] Hallinger, P., L. Dongyu and W. Wang (2016), “Gender Differences in Instructional Leadership: A Meta-Analytic Review of Studies Using the Principal Instructional Management Rating Scale”, Educational Administration Quarterly, Vol. 52/4, pp. 567-601, https://doi.org/10.1177/0013161X16638430.
[8] Harris, A. et al. (2024), “Invisible leaders? Reviewing contemporary evidence about women leaders in education”, School Leadership & Management, Vol. 44/5, pp. 523-546, https://doi.org/10.1080/13632434.2024.2408220.
[12] Harris, A. et al. (2024), “Invisible leaders? Reviewing contemporary evidence about women leaders in education”, School Leadership & Management, Vol. 44/5, pp. 523-546, https://doi.org/10.1080/13632434.2024.2408220.
[20] Harter, J., F. Schmidt and T. Hayes (2002), “Business-unit-level relationship between employee satisfaction, employee engagement, and business outcomes: A meta-analysis”, Journal of Applied Psychology, Vol. 87/2, pp. 268-279, https://doi.org/10.1037/0021-9010.87.2.268.
[21] Judge, T. et al. (2001), “The job satisfaction–job performance relationship: A qualitative and quantitative review.”, Psychological Bulletin, Vol. 127/3, pp. 376-407, https://doi.org/10.1037/0033-2909.127.3.376.
[4] Lee, S. and X. Mao (2023), “Recruitment and selection of principals: A systematic review”, Educational Management Administration and Leadership, Vol. 51/1, pp. 6-29, https://doi.org/10.1177/1741143220969694.
[14] Lee, V., J. Smith and M. Cioci (1993), “Teachers and Principals: Gender-Related Perceptions of Leadership and Power in Secondary Schools”, Educational Evaluation and Policy Analysis, Vol. 15/2, pp. 153-180, https://doi.org/10.3102/01623737015002153.
[2] Leithwood, K., A. Harris and D. Hopkins (2020), “Seven strong claims about successful school leadership revisited”, School Leadership and Management, Vol. 40/1, pp. 5-22, https://doi.org/10.1080/13632434.2019.1596077.
[9] Martínez, M., M. Molina-López and R. de Cabo (2021), “Explaining the gender gap in school principalship: A tale of two sides”, Educational Management Administration & Leadership, Vol. 49/6, pp. 863-882, https://doi.org/10.1177/1741143220918258.
[27] Matud, M. (2004), “Gender differences in stress and coping styles”, Personality and Individual Differences, Vol. 37/7, pp. 1401-1415, https://doi.org/10.1016/J.PAID.2004.01.010.
[10] Murakami, E. and M. Törnsen (2017), “Female secondary school principals: Equity in the development of professional identities”, Educational Management Administration and Leadership, Vol. 45/5, pp. 806-824, https://doi.org/10.1177/1741143217717273.
[3] OECD (2025), Pensions at a Glance 2025: OECD and G20 Indicators, OECD Publishing, Paris, https://doi.org/10.1787/e40274c1-en.
[28] OECD (2025), Results from TALIS 2024: The State of Teaching, TALIS, OECD Publishing, Paris, https://doi.org/10.1787/90df6235-en.
[29] OECD (2025), Teaching and Learning International Survey (TALIS) 2024 Conceptual Framework, OECD Publishing, Paris, https://doi.org/10.1787/7b8f85d4-en.
[18] Sebastian, J. et al. (2019), “Principal Leadership and School Performance: An Examination of Instructional Leadership and Organizational Management”, Leadership and Policy in Schools, Vol. 18/4, pp. 591-613, https://doi.org/10.1080/15700763.2018.1513151.
[15] Shaked, H., J. Glanz and Z. Gross (2018), “Gender differences in instructional leadership: how male and female principals perform their instructional leadership role”, School Leadership & Management, Vol. 38/4, pp. 417-434, https://doi.org/10.1080/13632434.2018.1427569.
[24] Skaalvik, C. (2023), “Emotional exhaustion and job satisfaction among Norwegian school principals: relations with perceived job demands and job resources”, International Journal of Leadership in Education, pp. 1-25, https://doi.org/10.1080/13603124.2020.1791964.
[23] Wang, F., K. Pollock and C. Hauseman (2018), “School principals’ job satisfaction: The effects of work intensification”, Canadian journal of educational administration and policy No. 185 (2018), https://files.eric.ed.gov/fulltext/EJ1179195.pdf.
[22] Warr, P. (1999), “Well-Being and the Workplace”, in Kahneman, D., E. Diener and N. Schwarz (eds.), Well-Being, Russell Sage Foundation, http://www.jstor.org/stable/10.7758/9781610443258.24.
[5] Wieczorek, D. and C. Manard (2018), “Instructional Leadership Challenges and Practices of Novice Principals in Rural Schools”, Journal of Research in Rural Education, Vol. 34/2, https://journals.newprairiepress.org/jrre/article/id/20683/ (accessed on 3 June 2026).
← 1. This report defines valued leadership based on teachers’ views about their principals’ instructional and relational leadership. The conceptualisation of valued leadership is guided by the Teaching and Learning International Survey (TALIS) 2024 Conceptual Framework (OECD, 2025[29]), which identifies instructional and relational leadership as key domains of school leadership. To note, TALIS does not survey teachers about their views on other important aspects of principals’ leadership, such as managerial leadership. Moreover, the instructional and relational leadership scales, which are based on teachers’ perceptions, may partly reflect principals’ popularity rather than leadership quality. Principals who make difficult but necessary decisions may consequently be viewed less favourably, even when their leadership is highly effective.
← 2. Descriptive statistics for the control variables can be found in the online TALIS 2024 Statistical Compendium.
← 3. Coefficients for the OECD and TALIS averages may be statistically significant even when country-level coefficients are statistically significant in only a small number of participating education systems. As such, these average results may not reflect a consistent pattern across education systems.
← 4. The instructional leadership scale (T4INSTLE) summarises teachers’ responses to three four-point agreement items (“strongly disagree”; “disagree”; “agree”; “strongly agree”) about their school principal. The scale is constructed using latent variable modelling within a confirmatory factor analysis (CFA) framework and is based on the following items: “The principal encourages co-operation among teachers to develop new teaching practices”; “The principal ensures that teachers take responsibility for improving their teaching skills”; “The principal ensures that teachers feel responsible for their students’ learning outcomes”. Standardised scale scores with a standard deviation of 2 and the value of 10 corresponding to the item mid-point value of the response scale.
← 5. The relational leadership scale (T4RELEAD) summarises teachers’ responses to four four-point agreement items (“strongly disagree”; “disagree”; “agree”; “strongly agree”) about their school principal. The scale is constructed using latent variable modelling within a CFA framework and is based on the following items: “The principal has a clear vision for this school”; “The principal encourages all staff to have a say on important decisions”; “The principal has good professional relationships with staff”; “The principal has good professional relationships with parents or guardians”. Standardised scale scores with a standard deviation of 2 and the value of 10 corresponding to the item mid-point value of the response scale.
← 6. The scale of job satisfaction overall (principal) (T4PJOBSAT) was constructed as an average of the two subscales: job satisfaction with profession (T4PJSPROT) and job satisfaction with work environment (T4PJSENVT). Standardised scale scores with a standard deviation of 2 and a mean of 10.
← 7. The scale of principals’ workplace stress and health issues (T4PWELS) is constructed using latent variable modelling within a CFA framework. Higher values on the scale reflect lower levels of well-being. Standardised scale scores with a standard deviation of 2 and the value of 10 corresponding to the item mid-point value of the response scale.