This chapter explores how valued principals lead their schools. How do valued principals support teachers and teaching, and connect with students, parents and the community? What can be learned about school management undervalued principals? It also discusses how much practices associated with valued leadership vary across countries in terms of principal and school characteristics, and their changes over time.
The Value of School Principals in TALIS 2024

Abstract
Valued principals focus on curriculum and instructional tasks, such as classroom observation and teacher feedback; support teacher leadership; use school- and classroom-based results in formal teacher appraisal; follow appraisal with development/training plans; and actively involve stakeholders in decision making and school activities.
Female principals and those with over 20 years of teaching experience are more likely to spend time on curriculum- and teaching-related tasks on a weekly basis. This is also true of principals in urban schools and schools with a greater intake of students with special education needs (over 30%).
Female principals are, on average, more likely than male principals to engage in classroom observation, provide feedback and foster teacher collaboration. These practices have become more widespread since 2018.
The share of principals reporting that teachers lead their own professional growth is high, on average (88%), and even higher in privately managed schools and schools with fewer students with special education needs and disadvantaged backgrounds (10% or less). It is also more commonly reported by older and more experienced principals.
Between 2018 and 2024, on average, the use of school- and classroom-based results as part of teachers’ formal appraisal decreased from 70% to 61%.
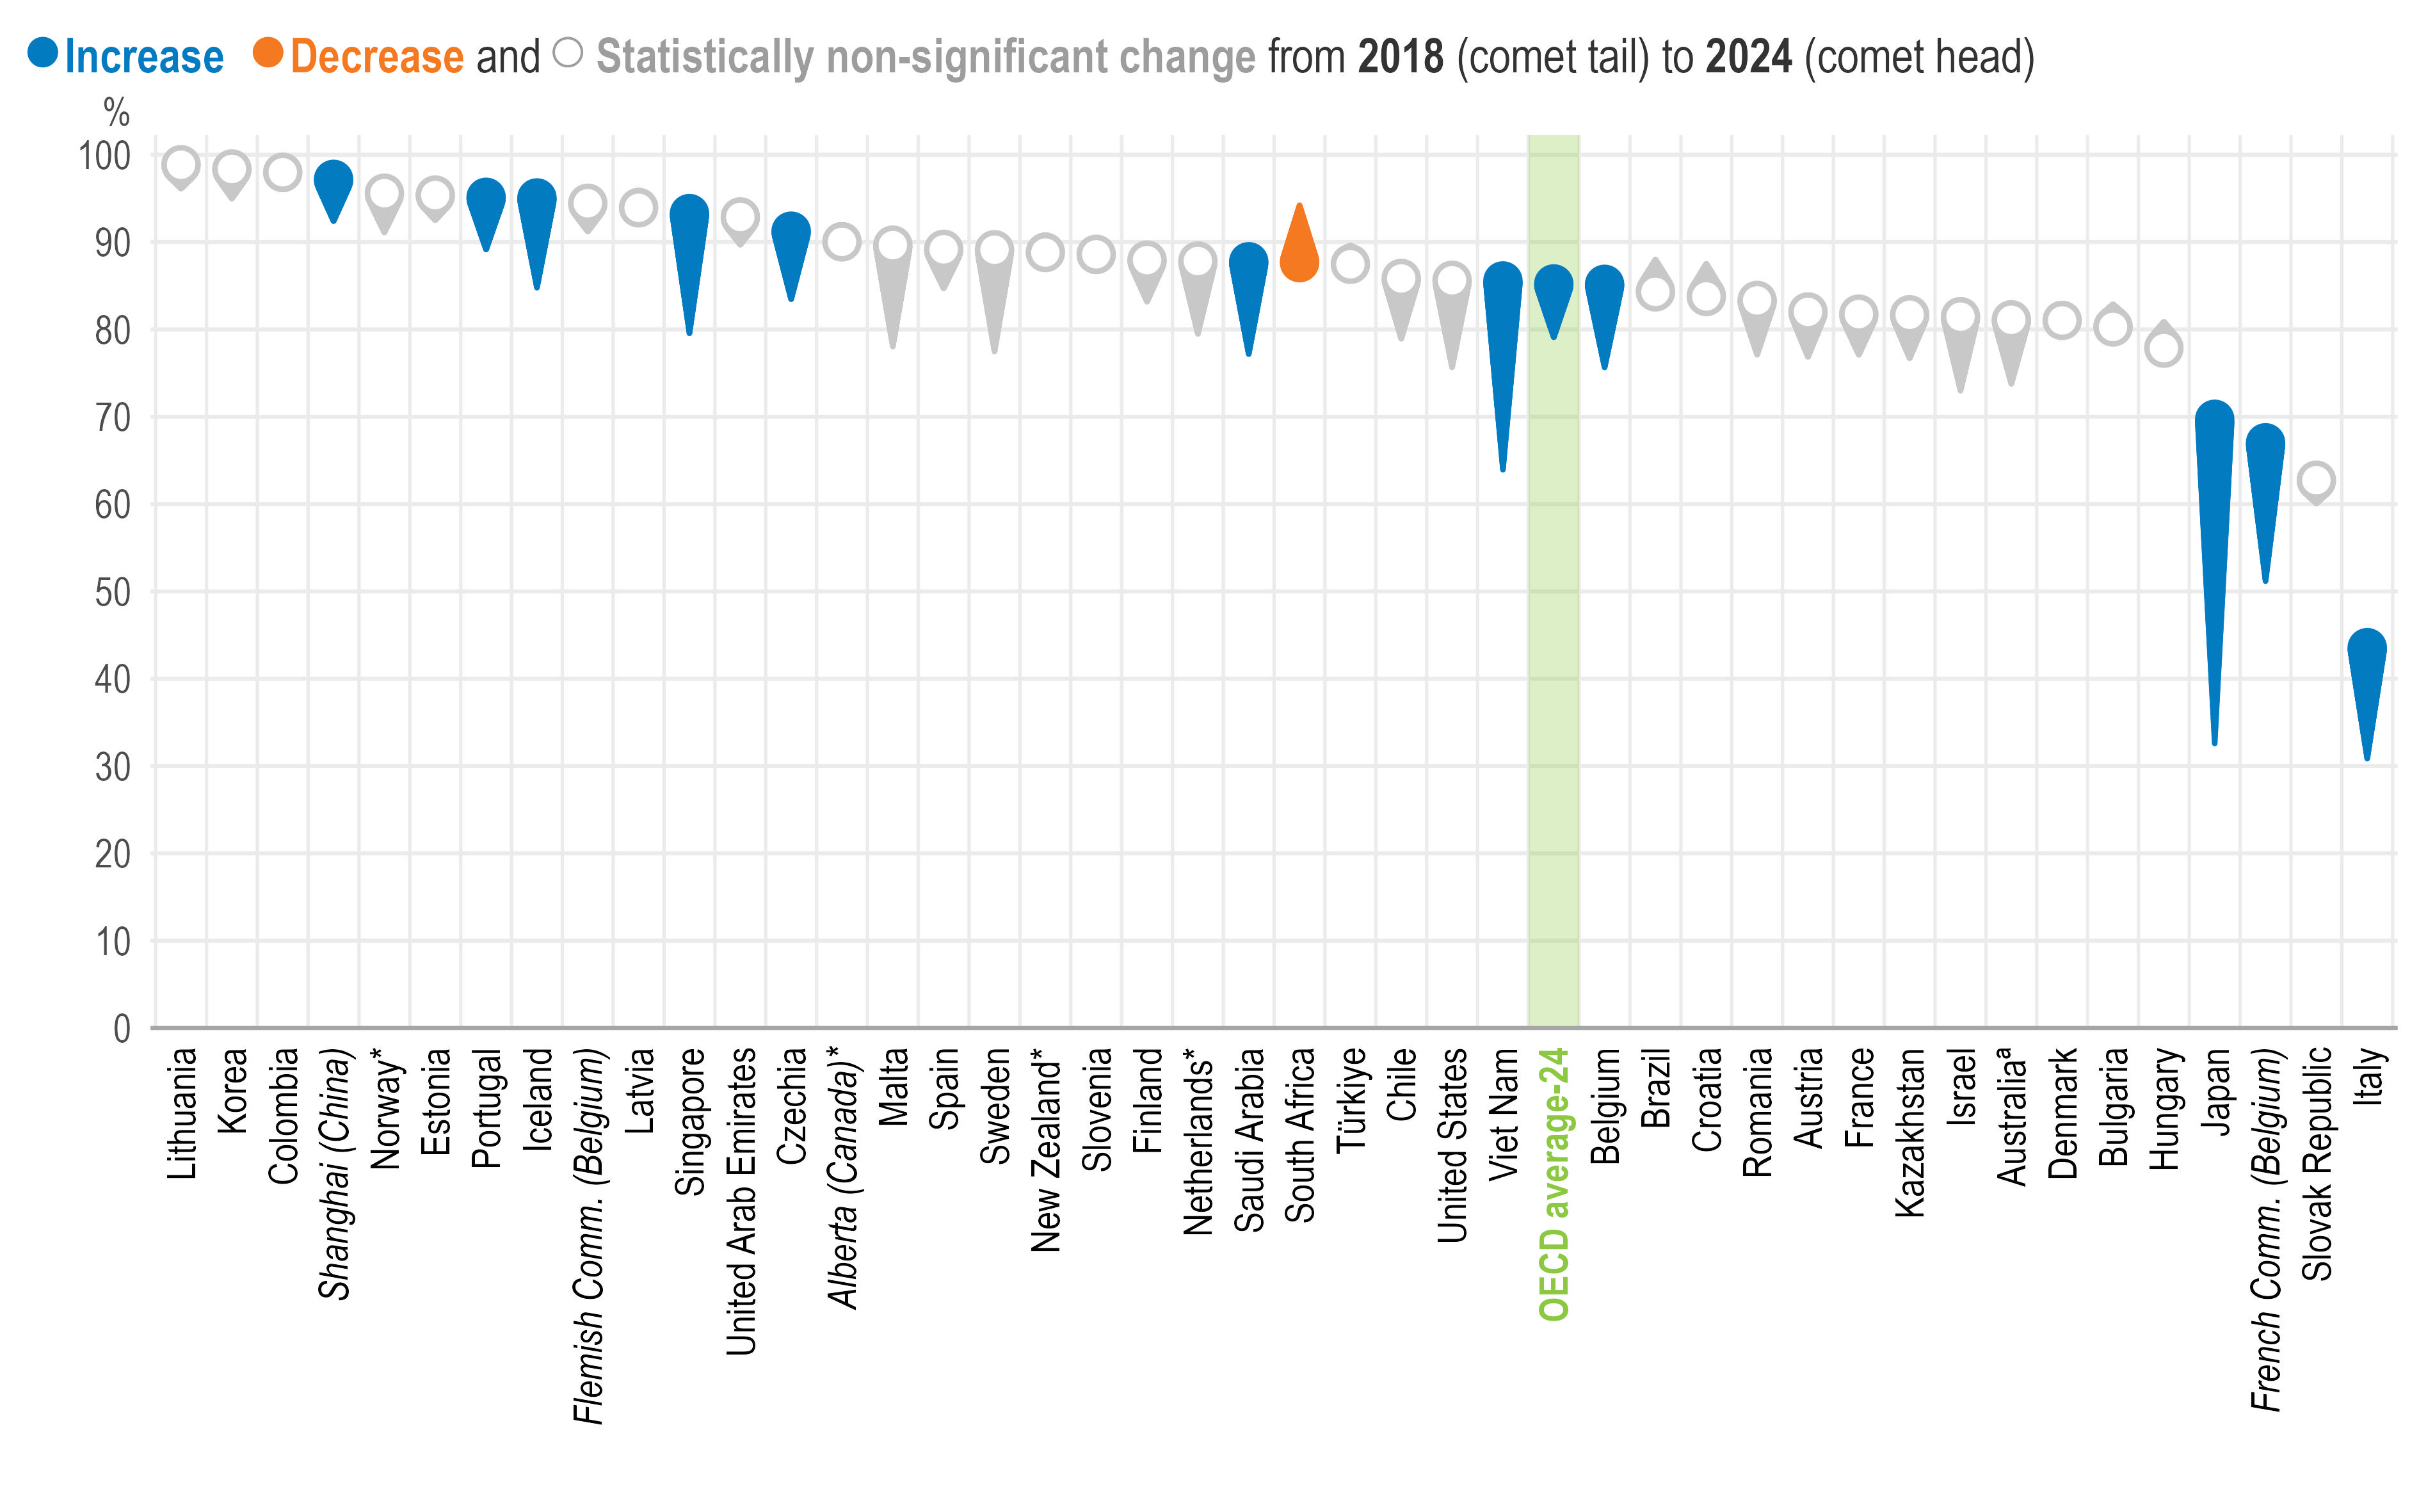
It is common for principals to provide opportunities for staff (98%, on average), parents (81%) and students (85%) to actively participate in school decisions. Between 2018 and 2024, the share of principals reporting that their school provides opportunities for students to participate in school decisions increased by 6 percentage points, on average.
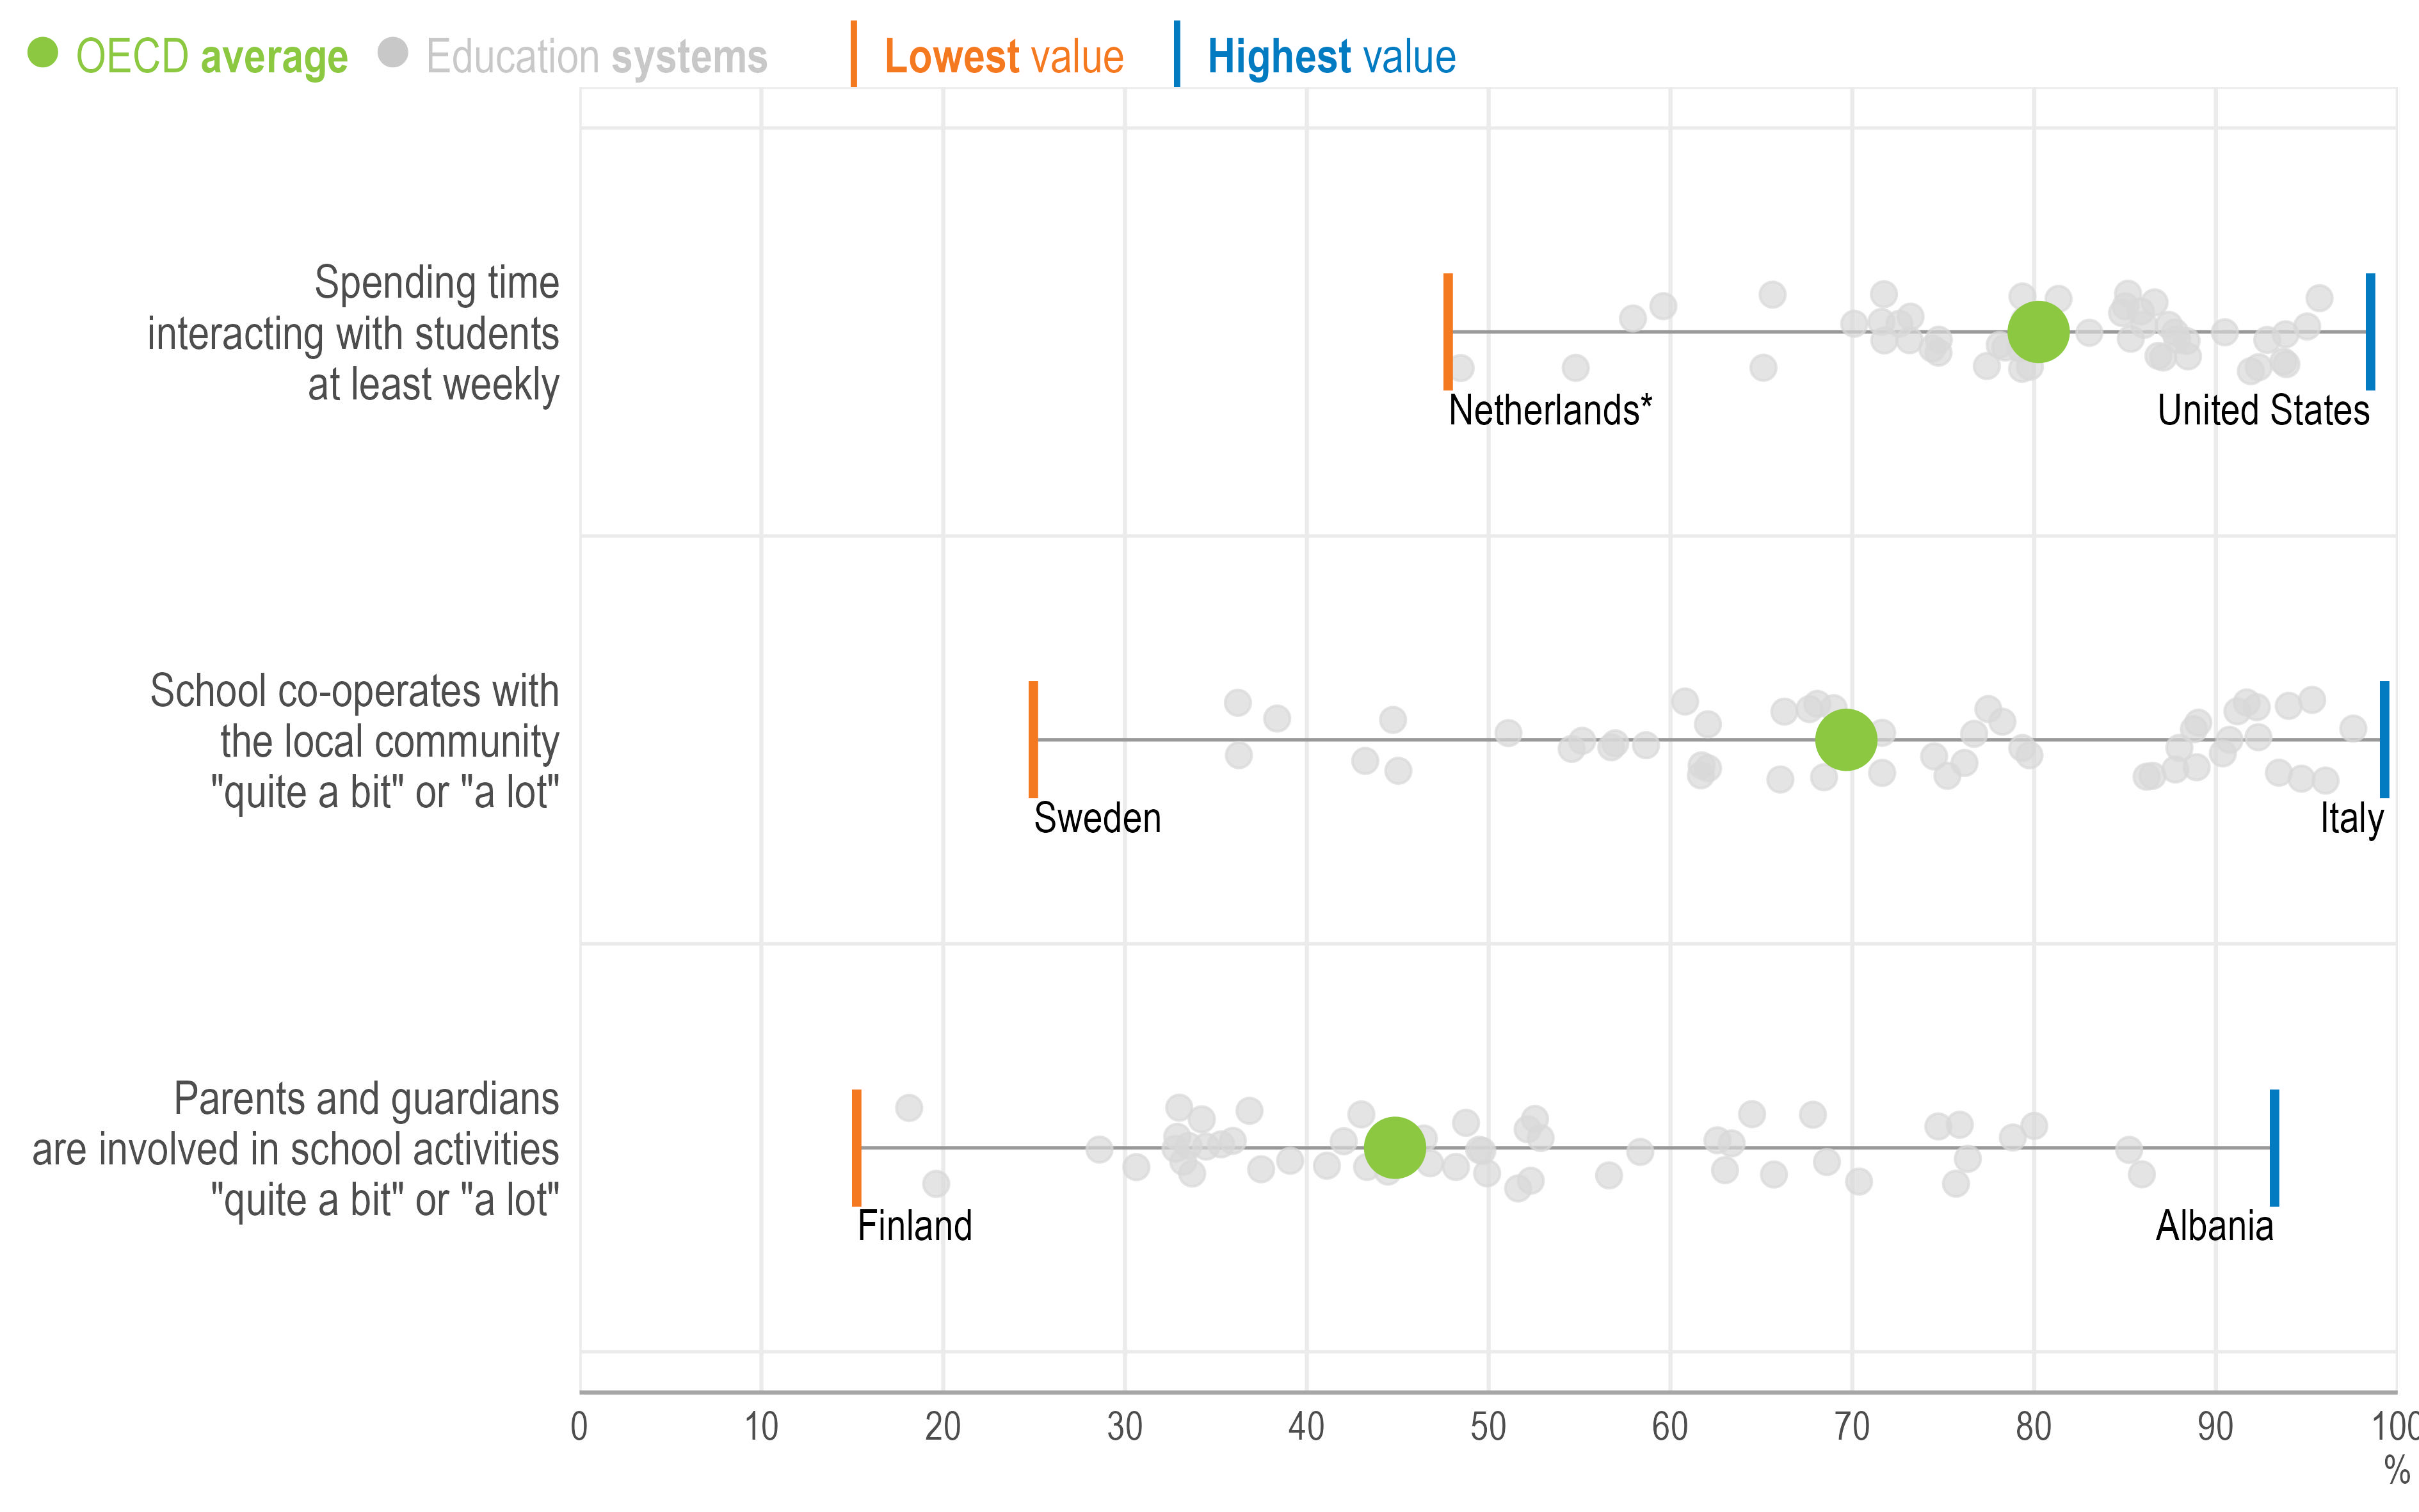
Most principals report making efforts to engage with students (80%, on average) and the local community (70%), while involving parents and guardians in school activities is less common (45%). Principals with more than 10 years of experience, principals in privately managed schools and those in schools with fewer disadvantaged students (10% or less), students with language difficulties (none), or students with special education needs (10% or less) report stronger engagement with parents and guardians.
Principals’ activities, interactions and decisions in schools shape and reflect their leadership approaches and priorities. This influences how teachers perceive them (Darling-Hammond et al., 2022[1]). Examining what valued principals1 do in schools can provide important insights into leadership practices that support a more positive school climate, better outcomes for students and better teacher retention (see Chapter 1).
At the same time, leadership practices are embedded in broader institutional, organisational and socio-economic contexts that enable, constrain or shape principals’ work. Examining where and in which types of schools these practices are more or less prevalent can help policymakers better understand the conditions under which effective forms of leadership are more likely to emerge and where extra support, resources or policy attention may be needed to strengthen or encourage their development.
This chapter first explores principals’ practices associated with valued instructional2 and relational3 leadership. These include curriculum and instructional tasks, support for teacher leadership, and use of school- and classroom-based results in teacher appraisal and professional development. Then it looks at tasks related to organisation, planning and collaborative decision making in schools. The last section examines principals’ efforts to co-operate with stakeholders outside the school. Each section discusses whether these practices vary across and within education systems, and whether they have changed since the previous Teaching and Learning International Survey (TALIS) cycle, which took place in 2018.
The relationships presented in this chapter are based on regression analyses, which examine how two variables are related, while taking other relevant factors into account that may influence the relationship. Depending on the level of analysis, the regression models control for teacher- or principal-level characteristics (i.e. gender and age), as well as school characteristics (i.e. school governance type, school size and school intake of students from socio-economically disadvantaged homes).4 The relationships identified and discussed meet the following conditions:
coefficients for OECD and TALIS averages are statistically significant;5
at least two-thirds of participating education systems with available data have coefficients with the same sign as OECD and TALIS averages, regardless of statistical significance.
To note, the design of TALIS does not allow for the establishment of causal relationships. All regression analyses presented in this report should therefore be interpreted as identifying the presence (or absence) of statistical associations, i.e. whether or not variation in one variable is systematically associated with variation in another. However, they do not permit conclusions about causality; in other words, they cannot determine whether variation in one variable causes a change in another, while holding all other factors constant.
Support for teachers and teaching
While administrative and managerial tasks take up a large share of principals’ time (Pont, Nusche and Moorman, 2008[2]), principals are also increasingly expected to support teachers and help improve teaching. Principals monitor teachers’ practices, organise induction and mentoring, plan professional development opportunities and strengthen a culture and community of learning in schools (Pont, Nusche and Moorman, 2008[2]). By shaping teachers’ professional development and working environment, principals contribute, directly and indirectly, to improving student outcomes and retaining teachers (Darling-Hammond et al., 2026[3]; Leithwood, Harris and Hopkins, 2008[4]; Pont, Nusche and Moorman, 2008[2]).
Curriculum and instruction
Research suggests that regular interactions with teachers on curriculum and teaching is a hallmark of effective leadership (Grissom, Egalite and Lindsay, 2021[5]). Principals can support teachers in this regard by observing their classes, providing feedback or organising collaborative activities.
TALIS 2024 results show that, on average:
Nearly half of principals (49%) spend time on curriculum- and teaching-related tasks and meetings at least weekly (Table 3.3);
About half of principals (49%) observed instruction in the classroom “often” or “very often” in the 12 months prior to the survey (Table 3.8);
Some 56% of principals gave feedback to teachers based on their observation “often” or “very often” in the 12 months prior to the survey (Table 3.8);
Some 60% of principals helped teachers co-operate to develop new teaching practices “often” or “very often” in the 12 months prior to the survey (Table 3.8).
Change in the school-level averages of lower secondary principals’ instructional and relational leadership scales1 associated with the following practices related to curriculum- and instruction2,3
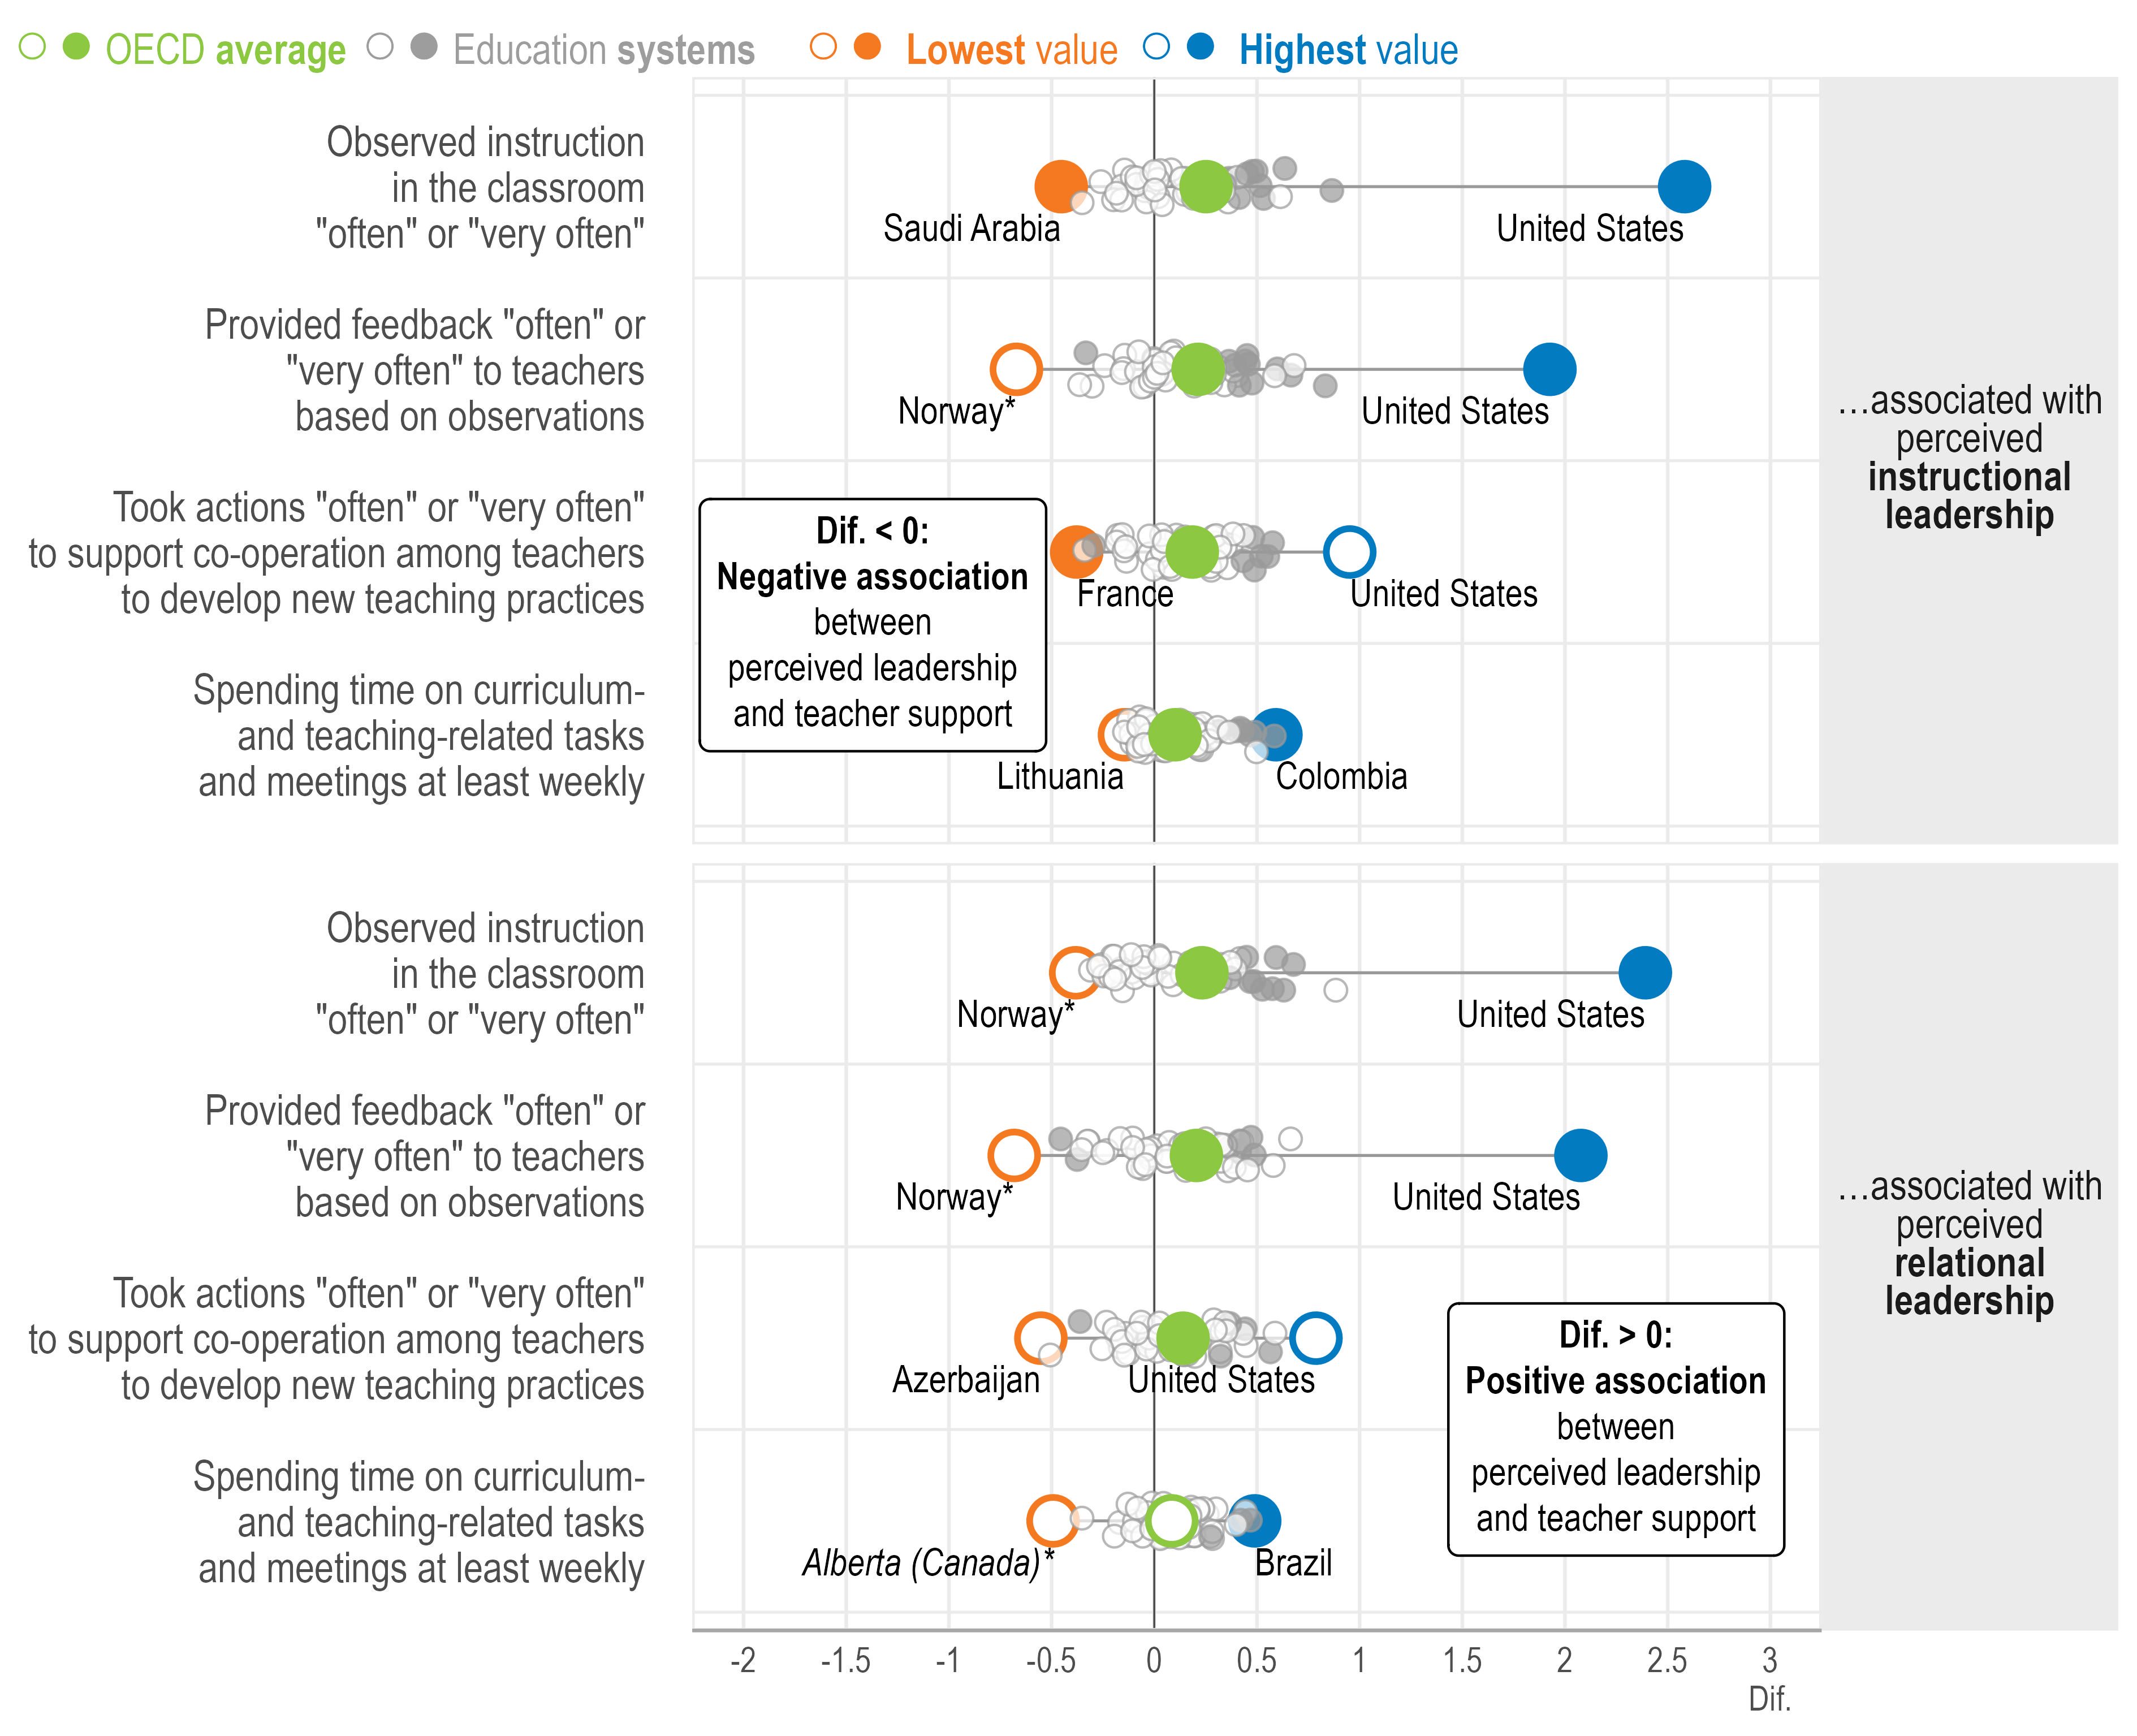
Note: *Estimates should be interpreted with caution due to a higher risk of non-response bias.
Statistically significant coefficients are highlighted with filled circles (see Annex B). Filled circles above 0 indicate a positive association, while those below 0 reflect a negative relationship.
1. Standardised scale scores with a standard deviation of 2 and the value of 10 corresponding to the item mid-point value of the response scale. For more information on the scales, see Annex B.
2. Binary variables: the reference categories refer to “never or rarely” and “sometimes”; and “monthly” or less frequently.
3. Results are based on school-level linear regression analyses controlling for principal characteristics (i.e. gender and age [standardised at the international level]) and school characteristics (i.e. school governance type, school size and school intake of students from socio-economically disadvantaged homes).
Source: OECD, TALIS 2024 Database, Tables 3.1, 3.2, 3.5 and 3.6.
Regression analyses indicate that principals who spend time on these instructional tasks are perceived more positively as instructional leaders, on average (Figure 3.1). Across education systems, the strongest relationships with instructional leadership are observed in:
Regularly observing classroom instruction: Colombia, the Netherlands* and the United States (Table 3.5).
Regularly providing feedback to teachers: Israel, the Netherlands* and the United States (Table 3.5).
Regularly supporting teacher co-operation: Colombia, Japan and South Africa (Table 3.5).
Spending time each week on curriculum- and teaching-related tasks and meetings: Brazil, Colombia and the French Community of Belgium (Table 3.1).
Regarding time spent on instructional practices, however, there are considerable differences across education systems participating in TALIS with available data (hereafter “education systems”). The share of principals who spend time on curriculum- and teaching-related tasks and meetings on a weekly basis ranges from 20% in France to 83% in New Zealand* and 86% in the United Arab Emirates (Table 3.3). And, while virtually all principals in Albania regularly observed instruction in the 12 months prior to the survey, only 8% of principals in Portugal and 10% in France did so (Table 3.8).
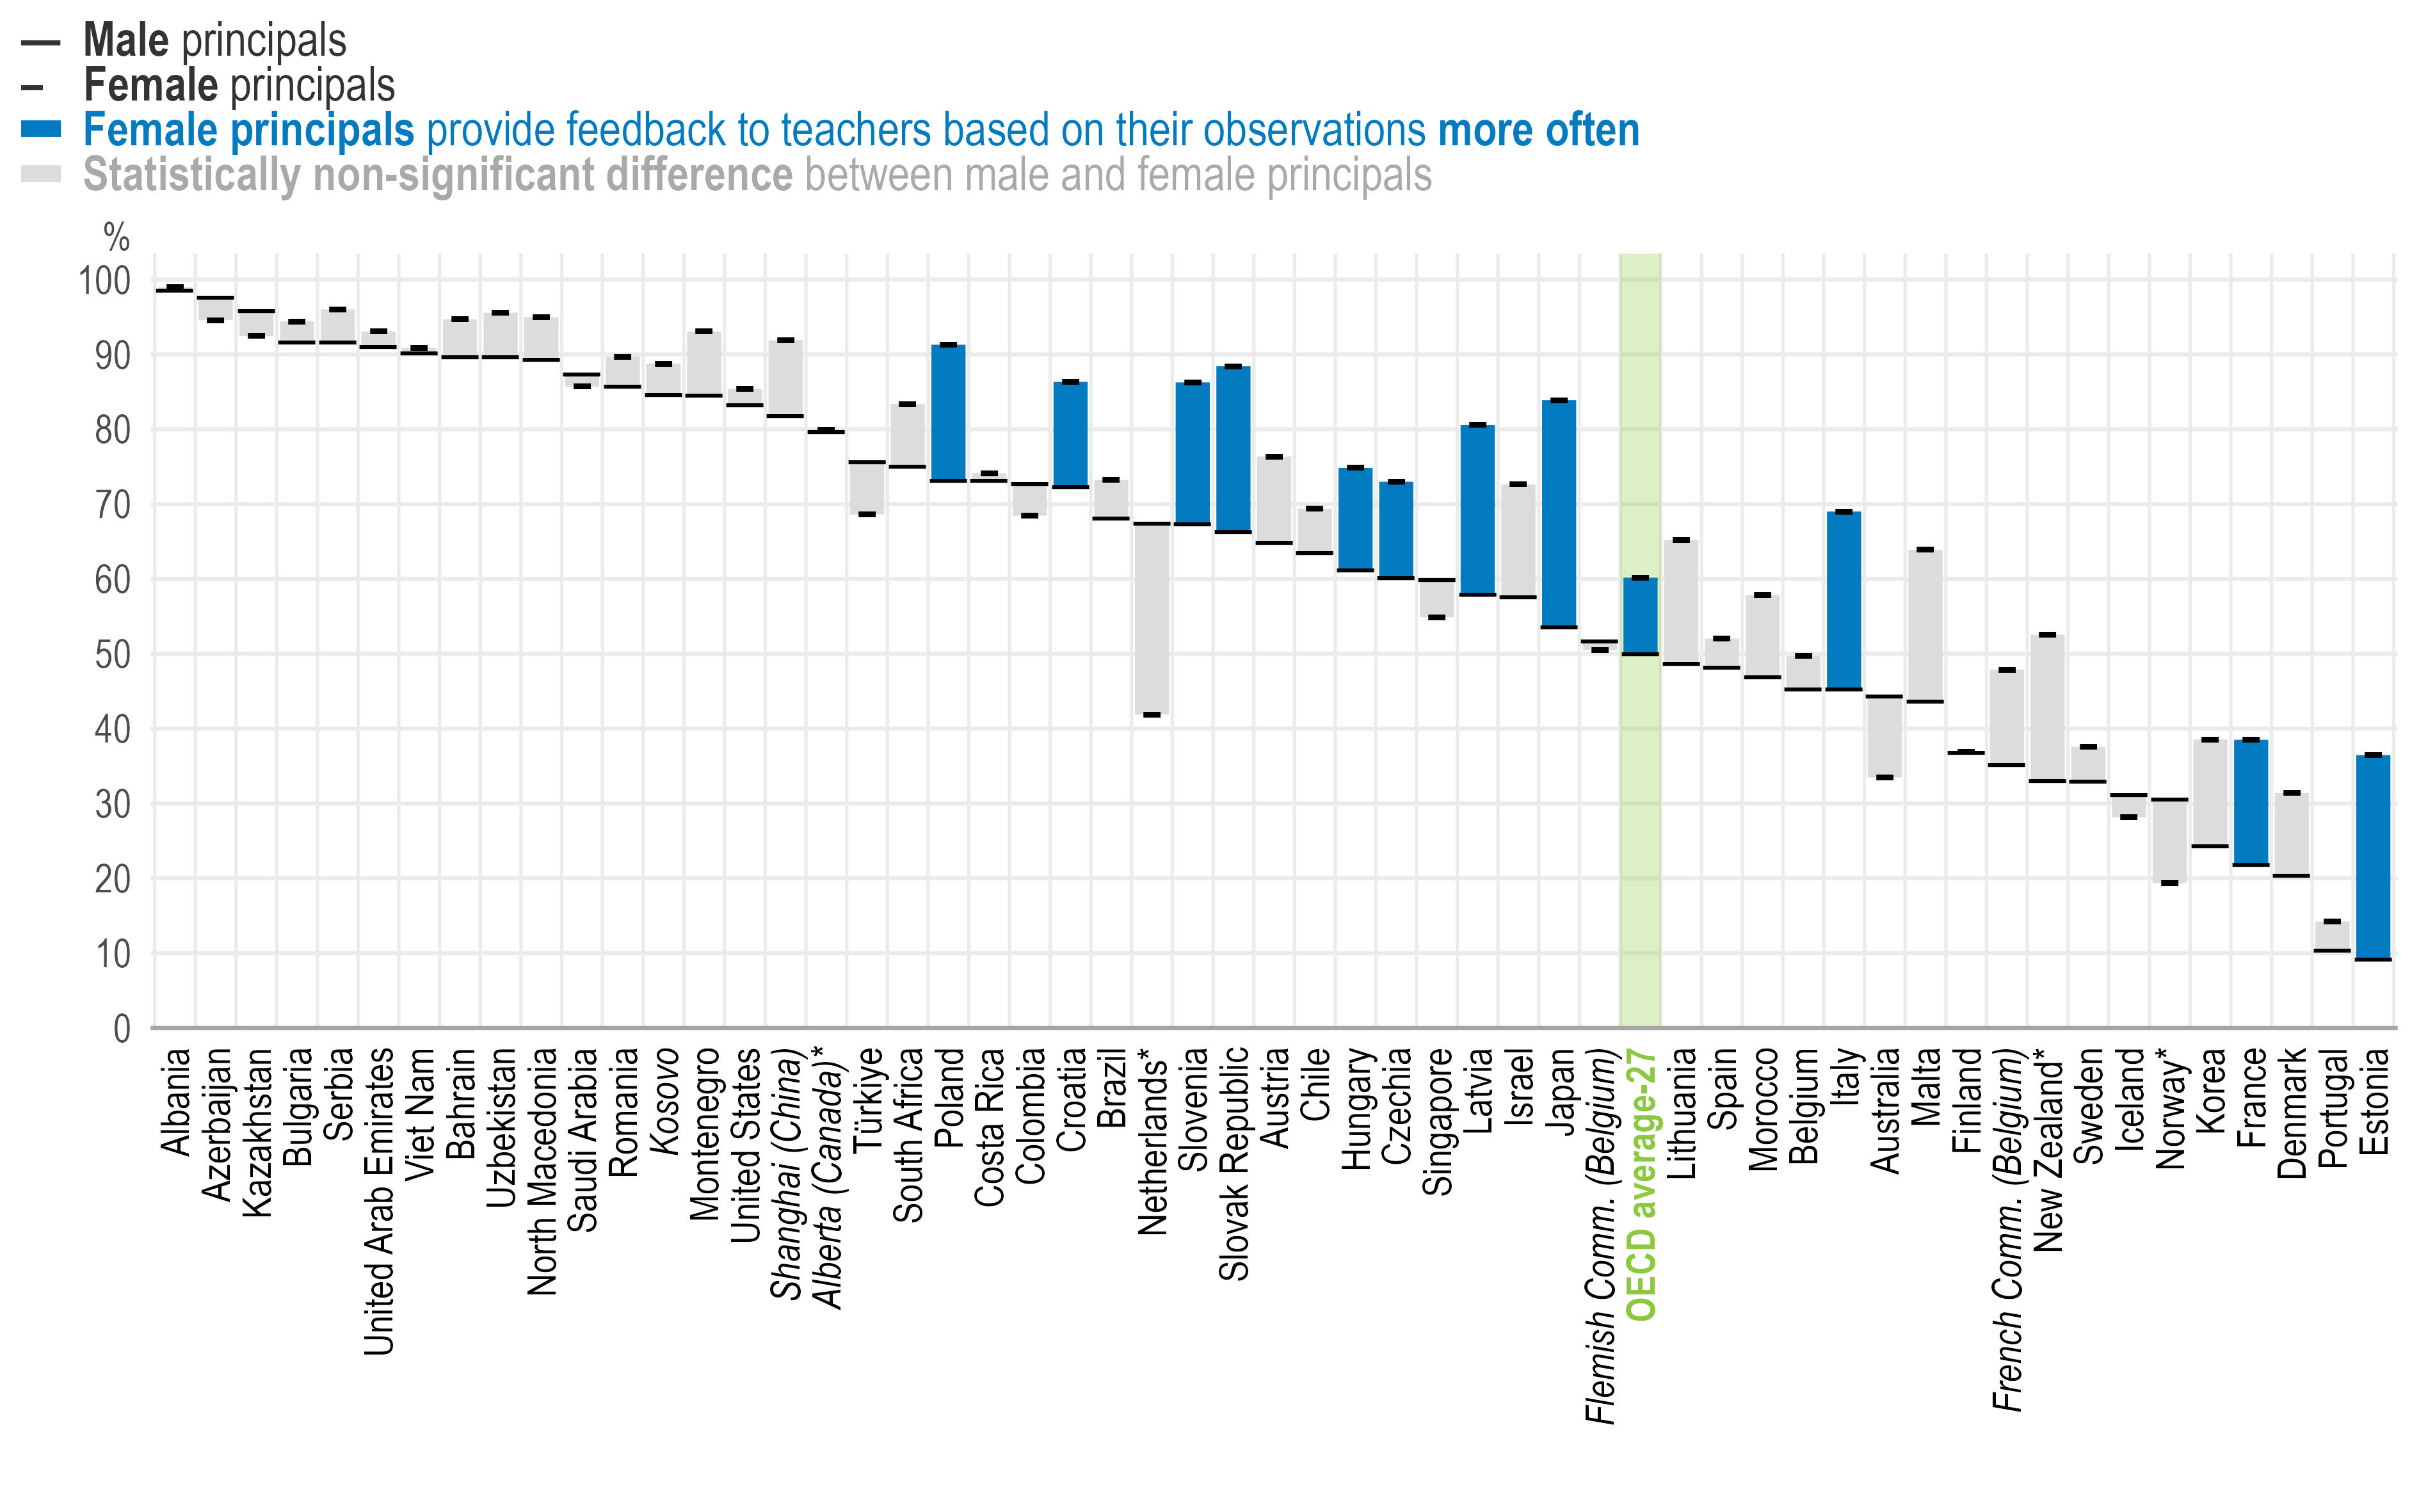
On average, female principals and principals with more than 20 years of teaching experience are more likely to spend time on curriculum- and teaching-related tasks on a weekly basis (Table 3.3). Female principals are also more likely than male principals to engage regularly in classroom observation, provide feedback to teachers and foster teacher collaboration (Table 3.8 and Figure 3.2). These results are aligned with meta-analysis showing that female principals engage in more active instructional leadership than their male colleagues (Hallinger, Dongyu and Wang, 2016[6]).
Percentage of lower secondary principals who report having provided feedback to teachers based on their observations “often” or “very often” during the 12 months prior to the survey
Note: *Estimates should be interpreted with caution due to a higher risk of non-response bias.
Education systems are sorted in descending order by the percentage of male lower secondary principals who report having provided feedback to teachers based on their observations “often” or “very often” during the 12 months prior to the survey.
Source: OECD, TALIS 2024 Database, Table 3.8.
Principals whose formal education or training included instructional leadership are, on average, more likely to use instructional leadership practices (Table 3.7). This finding corroborates studies from the United States showing that principals who had good training in instructional and organisational leadership are more likely to use these practices. This, in turn, is associated with greater teacher collaboration and school improvement (Orphanos and Orr, 2014[7]; Orr and Orphanos, 2011[8]).
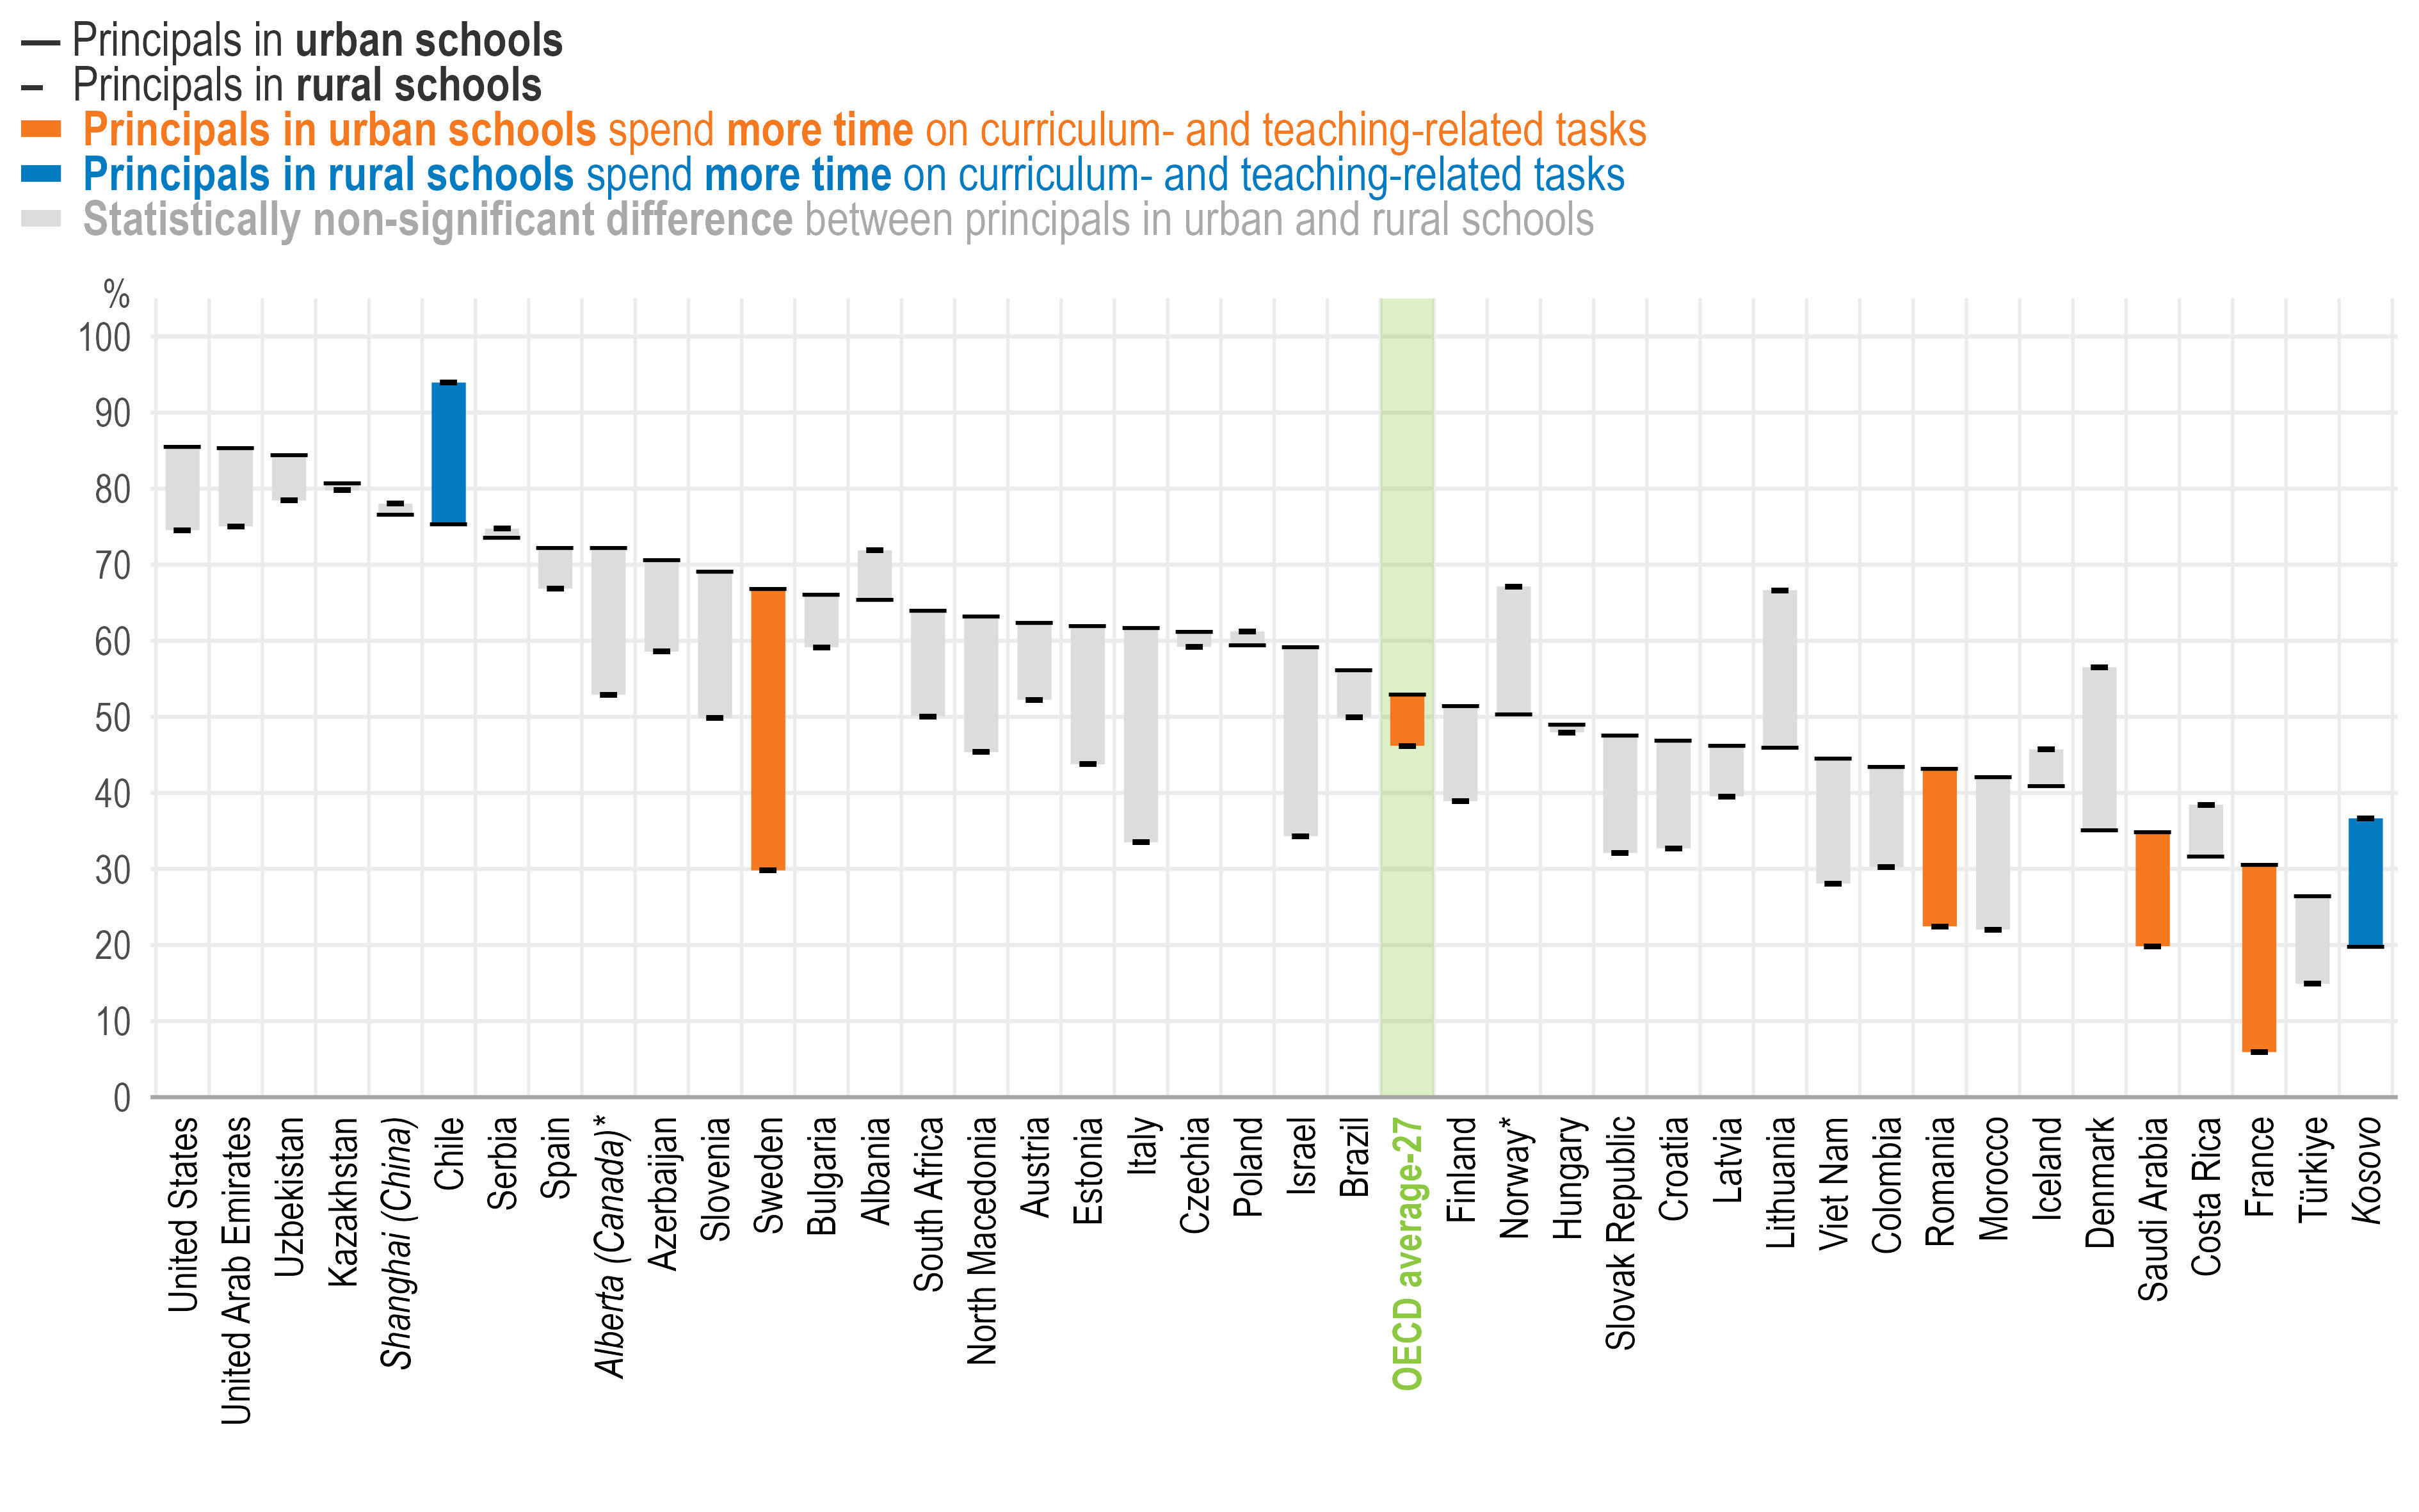
School context also matters for principals’ engagement with instructional tasks. Principals in urban schools (Figure 3.3), as well as those working in schools with over 30% of students with special education needs, are more likely to spend time on curriculum- and teaching-related tasks (Table 3.4). This pattern may partly reflect contextual challenges. In schools with larger shares of students with special education needs, principals probably need to devote more attention to instructional support because their students have more specific requirements.
Percentage of lower secondary principals who report spending time on curriculum- and teaching-related tasks and meetings at least weekly
Note: *Estimates should be interpreted with caution due to a higher risk of non-response bias.
Education systems are sorted in descending order by the percentage of lower secondary principals in urban schools who report spending time on curriculum- and teaching-related tasks and meetings at least weekly.
Rural schools refer to those located in rural areas or villages (up to 3 000 people). Urban schools refer to those located in a community with a population of over 100 000 people.
Source: OECD, TALIS 2024 Database, Table 3.4.
Some instructional practices became more widespread between 2018 and 2024 (Table 3.11):
Collaborating with teachers to solve classroom discipline problems increased by 13 percentage points, on average. The largest increases are observed in Finland (28 percentage points) and Japan (28 percentage points).
Classroom observation increased by 7 percentage points, on average. The largest increases are observed in Alberta (Canada)* (23 percentage points), Spain (22 percentage points) and Latvia (21 percentage points). See Box 3.1 for examples from Latvia and Spain of policies designed to strengthen classroom observation and feedback6.
Providing feedback to teachers based on classroom observations increased by 4 percentage points, on average.
These trends suggest that, despite growing emphasis on collaborative and indirect forms of instructional leadership in the literature (OECD, 2020[9]), principals’ direct involvement with teachers’ practice remains prevalent across schools. Moreover, the fact that both classroom observation and feedback are increasing at the same time in a few countries (i.e. Italy, Japan, Spain) can be a positive sign, as studies suggest that the discussions that follow classroom observation are the most valuable part of the process (Sartain, Stoelinga and Brown, 2011[10]).
Spanish Framework for Good School Principalship (MEBD, 2016–2018) is a professional framework developed by principal federations positioning instructional leadership – including direct engagement with teaching and learning – as the defining dimension of effective school leadership in Spain. This framework was later complemented by Spain's Organic Law on Education 3/2020 (LOMLOE), which reinforced the expectation that school principals must combine administrative management with pedagogical leadership, assigning them legal responsibility for leading the school's pedagogical activity. While classroom observation is not a requirement, the fact that these initiatives have emphasised principals’ instructional leadership may explain the observed increase in Spanish principals’ engaging in this practice.
Latvia's Guidelines for Ensuring the Quality of Education in General and Vocational Education entered into force in January 2022 and apply to ISCED levels 1–3. The guidelines specify indicators used to evaluate school principals. These indicators include classroom observation and feedback to teachers. Importantly, the guidelines also set out a minimum number of observed teaching hours that principals must undertake per semester or year. Taken together, these provisions formalise classroom observation as part of the professional responsibilities of school principals and provide concrete, quantified requirements that help keep principals accountable.
Sources:
Martínez Sánchez, J. A. and Bolívar Botía, A. (coords.) (2022), El Marco Español para la Buena Dirección Escolar [Spanish Framework for Good School Principalship], FEAE/FEDADi, November 2022. https://www.adimad.org/wp-content/uploads/2025/07/el-marco-espanol-para-la-buena-direccion-escolar.pdf
Spain (2020). Ley Orgánica 3/2020, de 29 de diciembre, por la que se modifica la Ley Orgánica 2/2006, de 3 de mayo, de Educación (LOMLOE). Boletín Oficial del Estado, núm. 340. https://www.boe.es/buscar/doc.php?id=BOE-A-2020-17264
European Commission/EACEA/Eurydice (2026). Management staff for early childhood and school education: Spain. Eurypedia. Last updated 4 February 2026. https://eurydice.eacea.ec.europa.eu/eurypedia/spain/management-staff-early-childhood-and-school-education
State Education Quality Service (IKVD) (2022), Vadlīnijas izglītības kvalitātes nodrošināšanai vispārējā un profesionālajā izglītībā [Guidelines for Ensuring the Quality of Education in General and Vocational Education], https://www.ikvd.gov.lv/lv/jaunums/publicetas-vadlinijas-izglitibas-kvalitates-nodrosinasanai-vispareja-un-profesionalaja-izglitiba
Teacher leadership
Teacher leadership refers to the capacity of teachers to influence their own development and their schools’ culture (OECD, 2025[11]). Research evidence suggests that teacher leadership is critical on a few fronts. Li and Liu (2022[12]) found, for example, that teacher leadership is associated with teachers’ self-efficacy and student learning. There is also evidence linking teacher leadership with higher levels of job satisfaction and lower turnover among teachers (OECD, 2025[11]; Schott, van Roekel and Tummers, 2020[13]), greater parental involvement (Vranješević and Frost, 2016[14]) and stronger students’ educational motivation (Öqvist and Malmström, 2018[15]). Principals play a critical role in creating a school environment that fosters teacher leadership.
TALIS 2024 measures teacher leadership by asking teachers and principals how much they agree (i.e. “strongly disagree”; “disagree”; “agree”; “strongly agree”) with the following statements about their schools: teachers take leadership roles in promoting a professional learning community; teachers initiate and lead collaborative activities; teachers lead their professional growth and development activities whenever possible; teachers participate in non-teaching school events and projects.
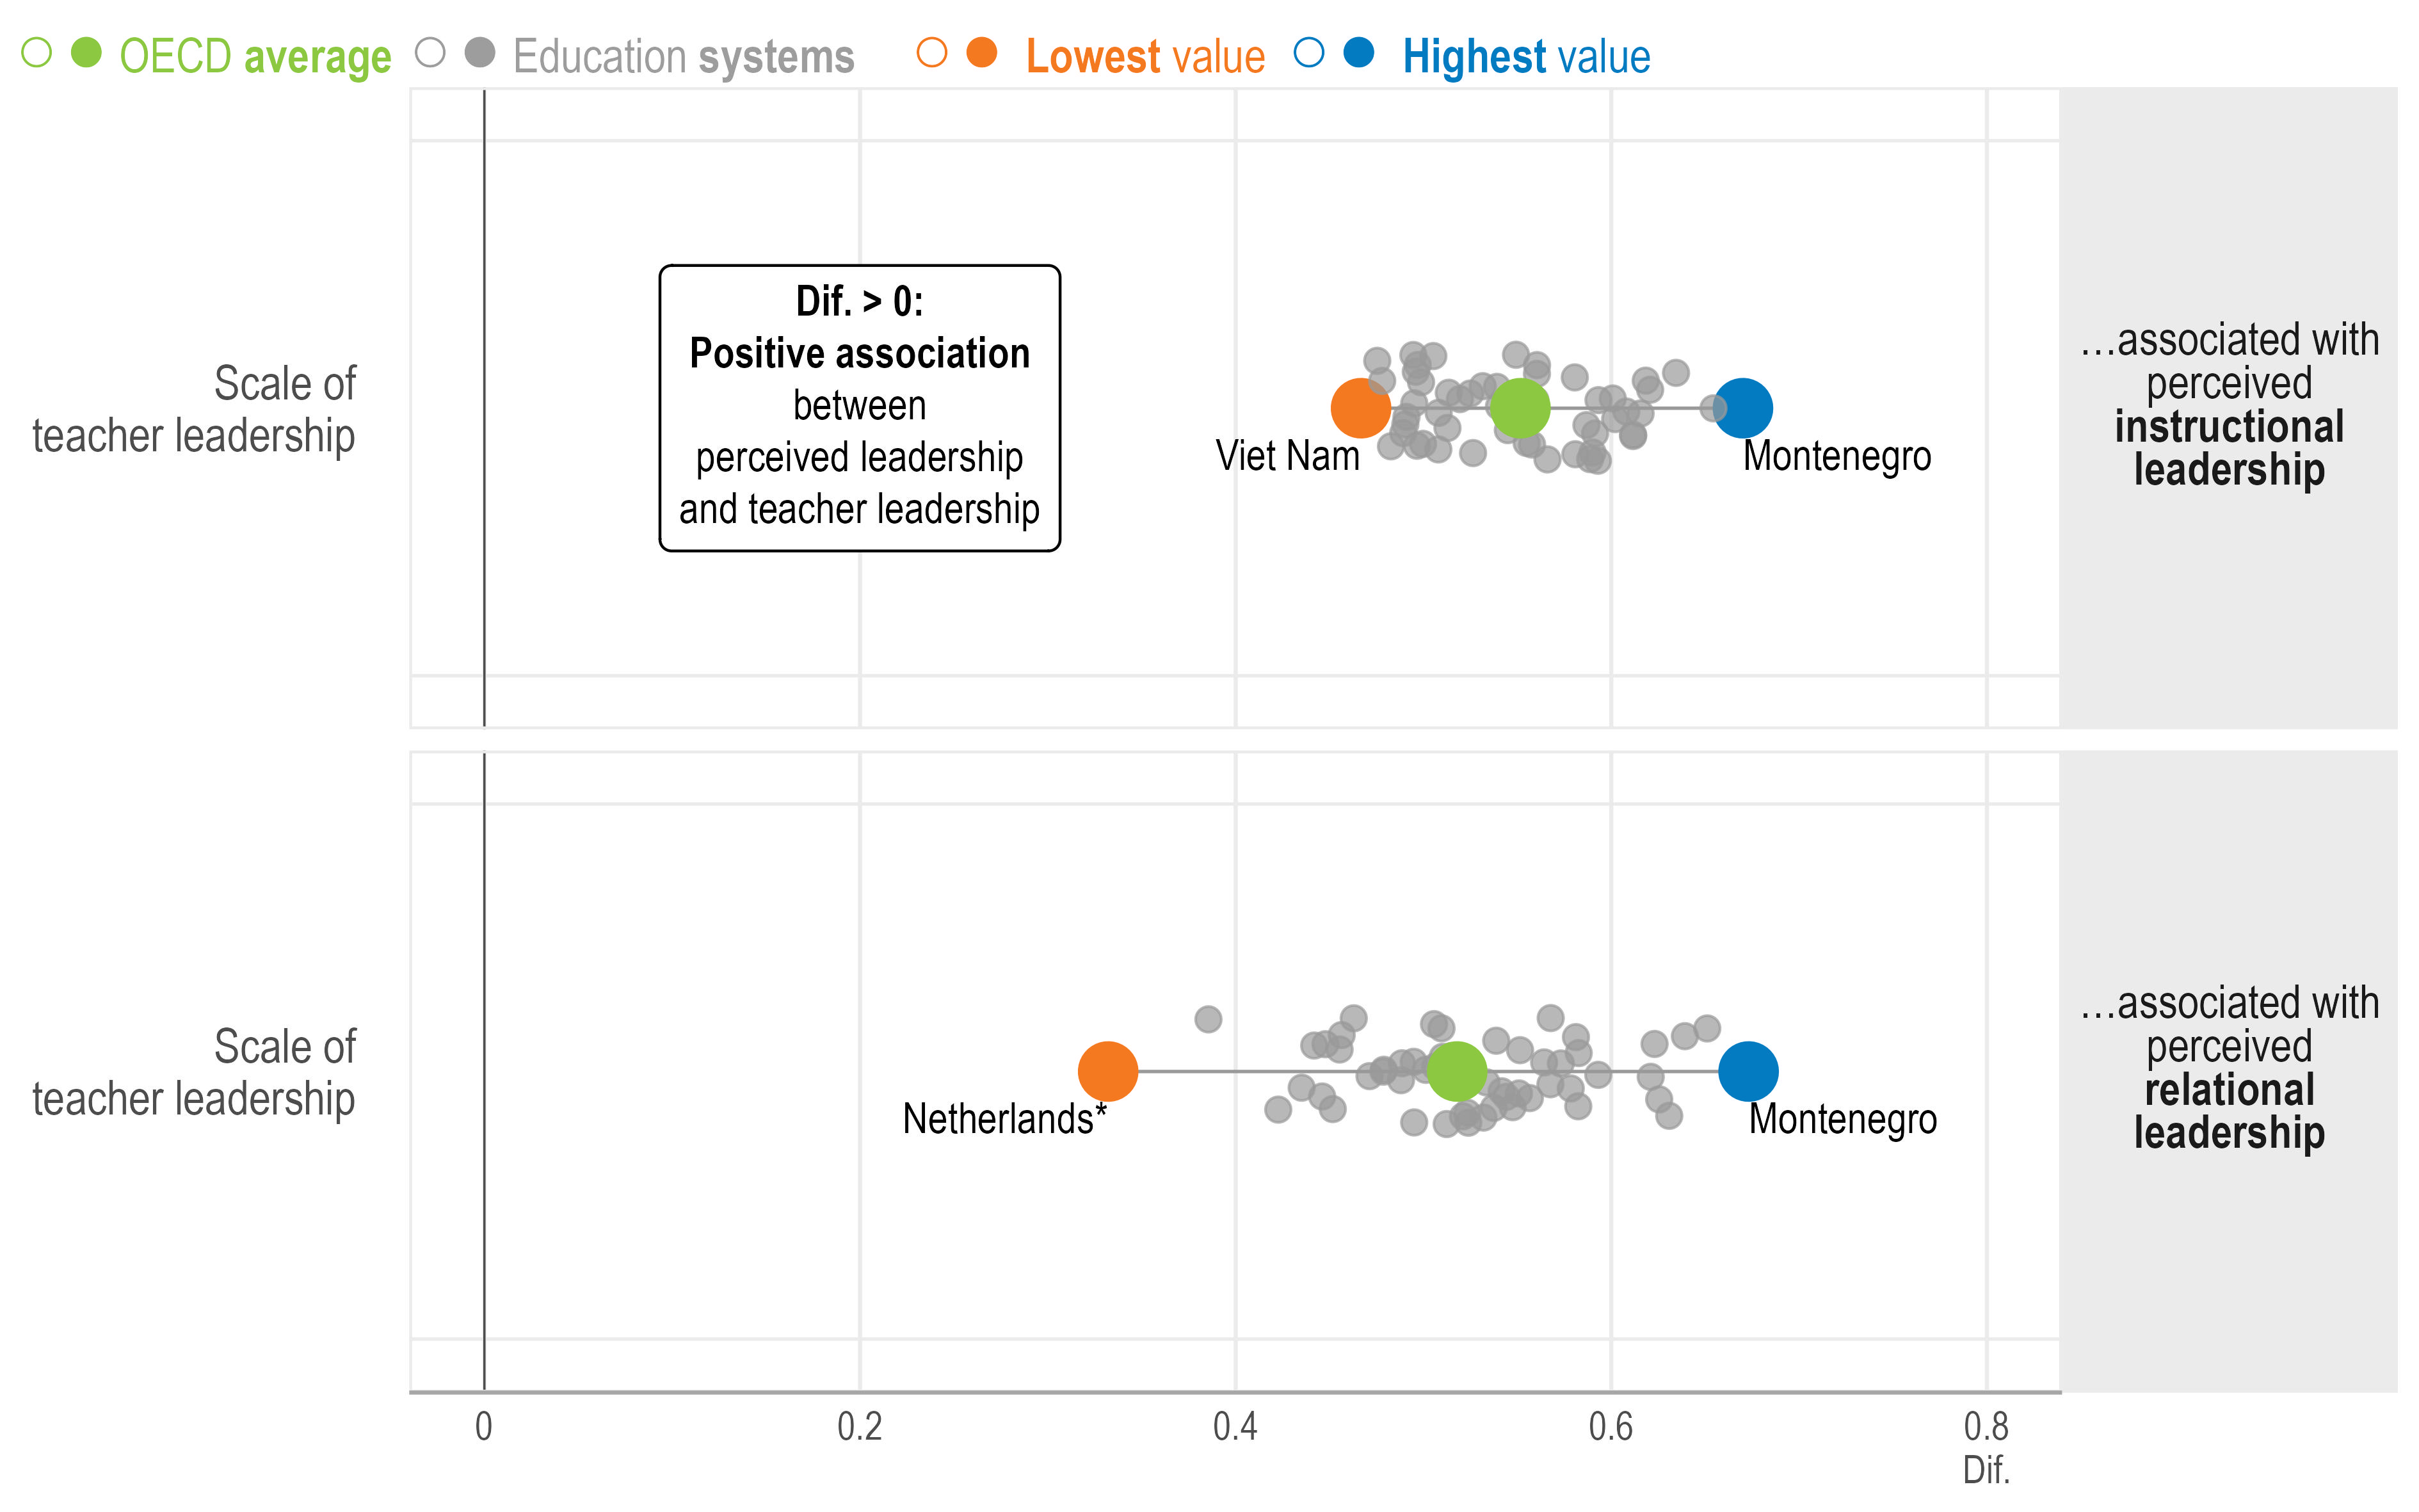
Change in the scales of lower secondary principals’ instructional and relational leadership1 associated with a one-unit increase in the scale of teacher leadership1,2
Note: *Estimates should be interpreted with caution due to a higher risk of non-response bias.
Statistically significant coefficients are highlighted with filled circles (see Annex B). Filled circles above 0 indicate a positive association, while those below 0 reflect a negative relationship.
1. Standardised scale scores with a standard deviation of 2 and the value of 10 corresponding to the item mid-point value of the response scale. For more information on the scales, see Annex B.
2. Results are based on teacher-level linear regression analyses controlling for teacher characteristics (i.e. gender and age [standardised at the international level]) and school characteristics (i.e. school governance type, school size and school intake of students from socio-economically disadvantaged homes).
Source: OECD, TALIS 2024 Database, Table 3.14.
The share of principals reporting that teachers in the school lead their own professional growth is high (88%), on average (Table 3.15). However, there is variation across systems, ranging from around half of principals in France (52%) to near-universal agreement in several systems (e.g. Albania, Bulgaria, Denmark, Korea, Romania, Singapore, Uzbekistan and Viet Nam). There is also variation with regards to principals’ reports (see Box 3.2).
Regression analyses based on TALIS 2024 data show that teachers who report higher levels of teacher leadership in their schools tend to value their principals’ leadership more (Figure 3.4). The positive association between principals’ instructional and relational leadership, and teacher leadership holds in all education systems. The strongest relationships with instructional leadership are observed in Chile, Montenegro and Romania, and with relational leadership in Montenegro, Shanghai (China) and Romania (Table 3.14).
TALIS 2024 asked both principals and teachers whether their schools encourage teachers to take on a leadership role. Teachers' and principals' reports generally align in showing that teacher leadership is common. However, on average, teachers tend to report less teacher leadership than principals (Table 3.16):
Promoting a professional learning community: while 85% of principals report that teachers take a leadership role in promoting a professional learning community, only 79% of teachers report the same.
Leading collaborative activities: 91% of principals report that teachers initiate and lead collaborative activities, while only 84% of teachers report the same.
Leading professional growth: 84% of teachers report that teachers lead their professional growth and development activities. The share of principals reporting the same is slightly higher, at 88%.
Participating in non-teaching school events and projects: the share reporting that teachers participate in non-teaching school events and projects is slightly higher among principals (87%) than teachers (84%).
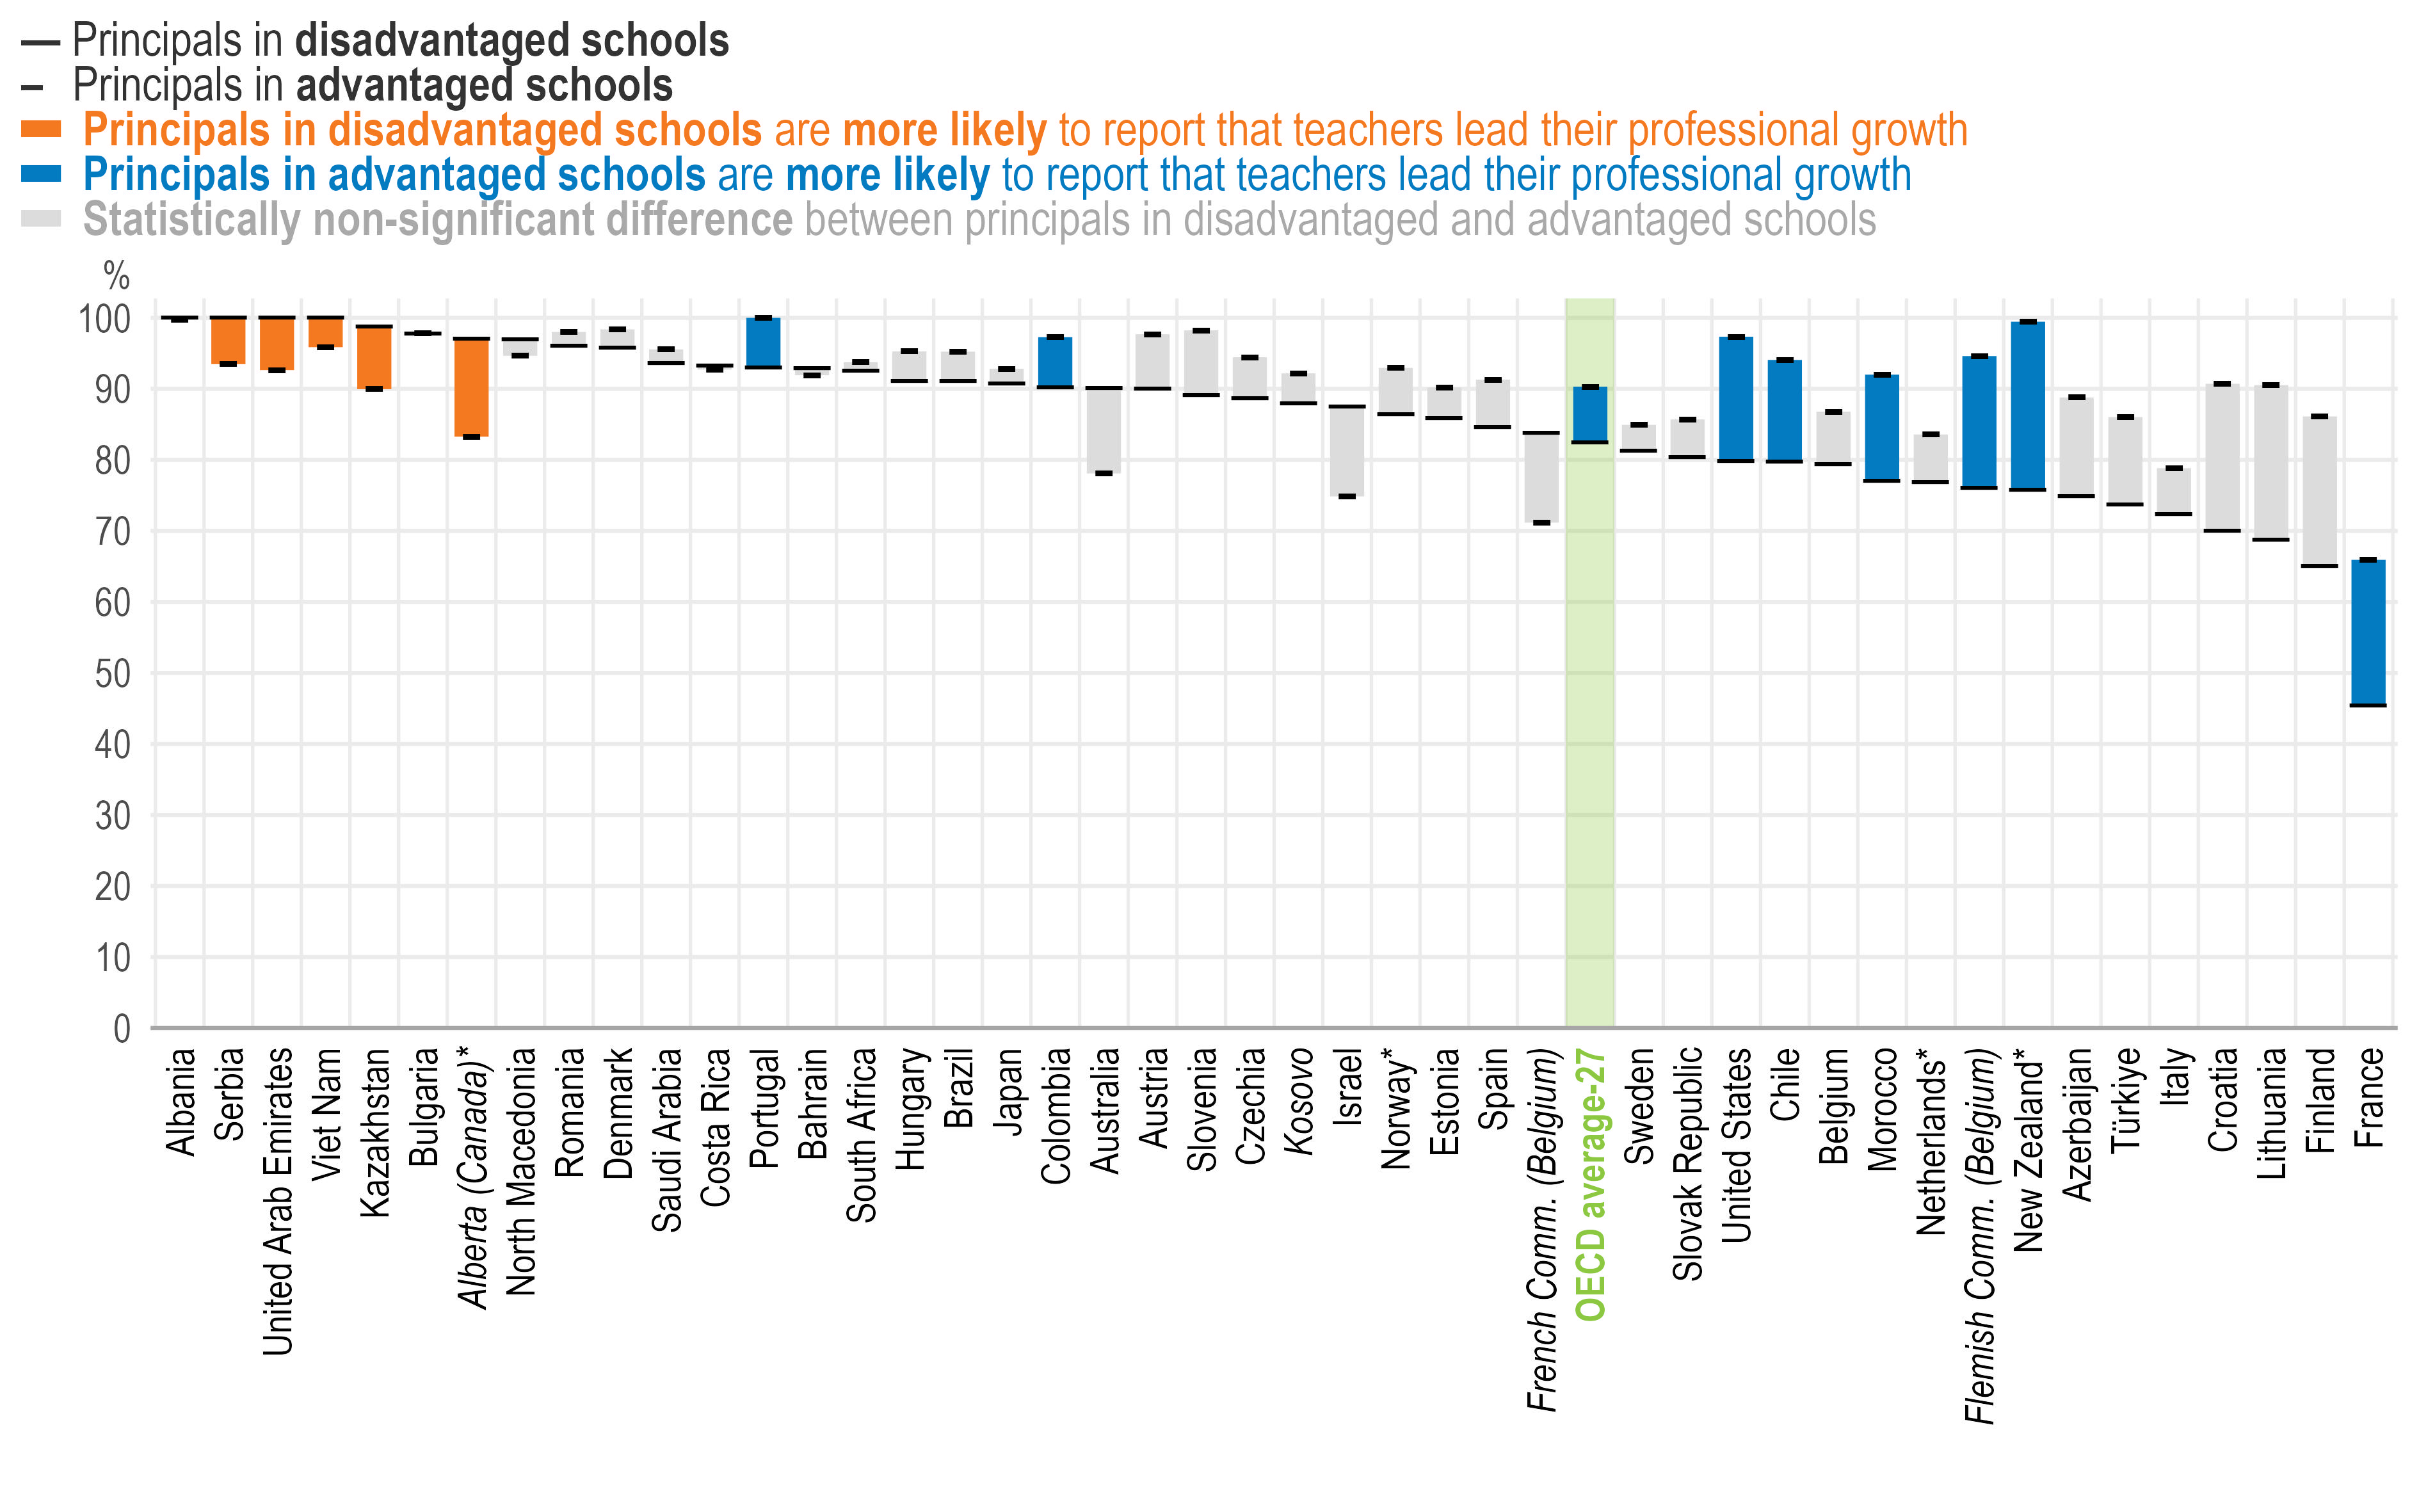
Teacher leadership varies by principal and school characteristics. On average, the share of principals reporting that teachers lead their own professional growth and development activities is higher among older (age 60 and above) and more experienced (over 10 years) principals than their younger and less experienced peers (by 10 and 4 percentage points, respectively) (Table 3.15). It is also more commonly reported, on average, in privately managed schools (by 5 percentage points), in schools with 10% or less of students with special education needs and in schools with 10% or less of students with disadvantaged backgrounds (by 7 percentage points, respectively) (Table 3.17 and Figure 3.5). The observed variation in teacher-led professional growth and development is consistent with evidence suggesting that teachers' engagement in professional learning depends on their professional environment and the opportunities and support available to them (Kraft and Papay, 2014[16]).
Figure 3.5 also reveals that in systems where teacher-led professional growth is already widespread, principals in disadvantaged schools are sometimes more likely to report these practices (e.g. Alberta [Canada]*, Kazakhstan, Serbia, the United Arab Emirates and Viet Nam). By contrast, in systems where there is less teacher-led professional growth overall, these practices are reported more often by principals in advantaged schools, as is the case in Chile, Colombia, the Flemish Community of Belgium, France, Morocco, Portugal, New Zealand* and the United States. This disparity may reflect the difficulties of sustaining such practices in certain school environments unless they are strongly embedded across the entire education system.
Percentage of lower secondary principals who "agree" or "strongly agree" that teachers at the school lead their professional growth and development activities whenever possible
Note: *Estimates should be interpreted with caution due to a higher risk of non-response bias.
Education systems are sorted in descending order by the percentage of lower secondary principals in disadvantaged schools who "agree" or "strongly agree" that teachers at the school lead their professional growth and development activities whenever possible.
Advantaged schools are those with 10% or less of students from socio-economically disadvantaged homes. Disadvantaged schools are those with more than 30% of students from socio-economically disadvantaged homes.
Source: OECD, TALIS 2024 Database, Table 3.17.
Teacher appraisal
Formal teacher appraisal, the act of reviewing teacher performance, is meant to support teachers’ professional practice by helping teachers identify strengths and areas for development and holding them accountable for their performance. While the TALIS 2024 Initial Report covered the relationship between appraisal and teachers’ well-being (OECD, 2025[17]), this section focuses on how it connects with teachers’ perceptions of principals.
Teacher appraisal led by principals is common in most education systems. On average, 88% of teachers work in schools where they are formally appraised at least once a year by their principals – see Table 3.47 in Results from TALIS 2024 (OECD, 2025[17]). Only 5% of teachers work in schools where teachers are never formally appraised.
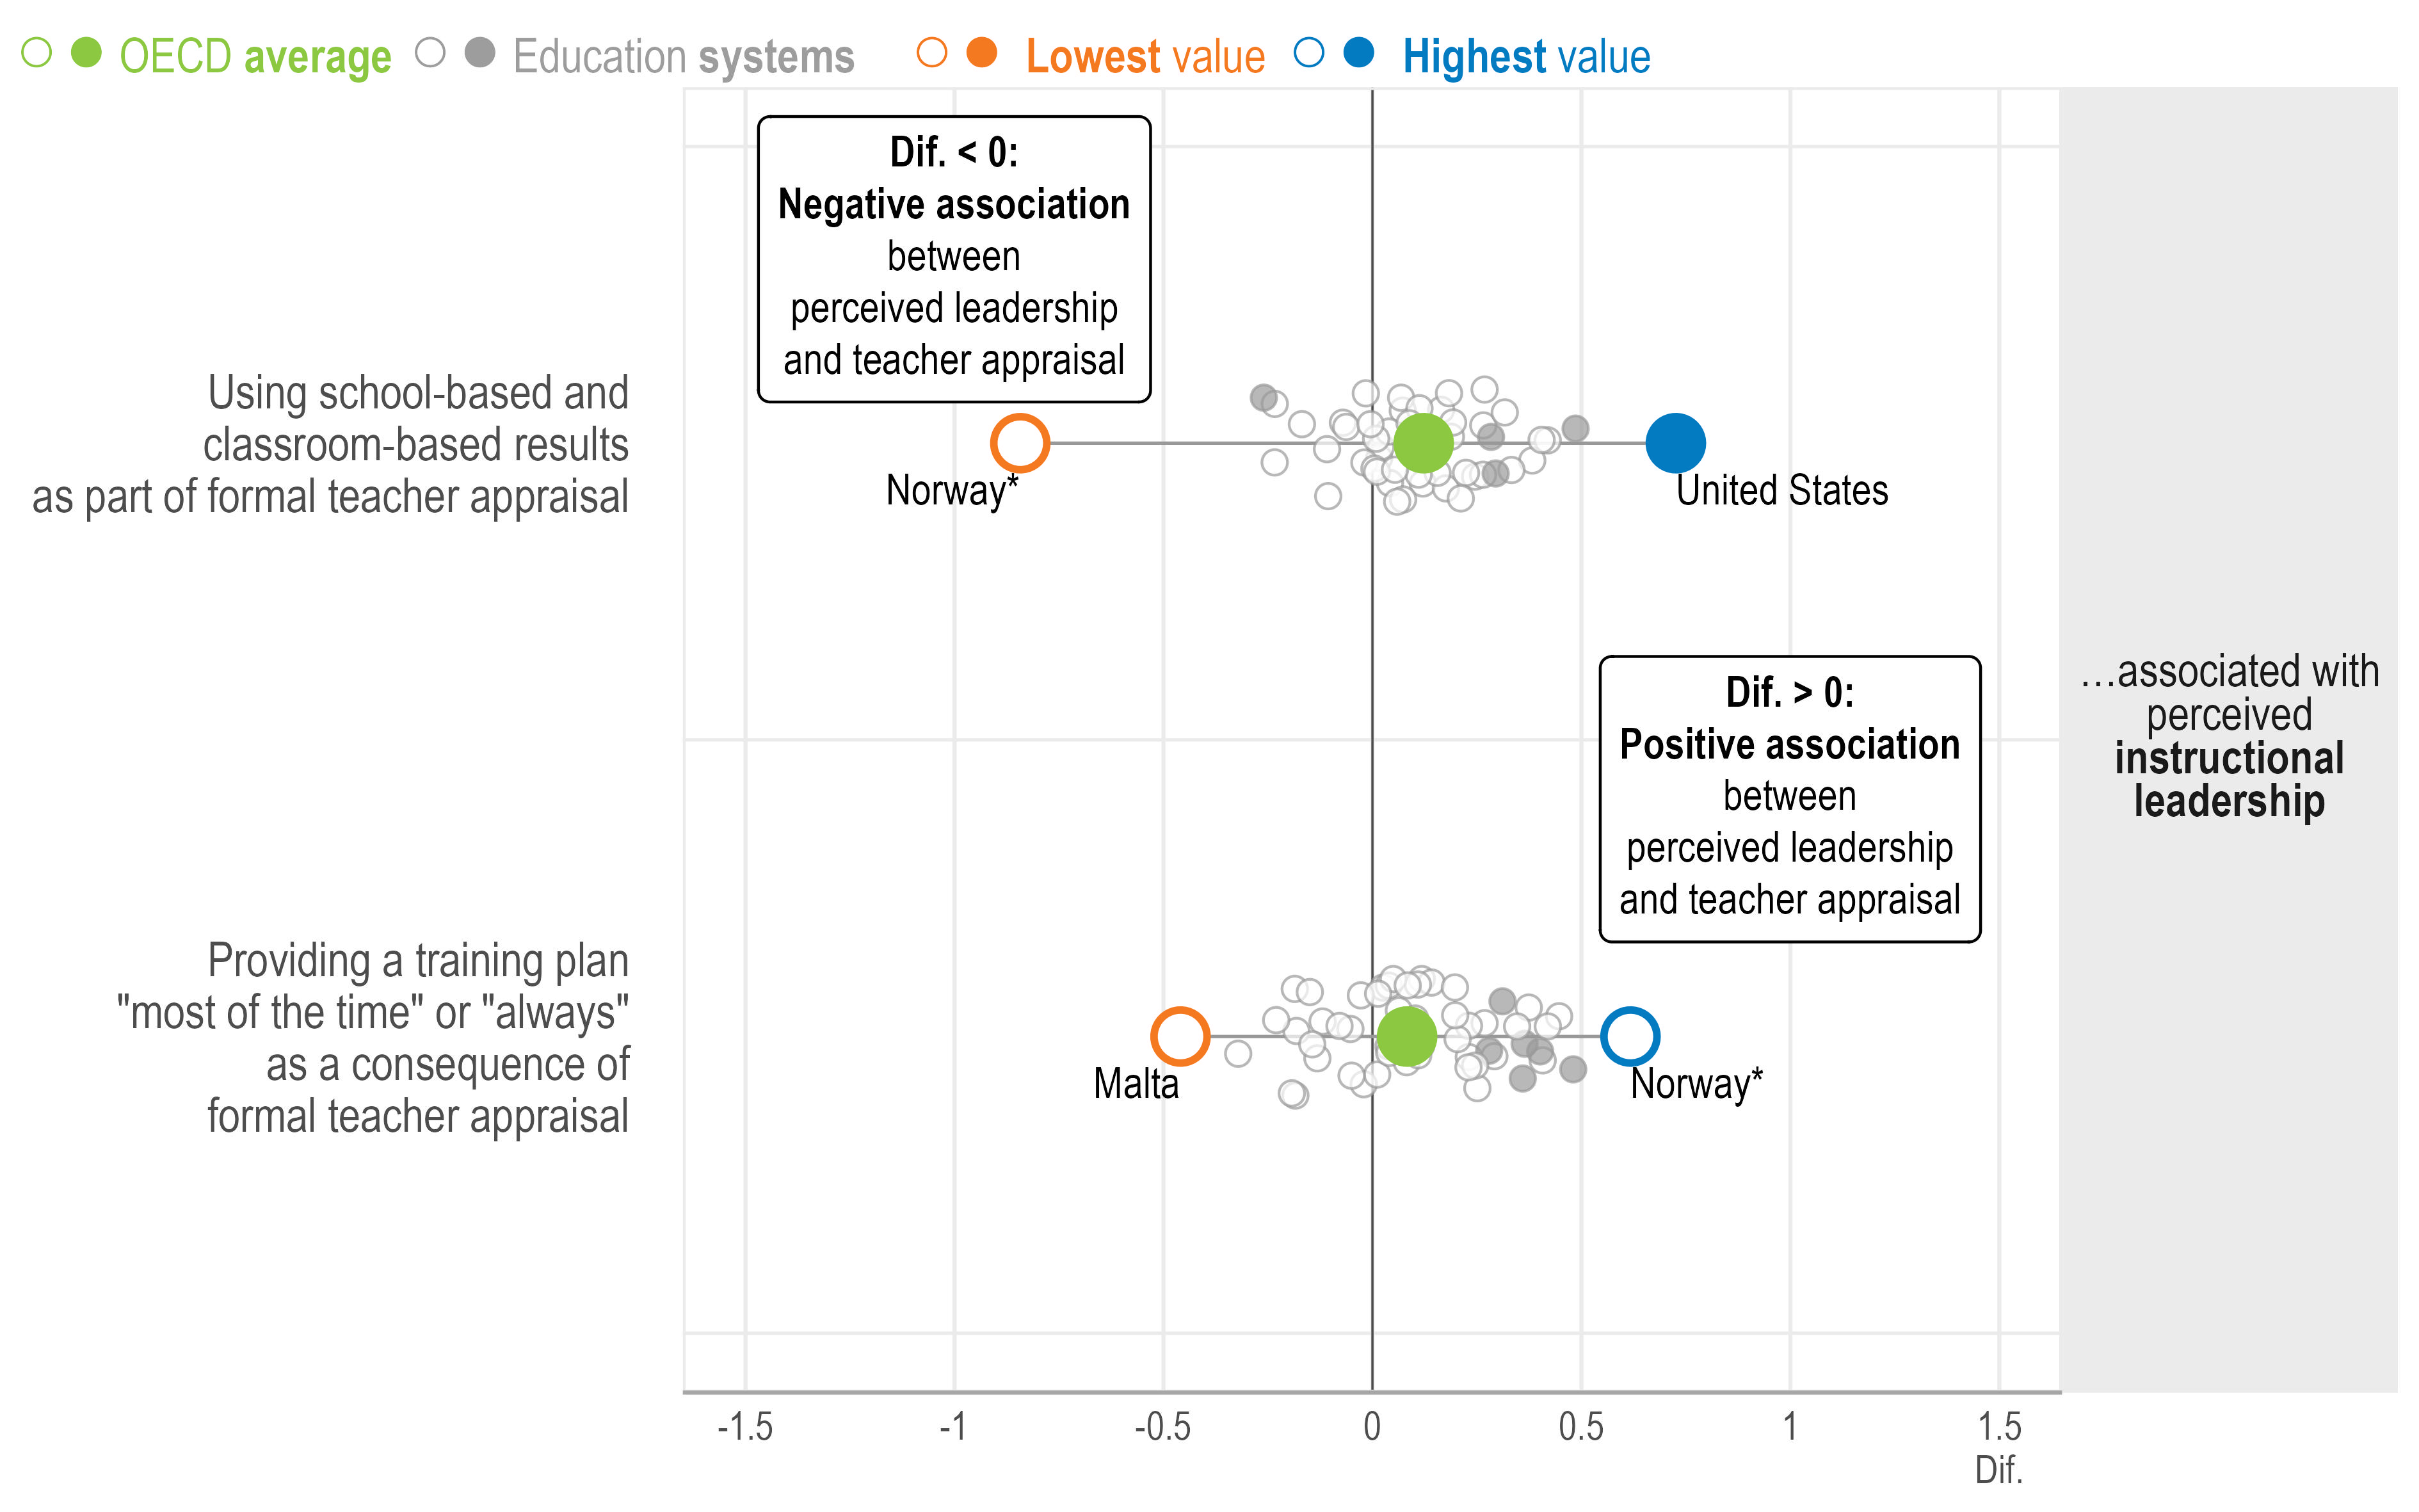
Based on TALIS 2024 data, there is no association between principals’ instructional or relational leadership and whether they formally appraise teachers at least once a year (Tables 3.18 and 3.19). However, principals who report using school- and classroom-based assessment results as part of formal teacher appraisal or preparing development/training plans following formal teacher appraisal, are generally more valued as instructional leaders (Figure 3.6). Using school- and classroom-based assessment results for teacher appraisal is positively associated with instructional leadership on average, and in Kazakhstan, Poland, the United Arab Emirates and the United States (Table 3.18). Similarly, preparing development or training plans following teacher appraisal is positively associated with instructional leadership on average, and in Australia, Colombia, Romania, Singapore, Slovenia and Spain (Table 3.23).
Change in the school-level averages of lower secondary principals’ instructional leadership scale1 associated with the following aspects of formal teacher appraisal2,3
Note: *Estimates should be interpreted with caution due to a higher risk of non-response bias.
Statistically significant coefficients are highlighted with filled circles (see Annex B). Filled circles above 0 indicate a positive association, while those below 0 reflect a negative relationship.
1. Standardised scale scores with a standard deviation of 2 and the value of 10 corresponding to the item mid-point value of the response scale. For more information on the scales, see Annex B.
2. Binary variables: the reference categories refer to not using school- and classroom-based results as part of formal teacher appraisal and providing a training plan as a consequence of formal teacher appraisal “never” or “sometimes”.
3. Results are based on school-level linear regression analyses controlling for principal characteristics (i.e. gender and age [standardised at the international level]) and school characteristics (i.e. school governance type, school size and school intake of students from socio-economically disadvantaged homes).
Source: OECD, TALIS 2024 Database, Tables 3.18 and 3.23.
This finding suggests that teachers’ perceptions of leadership are shaped less by the frequency of formal appraisal processes than by how appraisal is implemented, including the evidence used and whether it leads to meaningful professional development opportunities. This interpretation is consistent with the OECD’s Synergies for Better Learning. The report concluded that “it is not the existence of formal (teacher) appraisal requirements but the design and quality of the processes that seem to matter most for its effect on teaching and learning outcomes” (OECD, 2013[18]).
On average, 62% of principals use assessments of teachers’ school- and classroom-based results as part of formal teacher appraisal, although this ranges from 35% in Korea to 85% in the United States (Table 3.20). An average of 47% of principals report that a training or professional development plan is developed “most of the time” or “always”, following a formal teacher appraisal, with particularly wide variation across systems, ranging from 8% in Iceland to 94% in Kazakhstan (Table 3.25). The limited use of professional development plans is concerning, as teacher appraisal is unlikely to improve teaching and learning if it is not clearly linked to teachers’ professional growth (Goe, Biggers and Croft, 2012[19]; OECD, 2013[18]).
Within education systems, principals in schools with over 30% of socio-economically disadvantaged students are more likely to develop such plans following appraisal compared to their counterparts in schools with 10% or less of such students (Table 3.26). On average, the difference is 9 percentage points. In Austria, Denmark, Israel, Kosovo, Lithuania and the Netherlands*, this difference ranges between 23 and 63 percentage points. There are exceptions, however. In Azerbaijan, Estonia and Morocco, the share of principals in socio-economically advantaged schools who develop a development or training plan “most of the time” or “always”, following formal teacher appraisal, is between 25 and 35 percentage points higher compared to disadvantaged schools.
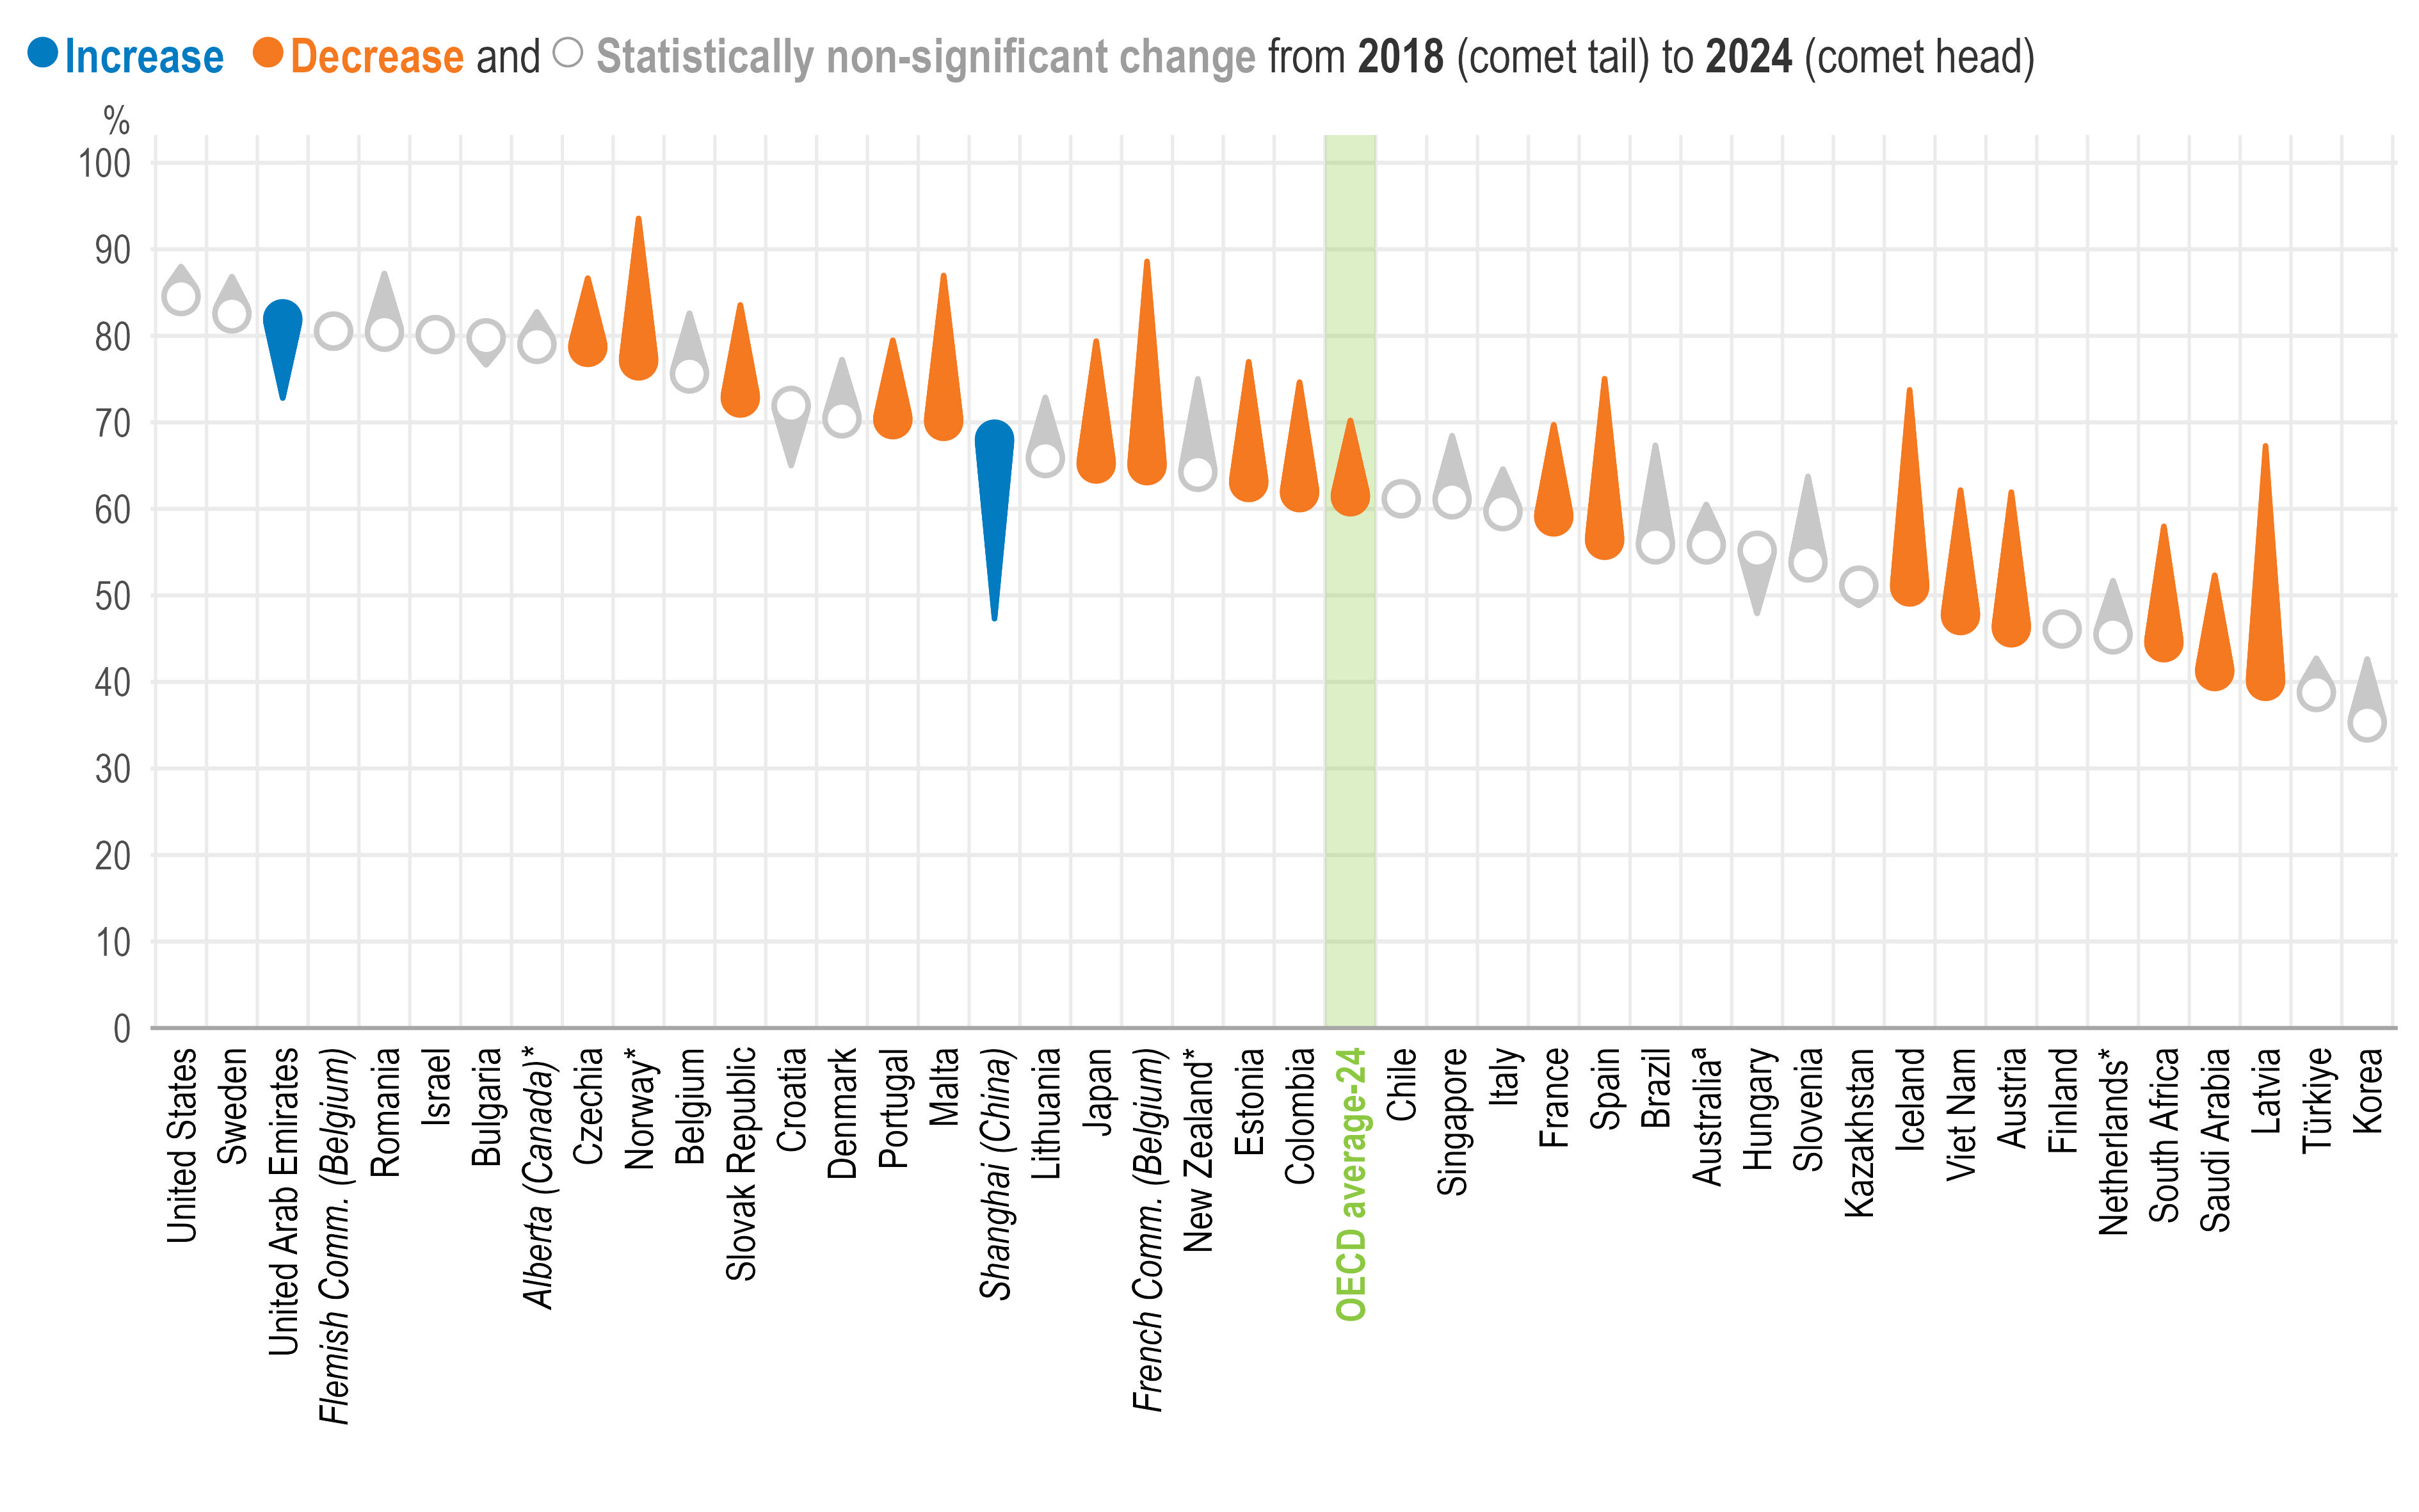
Between 2018 and 2024, the use of school-based and classroom-based results as part of the formal appraisal of teachers decreased from 70% to 61%, on average (Figure 3.7). The largest declines are observed in Latvia (27 percentage points), the French Community of Belgium (24 percentage points) and Iceland (23 percentage points). Shanghai (China) and the United Arab Emirates are the only systems where the use of school-based and classroom-based results in formal teacher appraisal increased (by 21 and 9 percentage points, respectively) during the same period.
Several factors may explain the decline in the use of school-based and classroom-based results in formal teacher appraisal. Policymakers in some systems are more cautious about relying heavily on these measures due to concerns about excessive accountability pressures. They are also more sceptical about how well such results capture teaching quality (OECD, 2013[18]). In other systems, teacher appraisal may have placed greater emphasis on professional dialogue or other sources of information about teachers’ professional performance (e.g. with greater reliance on peer reviews, as discussed in (Quenette and Rybas, 2023[20]).
Percentage of lower secondary principals who report using school- and classroom-based results as part of formal teacher appraisal
Note: *Estimates should be interpreted with caution due to a higher risk of non-response bias.
ª Estimates for TALIS 2018 and the change between TALIS 2018 and TALIS 2024 should be interpreted with caution due to a higher risk of non-response bias.
Education systems are sorted in descending order by the percentage of lower secondary principals in 2024 who report using school- and classroom-based results as part of formal teacher appraisal.
Source: OECD, TALIS 2018 and TALIS 2024 Databases, Table 3.22.
School management
The smooth running of a school depends on a range of administrative and management tasks. This section explores how principals’ engagement in these activities relates to how their instructional and relational leadership is perceived. It also examines the extent to which principals collaborate with other stakeholders in school decision making.
Organisation and planning
TALIS 2024 asked principals questions about the organisation and planning of school operations, including whether schools provide in-person, online or hybrid lessons; the time principals spend on administrative tasks and meetings; the extent to which they review school administrative procedures and reports, or resolve problems with lesson timetables “often” or “very often”; and types of student ability grouping (i.e. for some or all subjects, into different classrooms or the same classroom). Based on TALIS 2024 data, however, principals’ reported engagement in these activities is not linked to how they are valued as leaders (Tables 3.28, 3.29, 3.30, 3.31, 3.32, 3.33, 3.34 and 3.35).
This does not imply that principals’ management of personnel, resources or daily school operations do not matter. On the contrary, the literature suggests that these responsibilities play an important role in how well a school is run (Grissom, Egalite and Lindsay, 2021[5]). One possible interpretation is that no single organisational structure or management approach is consistently associated with principals’ being valued by teachers. Principals may be highly valued regardless of whether teaching is delivered in person or online, or whether students are grouped by ability. Alternatively, what matters may not be organisational arrangements themselves, but how principals implement them to meet their schools' needs. Because TALIS does not capture how effectively principals carry out these practices or the degree of autonomy they have in doing so, the available data do not allow to determine which explanation is more likely.
Principals in primary education are more valued when they report:
having some, but not excessive, teaching responsibilities (Tables 3.12 and 3.13);
working on professional learning plans for the school (Tables 3.34 and 3.35);
actively engaging stakeholders in decision making (Tables 3.34 and 3.35);
overseeing grouping students by ability in classrooms (Tables 3.32 and 3.33);
focusing on curriculum and instructional tasks, such as classroom observation and teacher feedback, and supporting the integration of technology for teaching (Tables 3.1, 3.2, 3.5 and 3.6);
supporting teacher leadership (Table 3.14);
appraising teachers at least once a year and using assessments of teachers' content knowledge and teachers' self-assessments of their work in formal teacher appraisal, followed by development/training plans (Tables 3.18, 3.19, 3.23 and 3.24);
interact with students on a weekly basis (Table 3.41).
How much primary school principals use these practices can differ from that observed among principals in lower secondary education. It can also vary across primary school principals depending on school and principal characteristics. For example, there are differences with respect to:
Curriculum and instruction: The share of primary principals who spend time on curriculum- and teaching-related tasks and meetings at least weekly is 3 percentage points higher compared to their colleagues in lower secondary education (Table 3.3). Particularly large differences are observed in the Netherlands* (29 percentage points more) and Australia (26 percentage points more), while the opposite pattern is observed in the United Arab Emirates (9 percentage points fewer). These results may reflect the fact that primary school principals often play a more direct pedagogical and co-ordination role due to younger students, broader teaching responsibilities and smaller school structures.
Collaborative decision making: Within primary education, a larger share of principals from publicly managed schools “agree” or “strongly agree” that staff are given opportunities to actively participate in school decisions than those from privately managed schools (Table 3.39). On average, primary principals are also less likely than lower secondary principals to provide students with opportunities to actively participate in school decision making (Table 3.36). However, increases in student participation opportunities have been observed in Australiaª, France and the United Arab Emirates (Table 3.40).
Connections with students, parents and the community: In primary education, female principals and those working in schools with a large share of socio-economically disadvantaged students (over 30%) are more likely to interact with students at least every week than male principals and those in schools with a low share of such students (10% or less) (Tables 3.42 and 3.43).
On average, the share of primary principals who report that parents and guardians are involved in school activities "quite a bit" or "a lot" is 7 percentage points higher than in lower secondary education (Table 3.46). Morocco is a notable exception, with a share that is 21 percentage points lower. Between 2018 and 2024, this share increased in the Netherlands*a and the United Arab Emirates, but decreased by 22 percentage points in France (Table 3.48).
On average, the share of primary principals reporting good school co-operation with the local community is 4 percentage points higher compared to lower secondary principals (Table 3.52). Among primary principals, those in rural and publicly managed schools, and in schools without students with language difficulties, are more likely to report such co-operation.
Note: *Estimates should be interpreted with caution due to a higher risk of non-response bias.
ª Estimates for TALIS 2018 and the change between TALIS 2018 and TALIS 2024 should be interpreted with caution due to a higher risk of non-response bias.
Collaborative decision making
Practices that distribute responsibility and create opportunities for teachers and other stakeholders, such as parents or guardians, to participate in school decision making builds positive school climates. It encourages stronger collegial relationships and collaboration among teachers (Pont, Nusche and Moorman, 2008[2]). The literature also suggests that collaborative and participatory forms of leadership can support teacher retention and students’ success (Avvisati et al., 2014[21]). Other studies have identified “bottom up” influence in decision making as a characteristic of highly innovative schools (Geijsel, Sleegers and Van Den Berg, 1999[22]; OECD, 2020[9]).
Across education systems, principals widely report providing opportunities for staff, students and parents to participate in school decisions (Table 3.36). Providing opportunities for staff participation is almost universal, with 98% of principals reporting this, on average. A large share of principals also report opportunities for parents or guardians (81%) and students (85%) to actively participate in school decisions (Table 3.36).
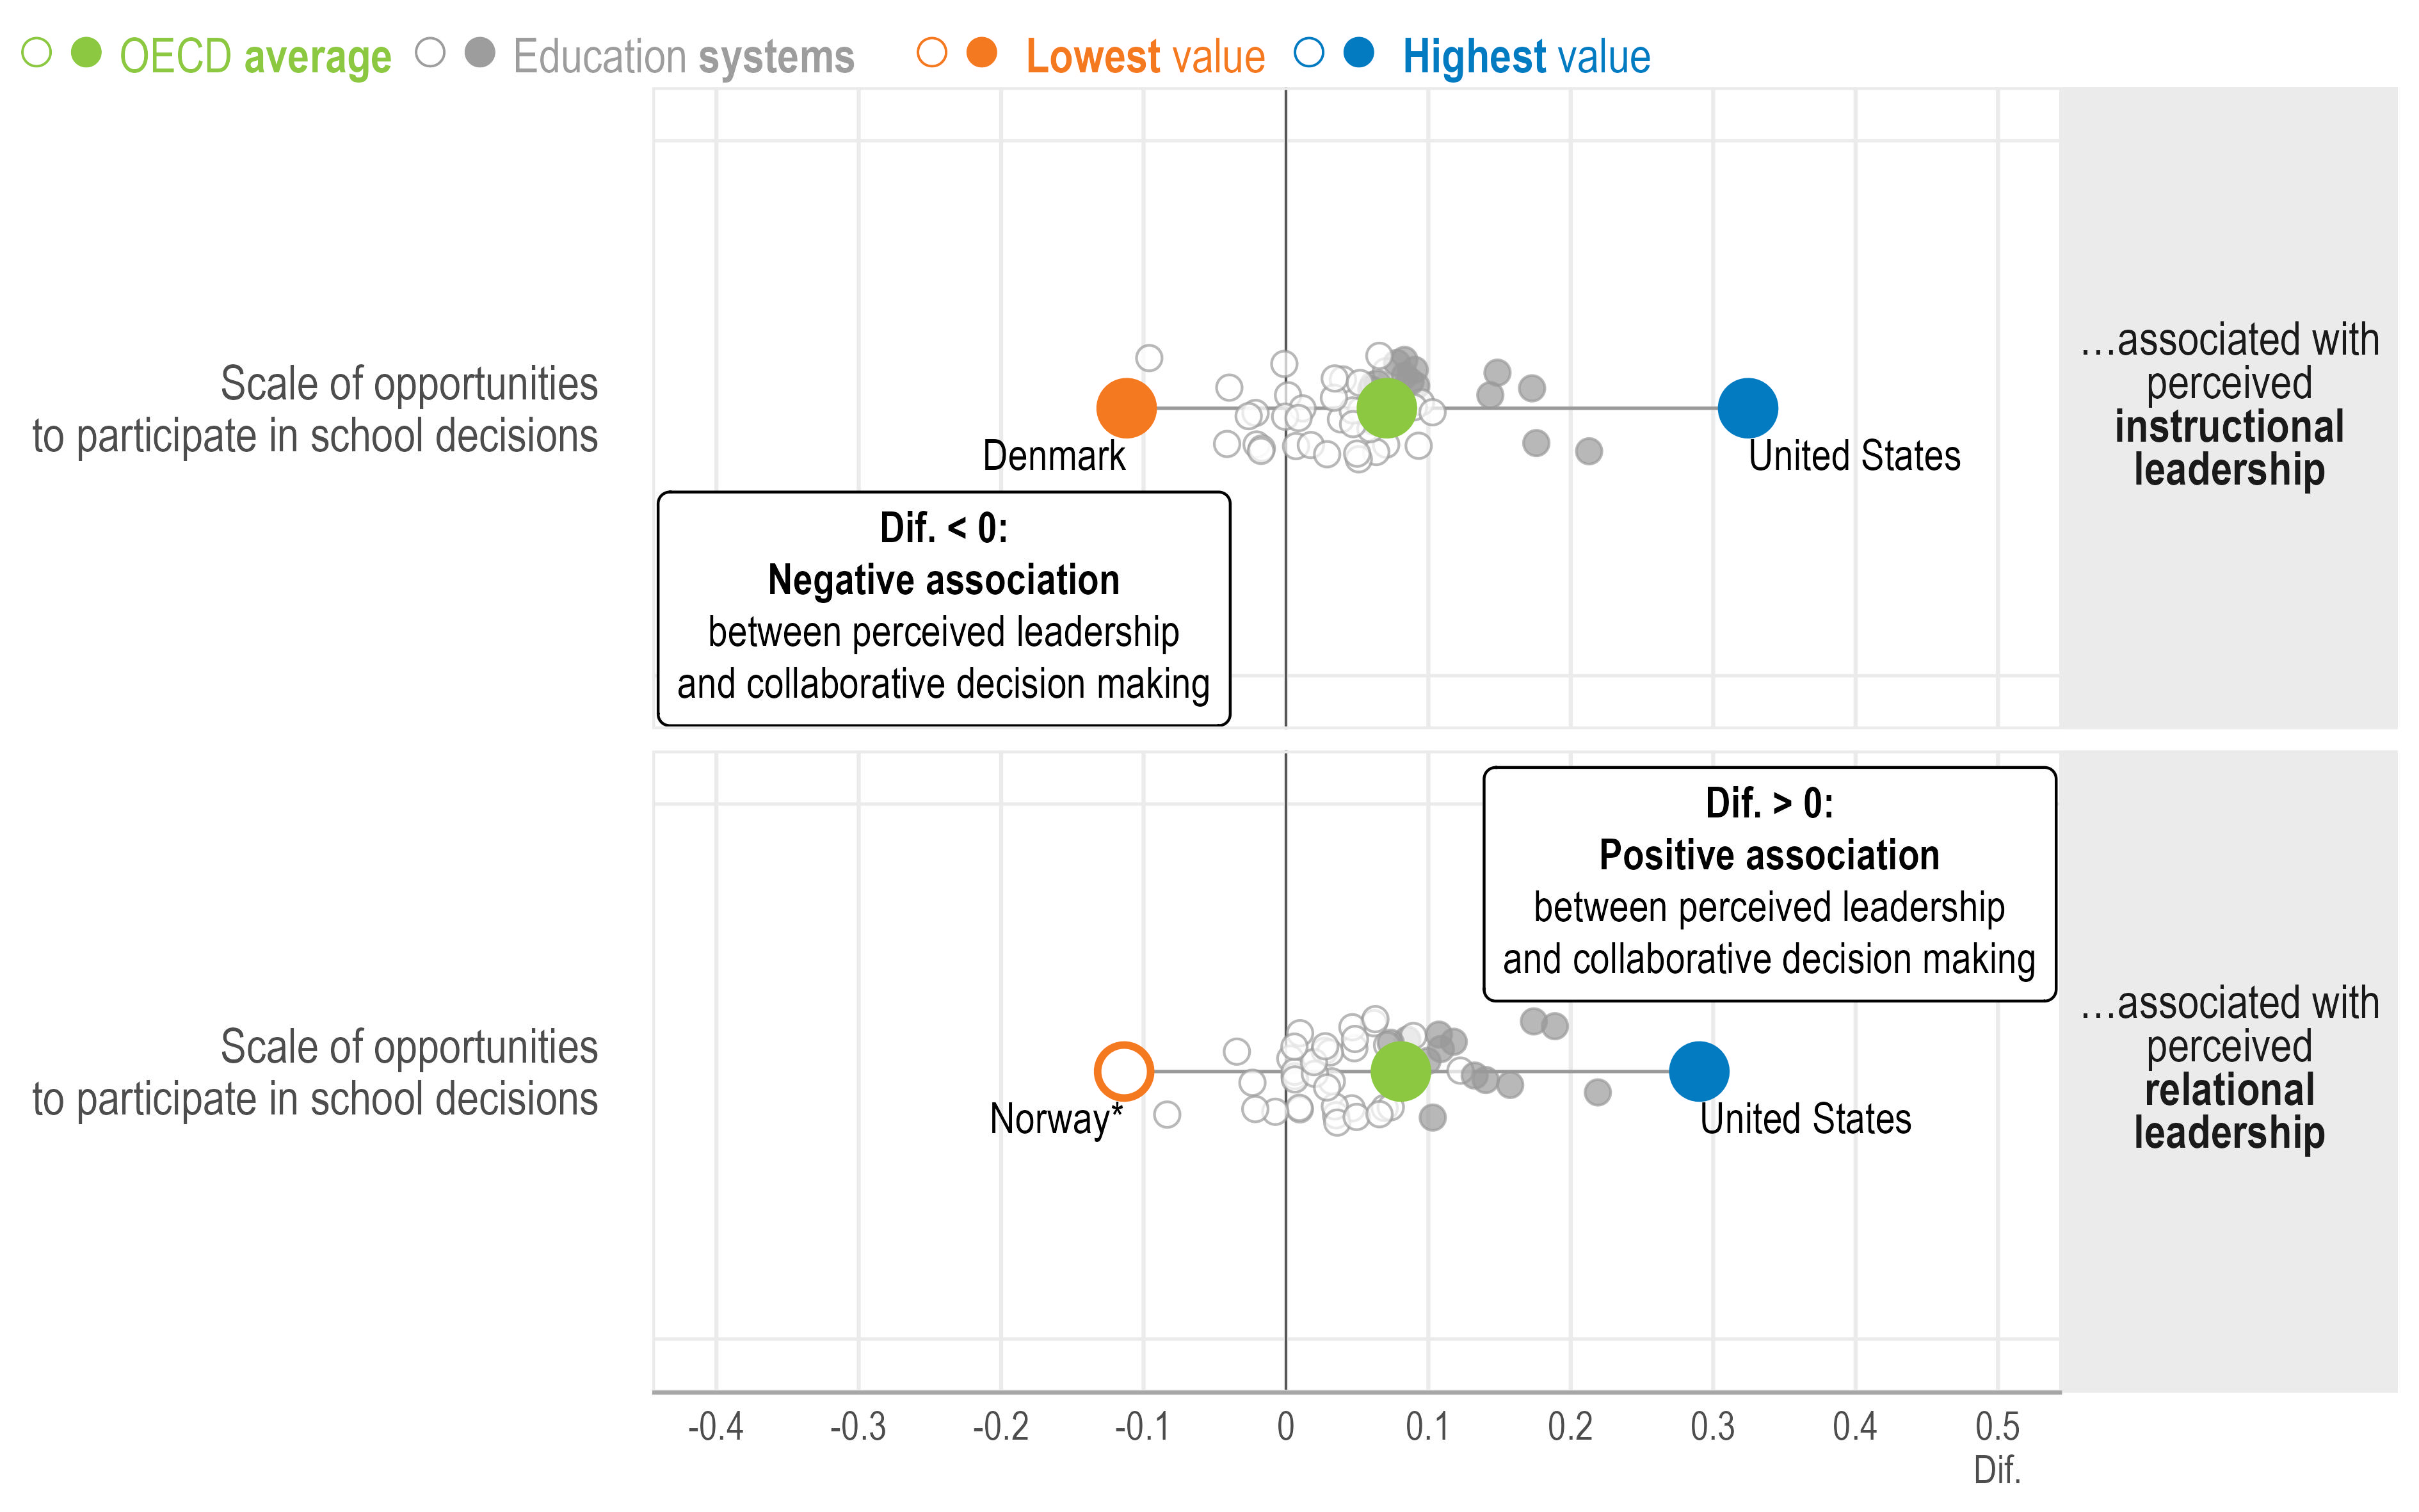
Results from TALIS 2024 corroborate the significance of participatory decision making: regression analyses show that, on average, principals that offer opportunities for other stakeholders to participate in school decisions tend to be more valued as both instructional and relational leaders (Figure 3.8). The strongest relationships with instructional leadership are observed in Colombia, Finland, Latvia, Montenegro, New Zealand* and the United States (Table 3.34), and with relational leadership in Finland, Korea, Latvia, Montenegro, New Zealand*, Sweden and the United States (Table 3.35).
Change in the school-level averages of lower secondary principals’ instructional and relational leadership scales1 associated with a one-unit increase in the scale of opportunities to participate in school decisions1,2
Note: *Estimates should be interpreted with caution due to a higher risk of non-response bias.
Statistically significant coefficients are highlighted with filled circles (see Annex B). Filled circles above 0 indicate a positive association, while those below 0 reflect a negative relationship.
1. Standardised scale scores with a standard deviation of 2 and the value of 10 corresponding to the item mid-point value of the response scale. For more information on the scales, see Annex B.
2. Results are based on school-level linear regression analyses controlling for principal characteristics (i.e. gender and age [standardised at the international level]) and school characteristics (i.e. school governance type, school size and school intake of students from socio-economically disadvantaged homes).
Source: OECD, TALIS 2024 Database, Tables 3.34 and 3.35.
Between 2018 and 2024, the share of principals reporting that their school enables students to participate in school decisions increased by 6 percentage points, on average (Figure 3.9). The largest increase was observed in Japan (37 percentage points), although the share of principals in Japan who involved students in school decisions – 70% in 2024 – was still below the OECD average (85%). As highlighted in Box 3.4, Japan has various policies to strengthen schools’ collaboration with stakeholders, including a strengthened national curriculum that provides structured opportunities for students to participate in deliberation, collective decision making and the organisation of school life.
Involving students in decision making can also strengthen their sense of belonging at school. Principals’ reports of increased student involvement in school decisions between 2018 and 2024 coincided with a rise in students’ sense of belonging between 2018 and 2025, as shown by PISA 2025 results (see Table I.B1.3.63 in PISA 2025 Results (Volume I) (OECD, 2026[23])). Japan recorded the largest increase in both indicators, although these parallel trends do not establish a causal relationship. Involving young people in decision making can bring other benefits as well (discussed in detail by Gottschalk and Borhan (2023[24]), but creating meaningful opportunities for participation can be time-consuming and resource-intensive for schools.
Percentage of lower secondary principals who "agree" or "strongly agree" that the school provides students with opportunities to actively participate in school decisions
Note: *Estimates should be interpreted with caution due to a higher risk of non-response bias.
ª Estimates for TALIS 2018 and the change between TALIS 2018 and TALIS 2024 should be interpreted with caution due to a higher risk of non-response bias.
Education systems are sorted in descending order by the percentage of lower secondary principals in 2024 who "agree" or "strongly agree" that the school provides students with opportunities to actively participate in school decisions.
Source: OECD, TALIS 2018 and TALIS 2024 Databases, Table 3.40.
Japan has aimed to strengthen partnerships between schools, parents, local communities and specialised staff, while also broadening leadership and participation within schools. These efforts have involved the following initiatives:
Tokkatsu (“Student-Led Activities for Civic and Personal Development”): Tokkatsu is a mandatory component of Japan's national curriculum from primary through upper secondary school, through which students collectively manage their lives, develop collaborative skills and practise democratic participation. The revision of the national curriculum standards, which was issued in 2017–2018, and implemented in 2020 at primary, 2021 at lower secondary and 2022 at upper secondary level, gave it a stronger framing, linking it explicitly to student-led deliberation and problem-solving. Tokkatsu is organised around:
Classroom activities (Gakkyū Katsudō) where students deliberate and decide on class rules, organise events and resolve shared concerns through facilitated discussions;
Student-council activities (Seitokai Katsudō) in which students raise issues, propose improvements to school life and engage directly with school management;
Club activities (Kurabu Katsudō) that students organise and sustain collectively, developing leadership and responsibility;
School events (Gakkō Gyōji) (e.g. sports days, cultural festivals, excursions) that students plan and run with significant autonomy.
Team Gakkou (“School as a Team”): This reform, announced in January 2016 and implemented in 2017, reorganised schools into multidisciplinary teams involving teachers, counsellors, social workers, information and communications technology (ICT) specialists, and community members (e.g. parents and local residents). Among other things, this initiative aims to reduce teachers’ administrative burden, distribute leadership more broadly within schools and strengthen school-community partnerships to better support students’ holistic development.
Community schools: “Community schools” are public schools overseen by School Management Councils, which are composed of parents, guardians and local residents. Councils provide input on school policies, operations and staffing decisions, with the aim of creating schools that better reflect local priorities and strengthen school-community collaboration.
Collaborative community networks (Chiiki Gakkou Kyoudou Honbu): Set out in 2016, these networks promote links between schools, volunteers, organisations and community groups through initiatives such as after-school programmes, community tutoring and school support activities.
Sources:
OECD (2018). Education Policy in Japan: Building Bridges towards 2030. Reviews of National Policies for Education. OECD Publishing, Paris. https://doi.org/10.1787/9789264302402-en
MEXT (2017). Course of Study for Lower Secondary Schools (Chūgakkō Gakushū Shidō Yōryō). Ministry of Education, Culture, Sports, Science and Technology. https://www.mext.go.jp/content/1413522_002.pdf
NIER / MEXT (2018). Making a Better Classroom/School Life Together: Special Activities. Curriculum Research Center, National Institute for Educational Policy Research. https://www.eduport.mext.go.jp
NIER (2012). Lower Secondary Education in Japan. National Institute for Educational Policy Research. https://www.nier.go.jp/English/educationjapan/pdf/201203LSJ.pdf
Tsuneyoshi, R. (2020). Japanese Educational Policy and the Curriculum of Holistic Development. In G. Fan & T. S. Popkewitz (Eds.), Handbook of Education Policy Studies. Springer, Singapore. https://doi.org/10.1007/978-981-13-8343-4_8
Between 2018 and 2024, the percentage of principals reporting that their school enabled parents or guardians to participate in school decisions decreased by 2 percentage points, on average (Table 3.40). The largest declines were observed in Kazakhstan and the Slovak Republic (12 percentage points), while in Japan and Viet Nam percentages increased by 18 and 13 percentage points, respectively. Difficulties in getting certain parent groups involved may have to do with parents’ socio-economic background and/or educational attainment, or linguistic and cultural reasons that distance them from their children’s school (European School Education Platform, 2026[25]; Jafarov, 2015[26]).
Building strong partnerships with students, parents or guardians and the wider community is an increasingly important responsibility of school leaders. Developing these relationships can help schools connect with, adapt to and influence their surrounding environments, while also strengthening trust, participation and engagement within school communities (OECD, 2020[9]; Pont, Nusche and Moorman, 2008[2]; Schleicher, 2018[27]).
On average, most principals report making efforts to engage with students (80%) and the local community (70%), while involving parents and guardians in school activities is less common (45%) (Figure 3.10). However, the OECD average masks substantial variation across education systems in how commonly principals engage with stakeholders:
While in the Netherlands* only around half of principals (48%) report spending time with students at least weekly, almost all principals (99%) do so in the United States.
The percentage of principals who report that the school co-operates with the local community "quite a bit" or "a lot" varies from 25% in Sweden to 99% in Italy.
In Finland, only 15% of principals report that parents and guardians are involved in school activities "quite a bit" or "a lot", compared to 93% in Albania.
Percentage of lower secondary principals who report the following engagement with students, parents or the local community
Note: *Estimates should be interpreted with caution due to a higher risk of non-response bias.
Source: OECD, TALIS 2024 Database, Tables 3.42, 3.46 and 3.51.
Several complementary explanations may account for the variation observed across education systems. Some differences may reflect national policy and governance arrangements. In Italy, for example, principals are expected by law to promote collaboration with local authorities, and fostering relationships with external stakeholders forms part of the annual evaluation of their performance (UNESCO, 2024[28]). Cross-system variation may also reflect differences in how leadership responsibilities are organised and principals' time is allocated. For example, research suggests that communication between Swedish schools and parents is extensive and has intensified in recent years (Hedlin and Frank, 2022[29]; Kristoffersson, Gu and Zhang, 2013[30]). However, much of this interaction takes place between teachers and parents, and focuses on individual students.
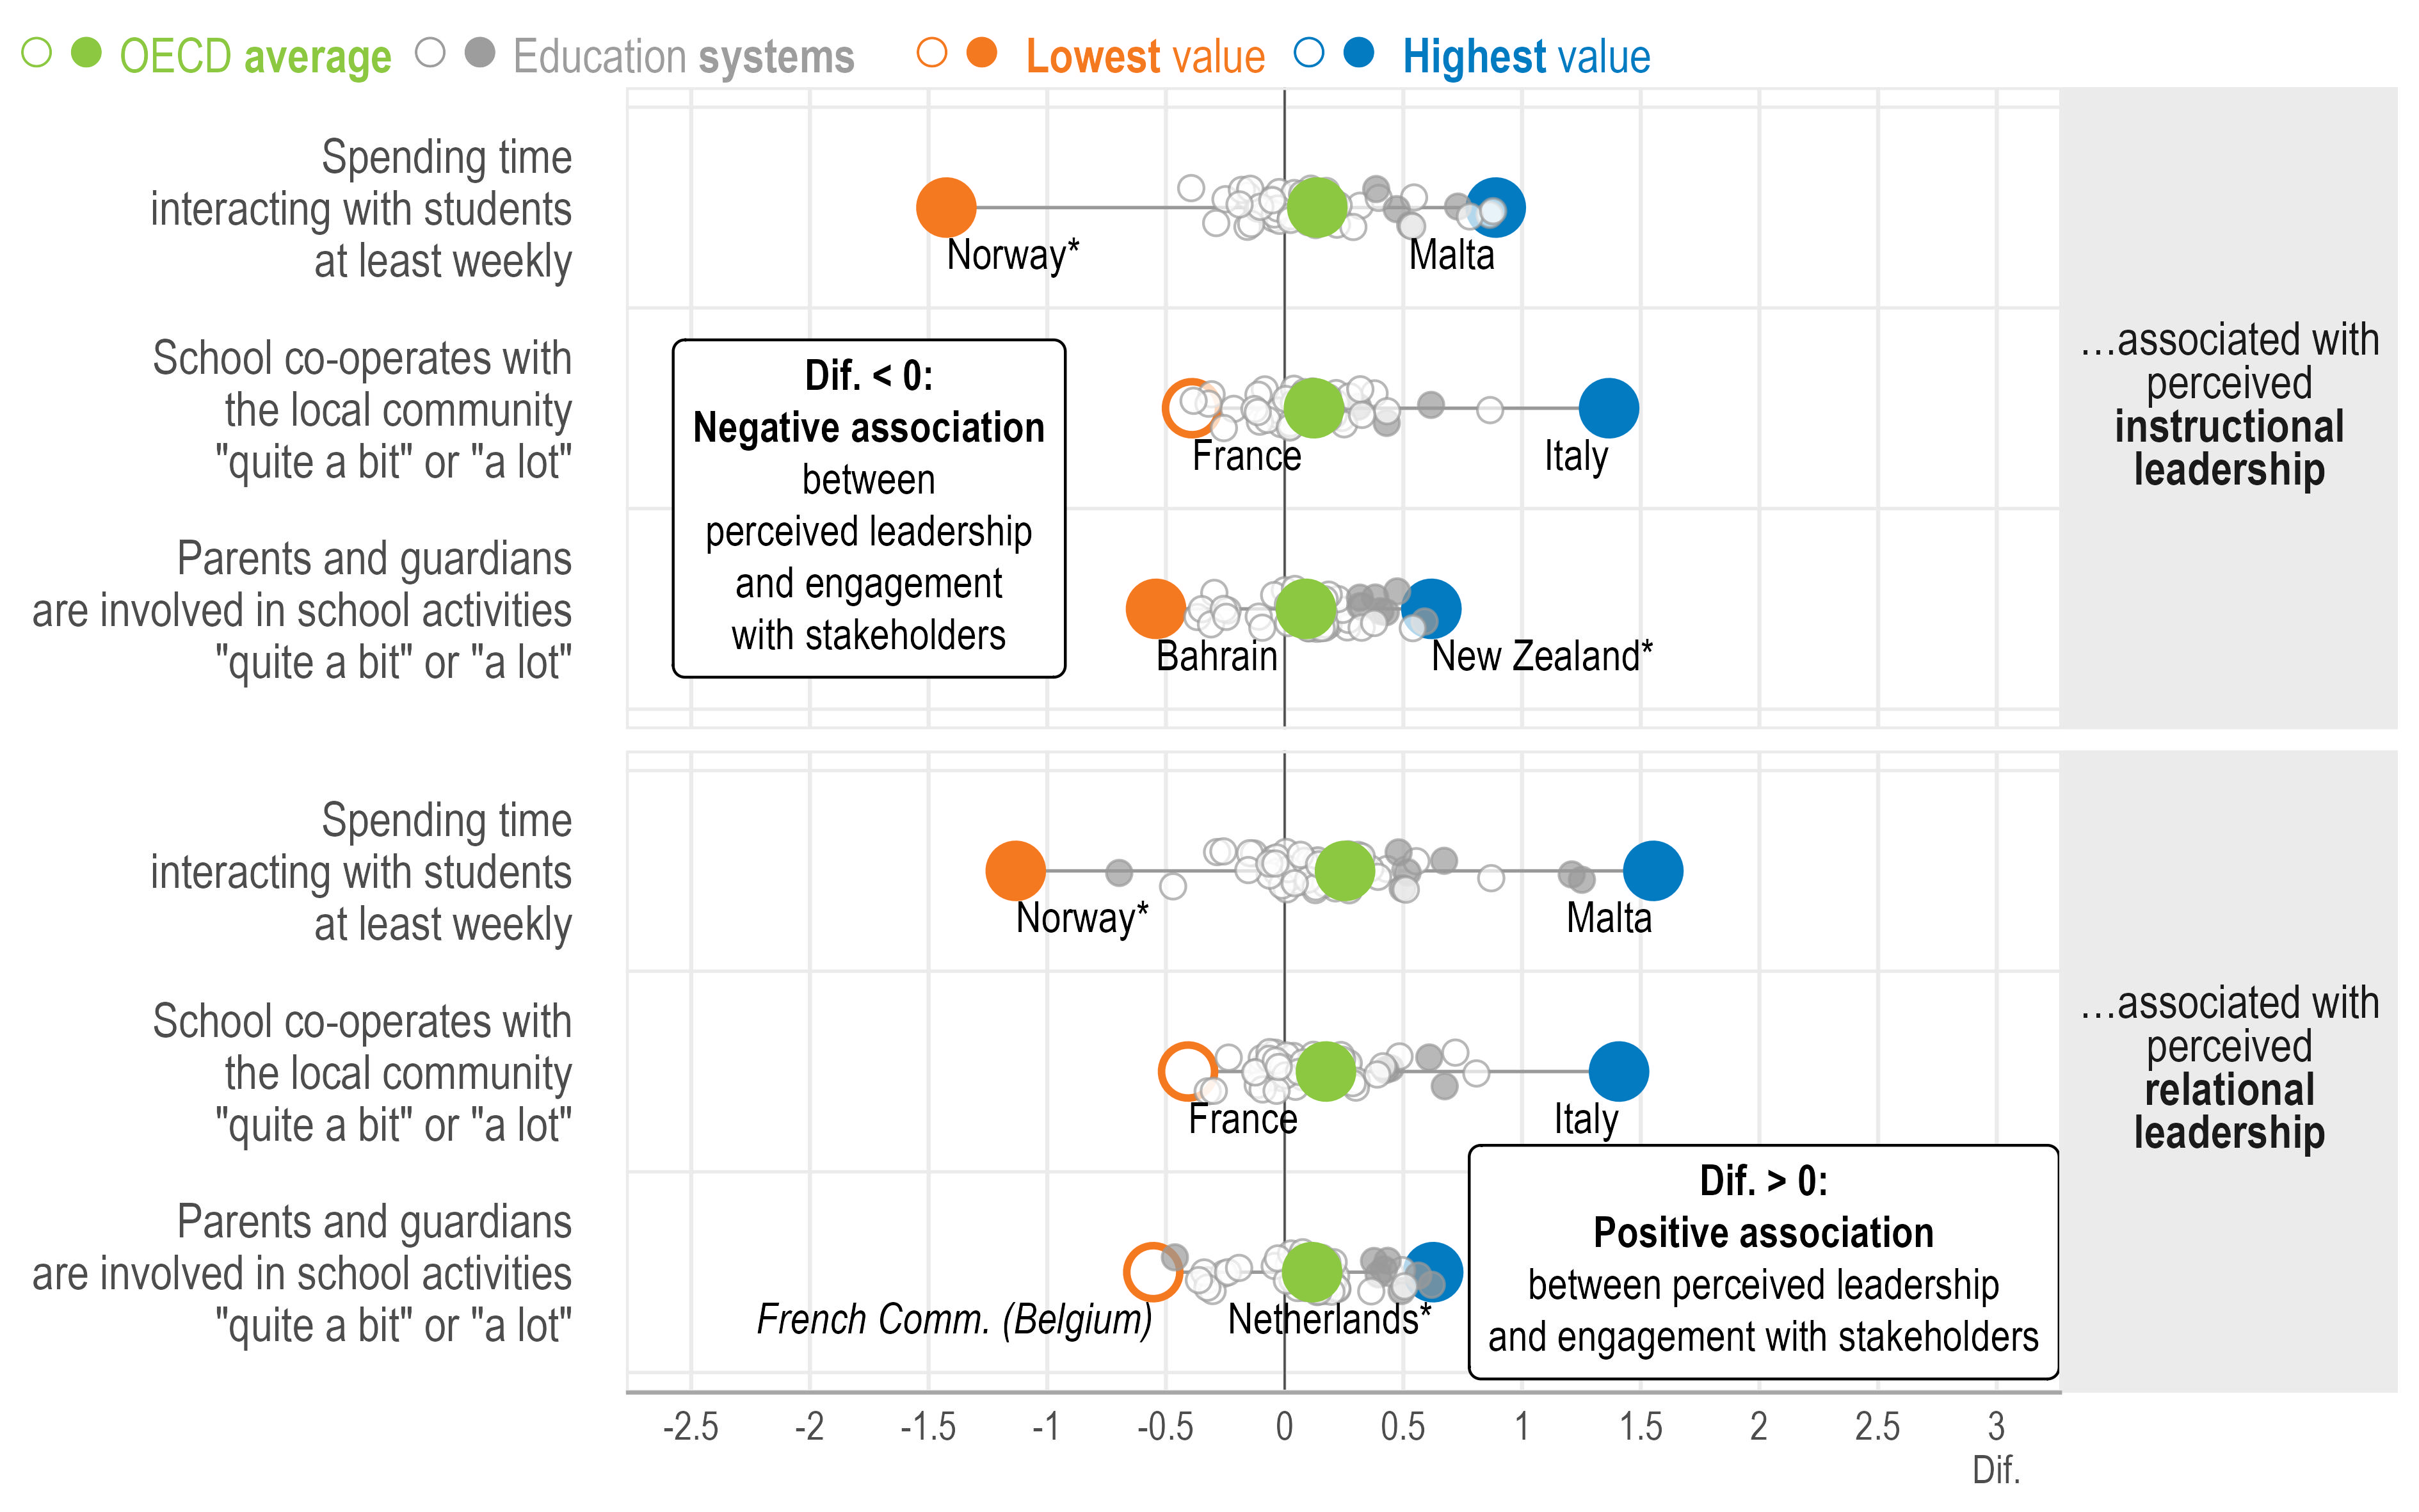
Change in the school-level average of lower secondary principals’ instructional and relational leadership scales1 associated with principals’ engagement with stakeholders2,3
Note: *Estimates should be interpreted with caution due to a higher risk of non-response bias.
Statistically significant coefficients are highlighted with filled circles (see Annex B). Filled circles above 0 indicate a positive association, while those below 0 reflect a negative relationship.
1. Standardised scale scores with a standard deviation of 2 and the value of 10 corresponding to the item mid-point value of the response scale. For more information on the scales, see Annex B.
2. Binary variables: the reference category for students refers to “monthly” or less; for parents and guardians, and the local community, it refers to “not at all” and “some extent”.
3. Results are based on school-level linear regression analyses controlling for principal characteristics (i.e. gender and age [standardised at the international level]) and school characteristics (i.e. school governance type, school size and school intake of students from socio-economically disadvantaged homes).
Source: OECD, TALIS 2024 Database, Tables 3.41, 3.44, 3.45, 3.49 and 3.50.
More frequent stakeholder engagement is not necessarily positive. Principals who spend considerable time with students may be responding to disciplinary or behavioural issues rather than fostering positive relationships. Similarly, frequent contact with parents may reflect conflict or concerns rather than effective collaboration. The frequency of stakeholder engagement should therefore not be interpreted as a direct measure of the quality or effectiveness of these interactions.
Still, TALIS 2024 results suggest that, on average, principals who actively engage with stakeholders are perceived more positively as instructional and relational leaders (Figure 3.11). Across education systems:
Interacting with students each week is positively associated with both forms of leadership in Japan, Malta, Serbia and Singapore (Table 3.41).
Involving parents and guardians in school activities is positively associated with both forms of leadership in Albania, Israel, Lithuania, Morocco, Shanghai (China) and the Slovak Republic (Tables 3.44 and 3.45).
Co-operating with the local community is positively associated with both forms of leadership in Chile, Croatia, Israel and Italy (Tables 3.49 and 3.50).
Within systems, principals also differ in terms of which stakeholders they engage with most actively, on average:
Women principals, principals with over 20 years of teaching experience and principals working in schools with over 30% of students with special education needs interact more frequently with students (Tables 3.42 and 3.43).
Principals with more than 10 years of experience, principals in privately managed schools and principals in schools with fewer disadvantaged students (10% or less), students with language difficulties (none), or students with special education needs (10% or less) tend to report stronger engagement with parents and guardians (Figure 3.12 and Table 3.46). These results are consistent with previous research. Principals in more disadvantaged, resource-constrained schools spend more time addressing a wider range of issues, limiting their capacity to engage with parents (Castro, 2023[31]). By contrast, parents in more affluent schools are more likely to expect principals to devote time to parent and student matters (Barr and Saltmarsh, 2014[32]).
Younger principals (under age 40) and principals in rural, smaller and publicly managed schools co-operate more closely with the local community (Tables 3.51 and 3.52).
Between 2018 and 2024, the share of principals reporting that parents or guardians are involved in school activities “quite a bit” or “a lot” fell by 4 percentage points on average, with declines exceeding 25 percentage points in Colombia, France and Portugal (Table 3.48). These education systems also recorded some of the largest decreases in students’ perceptions of family support between 2022 and 2025 (see Table I.B1.4.122 in PISA 2025 Results (Volume I) (OECD, 2026[23])). However, there is no clear relationship across education systems between parental engagement in school activities and students’ perceptions of family support. This suggests that, while teachers value parents’ participation in school activities, it is distinct from the day-to-day family support that is consistently associated with higher science performance and more positive attitudes towards learning (OECD, 2026[23]).
Over the same period, the share of principals reporting that their schools co-operate with the local community “quite a bit” or “a lot” also decreased by 4 percentage points (Table 3.53). In New Zealand* and Türkiye, the share of principals reporting strong co-operation with the local community declined by around 25 percentage points.
Percentage-point difference in the share of lower secondary principals who report that parents or guardians are involved in school activities "quite a bit" or "a lot"
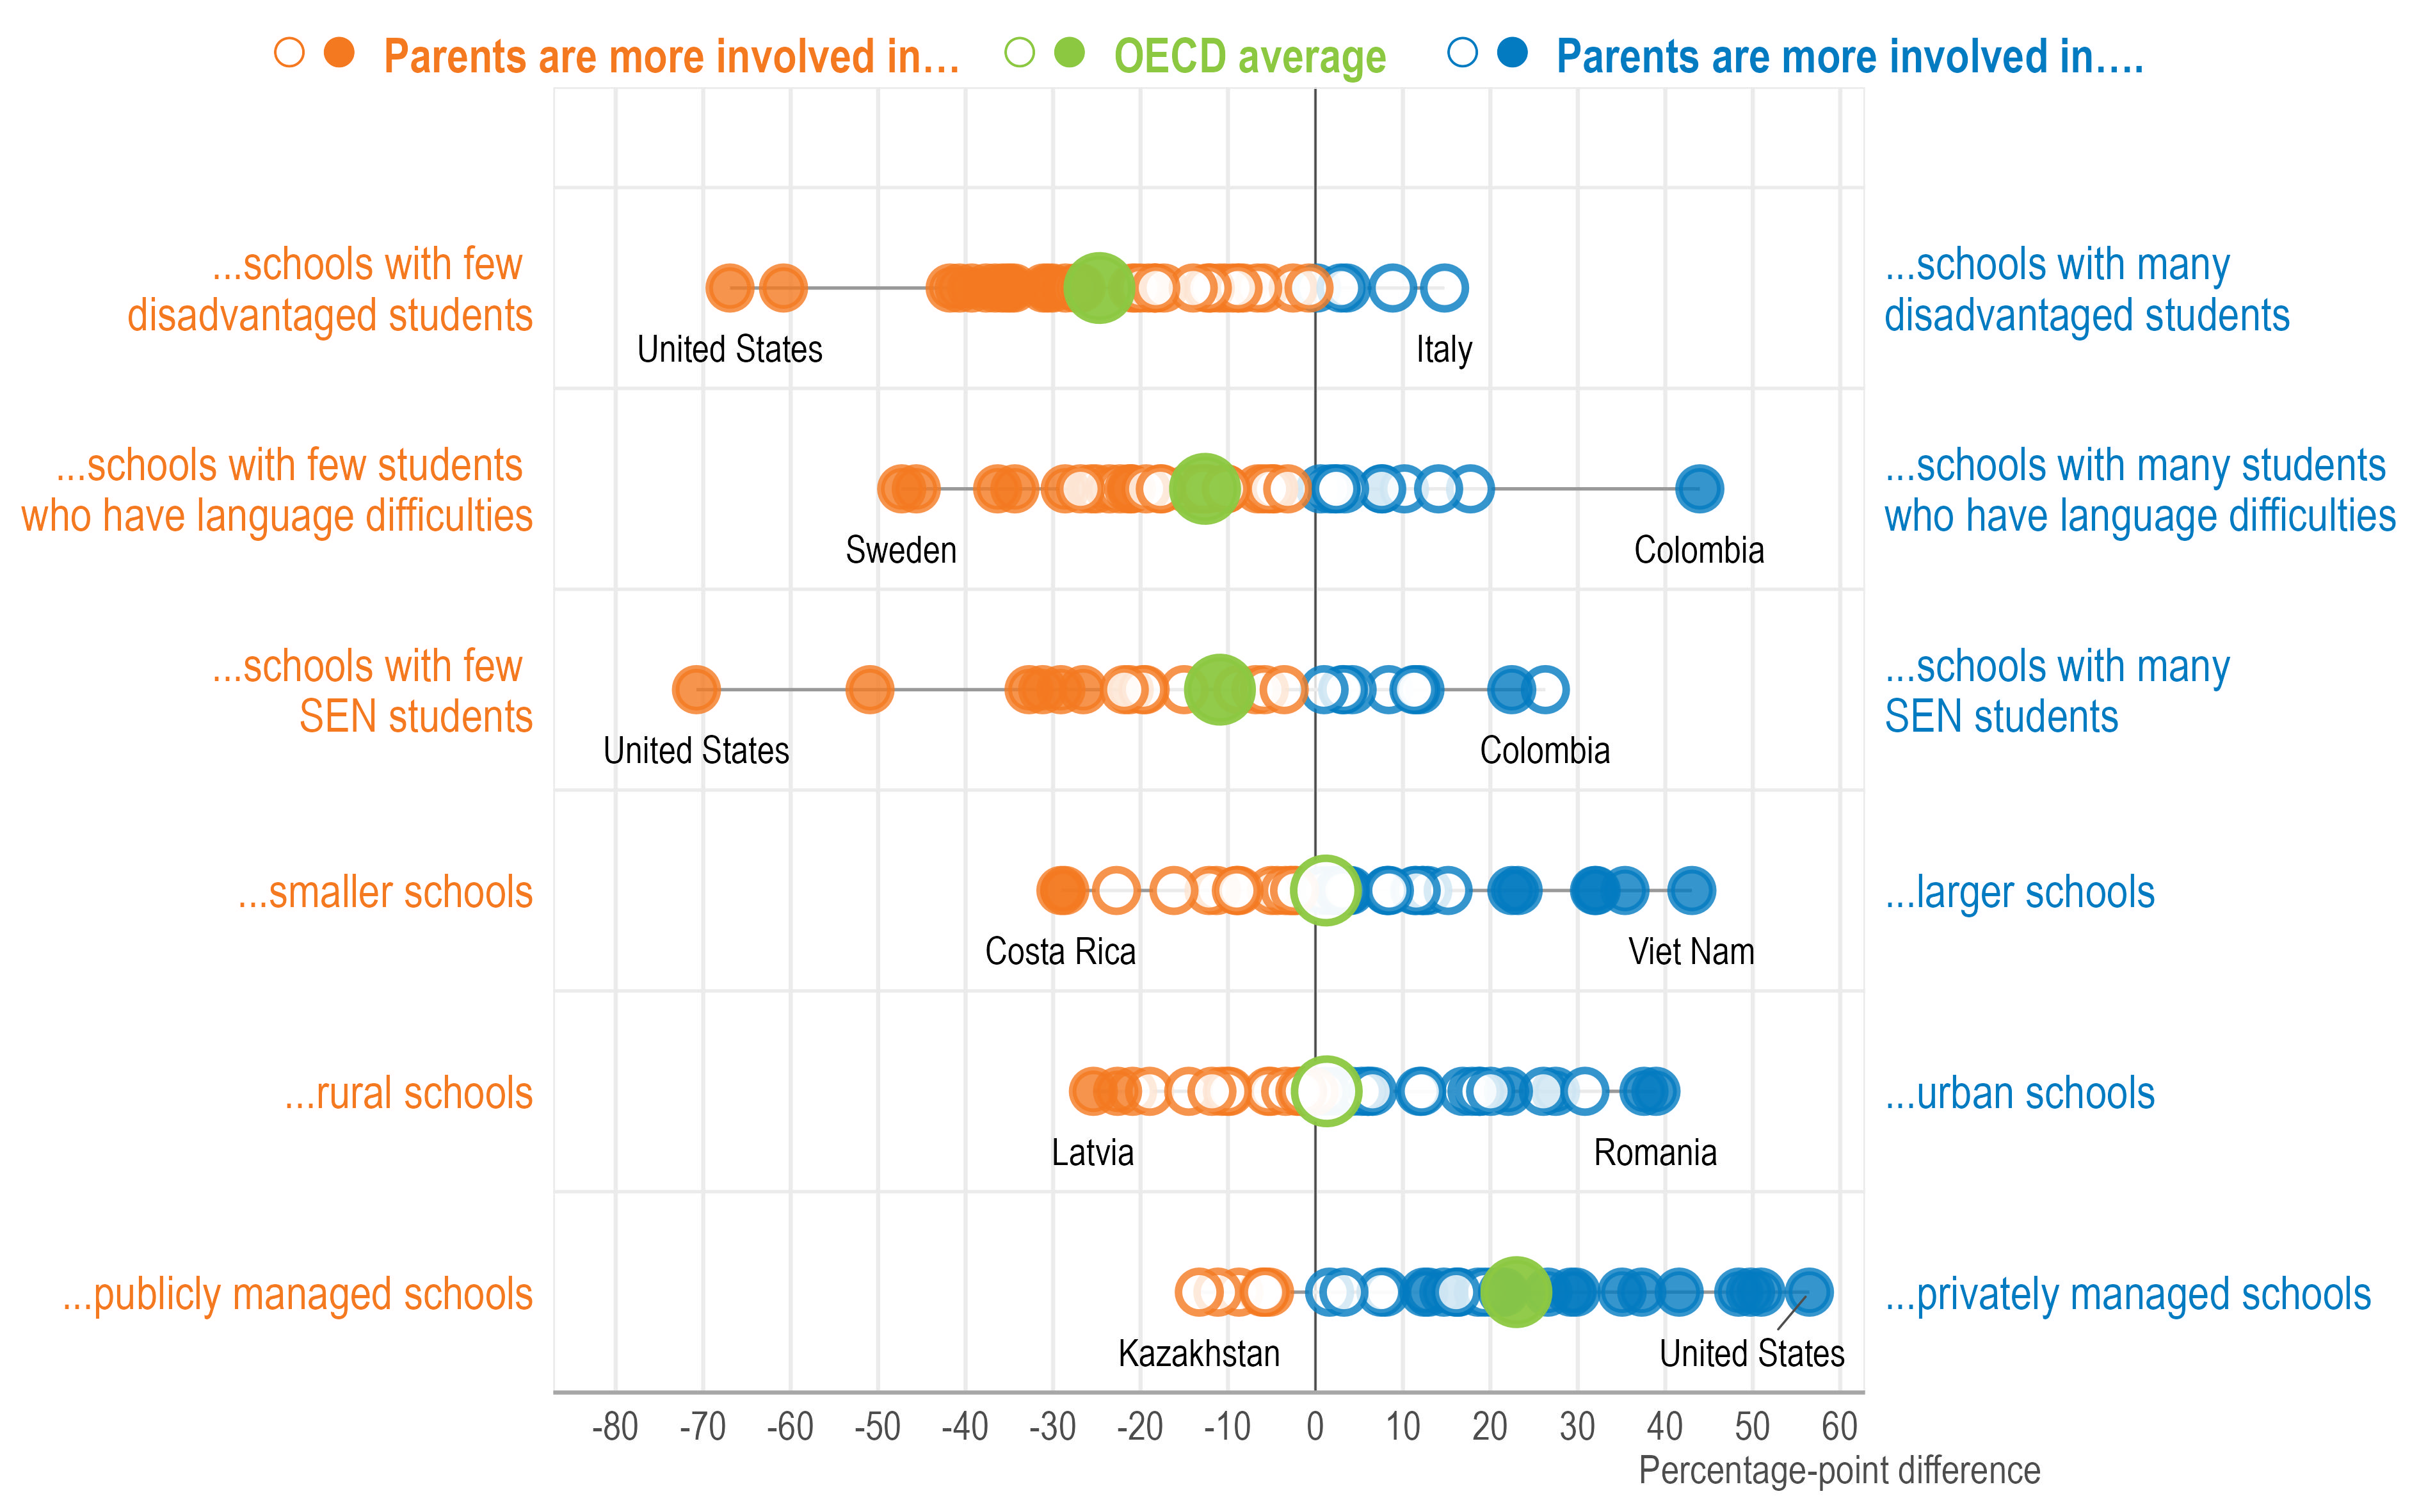
Note: Statistically significant differences are highlighted with filled circles (see Annex B).
A rural school is located in a rural area or village of up to 3 000 people; an urban school is located in a city of over 100 000 people.
A publicly managed school is a school that is managed by a public education authority, government agency, municipality, or governing board appointed by the government or elected by public franchise. A publicly managed school may not necessarily be publicly funded.
Smaller schools have fewer than 250 enrolled students. Larger schools have 750 students or more.
Schools with many disadvantaged students have at least 30% of students from socio-economically disadvantaged homes, while schools with few disadvantaged students have fewer than 10% of students from such homes. Socio-economically disadvantaged homes are those that lack the basic necessities or advantages of life, such as adequate housing, nutrition or medical care.
Schools with many SEN students have at least 30% of students with special education needs, while schools with few SEN students have fewer than 10%. Students with special education needs are those for whom a special education need has been formally identified because they are mentally, physically or emotionally disadvantaged.
Schools where many students have language difficulties have at least 10% of students who have difficulty understanding the language(s) of instruction, while schools where few students have language difficulties have no students who have difficulty understanding the language(s) of instruction.
Source: OECD, TALIS 2024 Database, Table 3.47.
Principals in upper secondary education are more valued when they report:
focusing on curriculum and instructional tasks, such as classroom observations and teacher feedback, and taking action to improve students’ social emotional development (Tables 3.1, 3.2, 3.5 and 3.6);
supporting teacher leadership (Table 3.14);
appraising teachers at least once a year and using school- and classroom-based results in formal teacher appraisal (Tables 3.18, 3.19, 3.23 and 3.24);
providing parents and guardians with information on the school and student performance on a regular basis (Tables 3.44 and 3.45);
having active co-operation with the local community (Tables 3.49 and 3.50).
How widespread these practices are among upper secondary school principals can differ from that observed among principals in lower secondary education. It can also vary across upper secondary school principals depending on school and principal characteristics. For example, there are differences with respect to:
Collaborative decision making: On average, upper secondary principals are less likely than lower secondary principals to open up opportunities for parents and guardians to actively participate in school decision making. At the same time, they are more likely to provide such opportunities to students (Table 3.36). Between 2018 and 2024, Slovenia saw an 8 percentage-point decrease, from 97% to 89%, in the share of upper secondary principals providing opportunities to parents and guardians, although this share remains at a high level. Over the same period, the United Arab Emirates saw an increase of 5 percentage points, from 91% to 97% (Table 3.40).
Teacher appraisal: Between 2018 and 2024, the share of upper secondary principals using school- and classroom-based results in formal appraisal decreased by 23 percentage points in Slovenia, while it increased by 12 percentage points in the United Arab Emirates (Table 3.22). In terms of follow-up after formal appraisal, the share of principals who appointed mentors to help teachers improve their teaching increased by at least 11 percentage points in Croatia, Denmark, Slovenia, Türkiye and the United Arab Emirates, while it remained stable in Portugal, the only other education system with comparable data from both cycles (Table 3.27).
Interactions with parents and guardians: Compared to lower secondary education, 11 percentage points fewer upper secondary principals reported that parents and guardians were involved in school activities (Table 3.46). This likely reflects organisational differences between education levels. As students grow older, school interactions with families lessen and are more mediated through students themselves (Campbell, 2011).
Principals from schools with a smaller share of socio-economically disadvantaged students (10% or less) and no students with difficulties understanding the language(s) of instruction are more likely to report such involvement than those from schools with a larger share of socio-economically disadvantaged students (over 30%) or students with language difficulties (over 10%) (Table 3.47). Between 2018 and 2024, the share of principals reporting parental involvement in school activities decreased by 23 percentage points in Portugal and 14 percentage points in Denmark, while the United Arab Emirates experienced an increase of 28 percentage points (Table 3.48).
Note: *Estimates should be interpreted with caution due to a higher risk of non-response bias.
References
[21] Avvisati, F. et al. (2014), “Getting parents involved: A field experiment in deprived schools”, Review of Economic Studies, Vol. 81/1, pp. 57-83, https://doi.org/10.1093/restud/rdt027.
[32] Barr, J. and S. Saltmarsh (2014), ““It all comes down to the leadership”: The role of the school principal in fostering parent-school engagement”, Educational Management Administration and Leadership, Vol. 42/4, pp. 491-505, https://doi.org/10.1177/1741143213502189.
[31] Castro, A. (2023), “Managing Competing Demands in a Teacher Shortage Context: The Impact of Teacher Shortages on Principal Leadership Practices”, Educational Administration Quarterly, Vol. 59/1, pp. 218-250, https://doi.org/10.1177/0013161X221140849.
[3] Darling-Hammond, L. et al. (2026), “The principal effect: How investing in school leaders is key to solving education’s challenges”, https://doi.org/10.54300/644.197.
[1] Darling-Hammond, L. et al. (2022), “Developing effective principals: What kind of learning matters?”, https://doi.org/10.54300/641.201.
[25] European School Education Platform (2026), Parents’ involvement in school governance, https://school-education.ec.europa.eu/en/discover/school-success-for-all/42-parents-involvement-school-governance (accessed on 15 May 2026).
[22] Geijsel, F., P. Sleegers and R. Van Den Berg (1999), “Transformational leadership and the implementation of large-scale innovation programs”, Journal of Educational Administration, Vol. 37/4, pp. 309-328, https://doi.org/10.1108/09578239910285561.
[19] Goe, L., K. Biggers and A. Croft (2012), Linking Teacher Evaluation to Professional Development: Focusing on Improving Teaching and Learning, https://files.eric.ed.gov/fulltext/ED532775.pdf.
[24] Gottschalk, F. and H. Borhan (2023), “Child participation in decision making: Implications for education and beyond”, OECD Education Working Papers, No. 301, OECD Publishing, Paris, https://doi.org/10.1787/a37eba6c-en.
[5] Grissom, J., A. Egalite and C. Lindsay (2021), “How Principals Affect Students and Schools: A Systematic Synthesis of Two Decades of Research”, https://doi.org/10.59656/EL-SB1065.001.
[6] Hallinger, P., L. Dongyu and W. Wang (2016), “Gender Differences in Instructional Leadership: A Meta-Analytic Review of Studies Using the Principal Instructional Management Rating Scale”, Educational Administration Quarterly, Vol. 52/4, pp. 567-601, https://doi.org/10.1177/0013161X16638430.
[29] Hedlin, M. and E. Frank (2022), ““They Want a Reply Immediately!” Teachers’ Perceptions about Contact between Home and School.”, Journal of Teacher Education and Educators, Vol. 11/2, pp. 271-289, https://files.eric.ed.gov/fulltext/EJ1360199.pdf (accessed on 21 July 2026).
[26] Jafarov, J. (2015), “Factors Affecting Parental Involvement in Education: The Analysis of Literature”, Khazar Journal of Humanities and Social Sciences, Vol. 18/4, pp. 35-44, https://doi.org/10.5782/2223-2621.2015.18.4.35.
[16] Kraft, M. and J. Papay (2014), “Can professional environments in schools promote teacher development? Explaining heterogeneity in returns to teaching experience”, Educational Evaluation and Policy Analysis, Vol. 36/4, pp. 476-500, https://doi.org/10.3102/0162373713519496.
[30] Kristoffersson, M., L. Gu and Y. Zhang (2013), “Home-School Collaboration in Sweden and China.”, Online Submission, Vol. 3/3, pp. 188-201, https://files.eric.ed.gov/fulltext/ED541823.pdf (accessed on 21 July 2026).
[4] Leithwood, K., A. Harris and D. Hopkins (2008), “Seven strong claims about successful school leadership”, School Leadership and Management, Vol. 28/1, pp. 27-42, https://doi.org/10.1080/13632430701800060.
[12] Li, L. and Y. Liu (2022), “An integrated model of principal transformational leadership and teacher leadership that is related to teacher self-efficacy and student academic performance”, Asia Pacific Journal of Education, Vol. 42/4, pp. 661-678, https://doi.org/10.1080/02188791.2020.1806036.
[23] OECD (2026), PISA 2025 Results (Volume I): Future-Ready Students, PISA, OECD Publishing, Paris, https://doi.org/10.1787/73451bc5-en.
[17] OECD (2025), Results from TALIS 2024: The State of Teaching, TALIS, OECD Publishing, Paris, https://doi.org/10.1787/90df6235-en.
[11] OECD (2025), Teaching and Learning International Survey (TALIS) 2024 Conceptual Framework, OECD Publishing, Paris, https://doi.org/10.1787/7b8f85d4-en.
[9] OECD (2020), TALIS 2018 Results (Volume II): Teachers and School Leaders as Valued Professionals, TALIS, OECD Publishing, Paris, https://doi.org/10.1787/19cf08df-en.
[18] OECD (2013), Synergies for Better Learning: An International Perspective on Evaluation and Assessment, OECD Reviews of Evaluation and Assessment in Education, OECD Publishing, Paris, https://doi.org/10.1787/9789264190658-en.
[15] Öqvist, A. and M. Malmström (2018), “What motivates students? A study on the effects of teacher leadership and students’ self-efficacy”, International Journal of Leadership in Education, Vol. 21/2, pp. 155-175, https://doi.org/10.1080/13603124.2017.1355480.
[7] Orphanos, S. and M. Orr (2014), “Learning leadership matters: The influence of innovative school leadership preparation on teachers’ experiences and outcomes”, Educational Management Administration & Leadership, Vol. 42/5, pp. 680-700, https://doi.org/10.1177/1741143213502187.
[8] Orr, M. and S. Orphanos (2011), “How Graduate-level preparation influences the effectiveness of school leaders: A comparison of the outcomes of exemplary and conventional leadership preparation programs for principals”, Educational Administration Quarterly, Vol. 47/1, pp. 18-70, https://doi.org/10.1177/0011000010378610.
[2] Pont, B., D. Nusche and H. Moorman (2008), Improving School Leadership, Volume 1: Policy and Practice, OECD Publishing, Paris, https://doi.org/10.1787/9789264044715-en.
[20] Quenette, A. and N. Rybas (2023), “Evaluating instructor quality: Moving away from student evaluations to peer review”, New Directions for Teaching and Learning, Vol. 2023/173, pp. 67-74, https://doi.org/10.1002/TL.20535.
[10] Sartain, L., S. Stoelinga and E. Brown (2011), Rethinking Teacher Evaluation in Chicago Lessons Learned from Classroom Observations, Principal-Teacher Conferences, and District Implementation, https://consortium.uchicago.edu/publications/rethinking-teacher-evaluation-chicago-lessons-learned-classroom-observations-principal.
[27] Schleicher, A. (2018), Valuing our Teachers and Raising their Status: How Communities Can Help, International Summit on the Teaching Profession, OECD Publishing, Paris, https://doi.org/10.1787/9789264292697-en.
[13] Schott, C., H. van Roekel and L. Tummers (2020), “Teacher leadership: A systematic review, methodological quality assessment and conceptual framework”, Educational Research Review, Vol. 31, p. 100352, https://doi.org/10.1016/J.EDUREV.2020.100352.
[28] UNESCO (2024), Italy - School leadership, Education Profiles, Global Education Monitoring Report 2024/5, https://education-profiles.org/europe-and-northern-america/italy/~school-leadership.
[14] Vranješević, J. and D. Frost (2016), “Stories From Intercultural Education in Serbia: Teacher Leadership and Parent Participation”, European Education, Vol. 48/1, pp. 63-78, https://doi.org/10.1080/10564934.2016.1153932.
← 1. This report defines valued leadership based on teachers’ views about their principals’ instructional and relational leadership. The conceptualisation of valued leadership is guided by the Teaching and Learning International Survey (TALIS) 2024 Conceptual Framework (OECD, 2025[17]), which identifies instructional and relational leadership as key domains of school leadership. To note, TALIS does not survey teachers about their views on other important aspects of principals’ leadership, such as managerial leadership. Moreover, the instructional and relational leadership scales, which are based on teachers’ perceptions, may partly reflect principals’ popularity rather than leadership quality. Principals who make difficult but necessary decisions may consequently be viewed less favourably, even when their leadership is highly effective.
← 2. The instructional leadership scale (T4ISNTLE) summarises teachers’ responses to three four-point agreement items (“strongly disagree”; “disagree”; “agree”; “strongly agree”) about their school principal. The scale is constructed using latent variable modelling within a confirmatory factor analysis (CFA) framework and is based on the following items: “The principal encourages co-operation among teachers to develop new teaching practices”; “The principal ensures that teachers take responsibility for improving their teaching skills”; “The principal ensures that teachers feel responsible for their students’ learning outcomes”. Standardised scale scores with a standard deviation of 2 and the value of 10 corresponding to the item mid-point value of the response scale.
← 3. The relational leadership scale (T4RELEAD) summarises teachers’ responses to four four-point agreement items (“strongly disagree”; “disagree”; “agree”; “strongly agree”) about their school principal. The scale is constructed using latent variable modelling within a CFA framework and is based on the following items: “The principal has a clear vision for this school”; “The principal encourages all staff to have a say on important decisions”; “The principal has good professional relationships with staff”; “The principal has good professional relationships with parents or guardians”. Standardised scale scores with a standard deviation of 2 and the value of 10 corresponding to the item mid-point value of the response scale.
← 4. Descriptive statistics for the control variables can be found in the online TALIS 2024 Statistical Compendium.
← 5. Coefficients for the OECD and TALIS averages may be statistically significant even when country-level coefficients are statistically significant in only a small number of participating education systems. As such, these average results may not reflect a consistent pattern across education systems.
← 6. While the prevalence of classroom observation has increased in Latvia and Spain, the statistical association between classroom observation and instructional or relational leadership is not statistically significant for either country.