This chapter looks at principals' working conditions, specifically their professional learning, the material resources that are available to their schools, and their salary and non-salary employment terms. It asks how these working conditions relate to valued leadership and job satisfaction. The chapter also explores how working conditions differ across education systems, vary in terms of principal and school characteristics and have changed over time.
The Value of School Principals in TALIS 2024

Abstract
There is a positive association between instructional leadership and principals’ participation in two specific forms of continuous professional learning: self-initiated in-person learning and online training in the use of digital tools for teaching. The fact that delivery mode matters suggest that face-to-face engagement may be particularly important for developing leadership practices, while digital skill development is well-suited to online formats.
The share of principals engaging in continued professional learning varies widely across systems, from less than 30% of principals in France and Sweden to over 90% in Kazakhstan, Shanghai (China) and Viet Nam for digital training. For self-initiated learning, participation ranges from half of principals (50%) in Türkiye to nearly universal participation (98%) in Iceland, Poland and Shanghai (China).
Principals are more satisfied with their jobs when they face fewer material resource constraints. Shortages or inadequacies of instructional space and physical infrastructure are the most reported issue, affecting around one-quarter of principals, on average.
Material resource constraints are more prevalent in publicly managed schools and in schools serving a larger proportion of disadvantaged students (over 30%).
The share of principals reporting such shortages has fallen for most resource areas since 2018, with digital resources and tools showing the largest decline (-9 percentage points, on average).
Principals who are satisfied with their salaries and non-salary employment terms report higher overall job satisfaction.
Around half of principals are satisfied with their salary, on average. Satisfaction is not related to the principal-to-teacher salary ratio, suggesting that once pay reaches a certain threshold, perceptions are shaped more by factors such as the cost of living, pay structures and workload.
Between 2018 and 2024, salary satisfaction increased in many systems. The largest gains were in Lithuania (55 percentage point-increase), Bulgaria (+30 percentage points), New Zealand* (+27 percentage points) and Italy (+25 percentage points).
Around two-thirds of principals are satisfied with their non-salary employment terms, on average, ranging from below 35% in Portugal, France and the French Community of Belgium to over 90% in Colombia and the United States.
Satisfaction with salary and non-salary employment terms is higher among older (age 60 or above) and more experienced (more than 10 years) principals, and among principals in privately managed schools.
* For countries highlighted with an asterisk (*), estimates should be interpreted with caution due to a higher risk of non-response bias. See the Reader's Guide and Annex A for more detail.
Valued leadership1 depends not only on what principals do, but also on working conditions that enable them to have an impact. Supporting working conditions are associated with lower principal turnover and greater leadership stability (Darling-Hammond et al., 2026[1]). This stability is, in turn, associated with better school climates, higher teacher retention and improved student outcomes (Darling-Hammond et al., 2026[1]).
Guided by the Job Demands–Resources (JD-R) model (Bakker and Demerouti, 2007[2]), which distinguishes between job demands that consume energy and positive resources that buffer their effects, this chapter focuses on key working conditions that support principals across education systems participating in TALIS with available data (hereafter "education systems"): training, material resources and employment terms. Training, which is more directly linked to leadership practices, is examined in relation to valued leadership, both instructional2 and relational3 leadership. Other working conditions that shape principals' experiences, namely, school-level material resources shortages and principals’ terms of employment, are examined in relation to job satisfaction. The chapter also discusses how working conditions vary across and within education systems, and whether they have changed over time.
The relationships presented in this chapter are based on regression analyses, which examine how two variables are related, while taking other relevant factors into account that may influence the relationship. The regression models control for principal characteristics (i.e. gender and age) and school characteristics (i.e. school governance type, school size and school intake of students from socio-economically disadvantaged homes).4 The relationships discussed meet the following conditions:
coefficients for OECD and TALIS averages are statistically significant;5
at least two-thirds of participating education systems with available data have coefficients with the same sign as OECD and TALIS averages, regardless of statistical significance.
To note, the design of TALIS does not allow for the establishment of causal relationships. All regression analyses presented in this report should therefore be interpreted as identifying the presence (or absence) of statistical associations, i.e. whether or not variation in one variable is systematically associated with variation in another. However, they do not permit conclusions about causality; in other words, they cannot determine whether variation in one variable would cause a change in another, while holding all other factors constant.
Principals’ professional learning spans both pre-service preparation and continuous professional learning (CPL). It encompasses both formal and informal activities that broaden the skills, knowledge and expertise of in-service educators throughout their careers (Boeskens, Nusche and Yurita, 2020[3]). Research consistently highlights that high-quality and ongoing professional development, mentoring and coaching strengthens principal effectiveness, improves teacher retention and student outcomes, and supports principals' retention in the profession (Darling-Hammond et al., 2026[1]; Pont, Nusche and Moorman, 2008[4]).
Not all forms of training are equally associated with the leadership practices that teachers value. Regression analyses show that neither principals’ highest educational attainment (master’s or doctoral degrees) nor the content of their formal education is associated with being valued by teachers (Tables 4.1, 4.2, 4.3 and 4.4).
However, as shown in Chapter 3, principals whose formal education or training included instructional leadership are more likely to use instructional leadership practices, on average across OECD countries and territories with available data (hereafter, “on average”) (Table 3.7). While training may increase how much principals use these practices, their effectiveness depends on additional factors that training alone cannot provide, such as experience in the role, learning through practice in real school contexts, and the quality of relationships with teachers.
Continuous professional learning
TALIS captures principals’ CPL through several complementary questions. The first set of questions asks principals whether they participated in specific professional learning activities in the previous 12 months and, if so, whether they participated in person, virtually/online, or both. Principals are also asked about the topics of their learning. A final set of questions asks principals to indicate how much they currently need professional learning in different areas, rated on a four-point scale ranging from “no need at present” to “high level of need”.
Most principals participate in some form of professional learning. On average, participation is highest in self-initiated learning activities (80%), in courses, seminars or workshops on subject matter, teaching methods or pedagogy (79%), and in courses on leadership (78%) (Table 4.5). Formal qualification programmes, such as degree programmes, were the least common form of professional learning (22%).
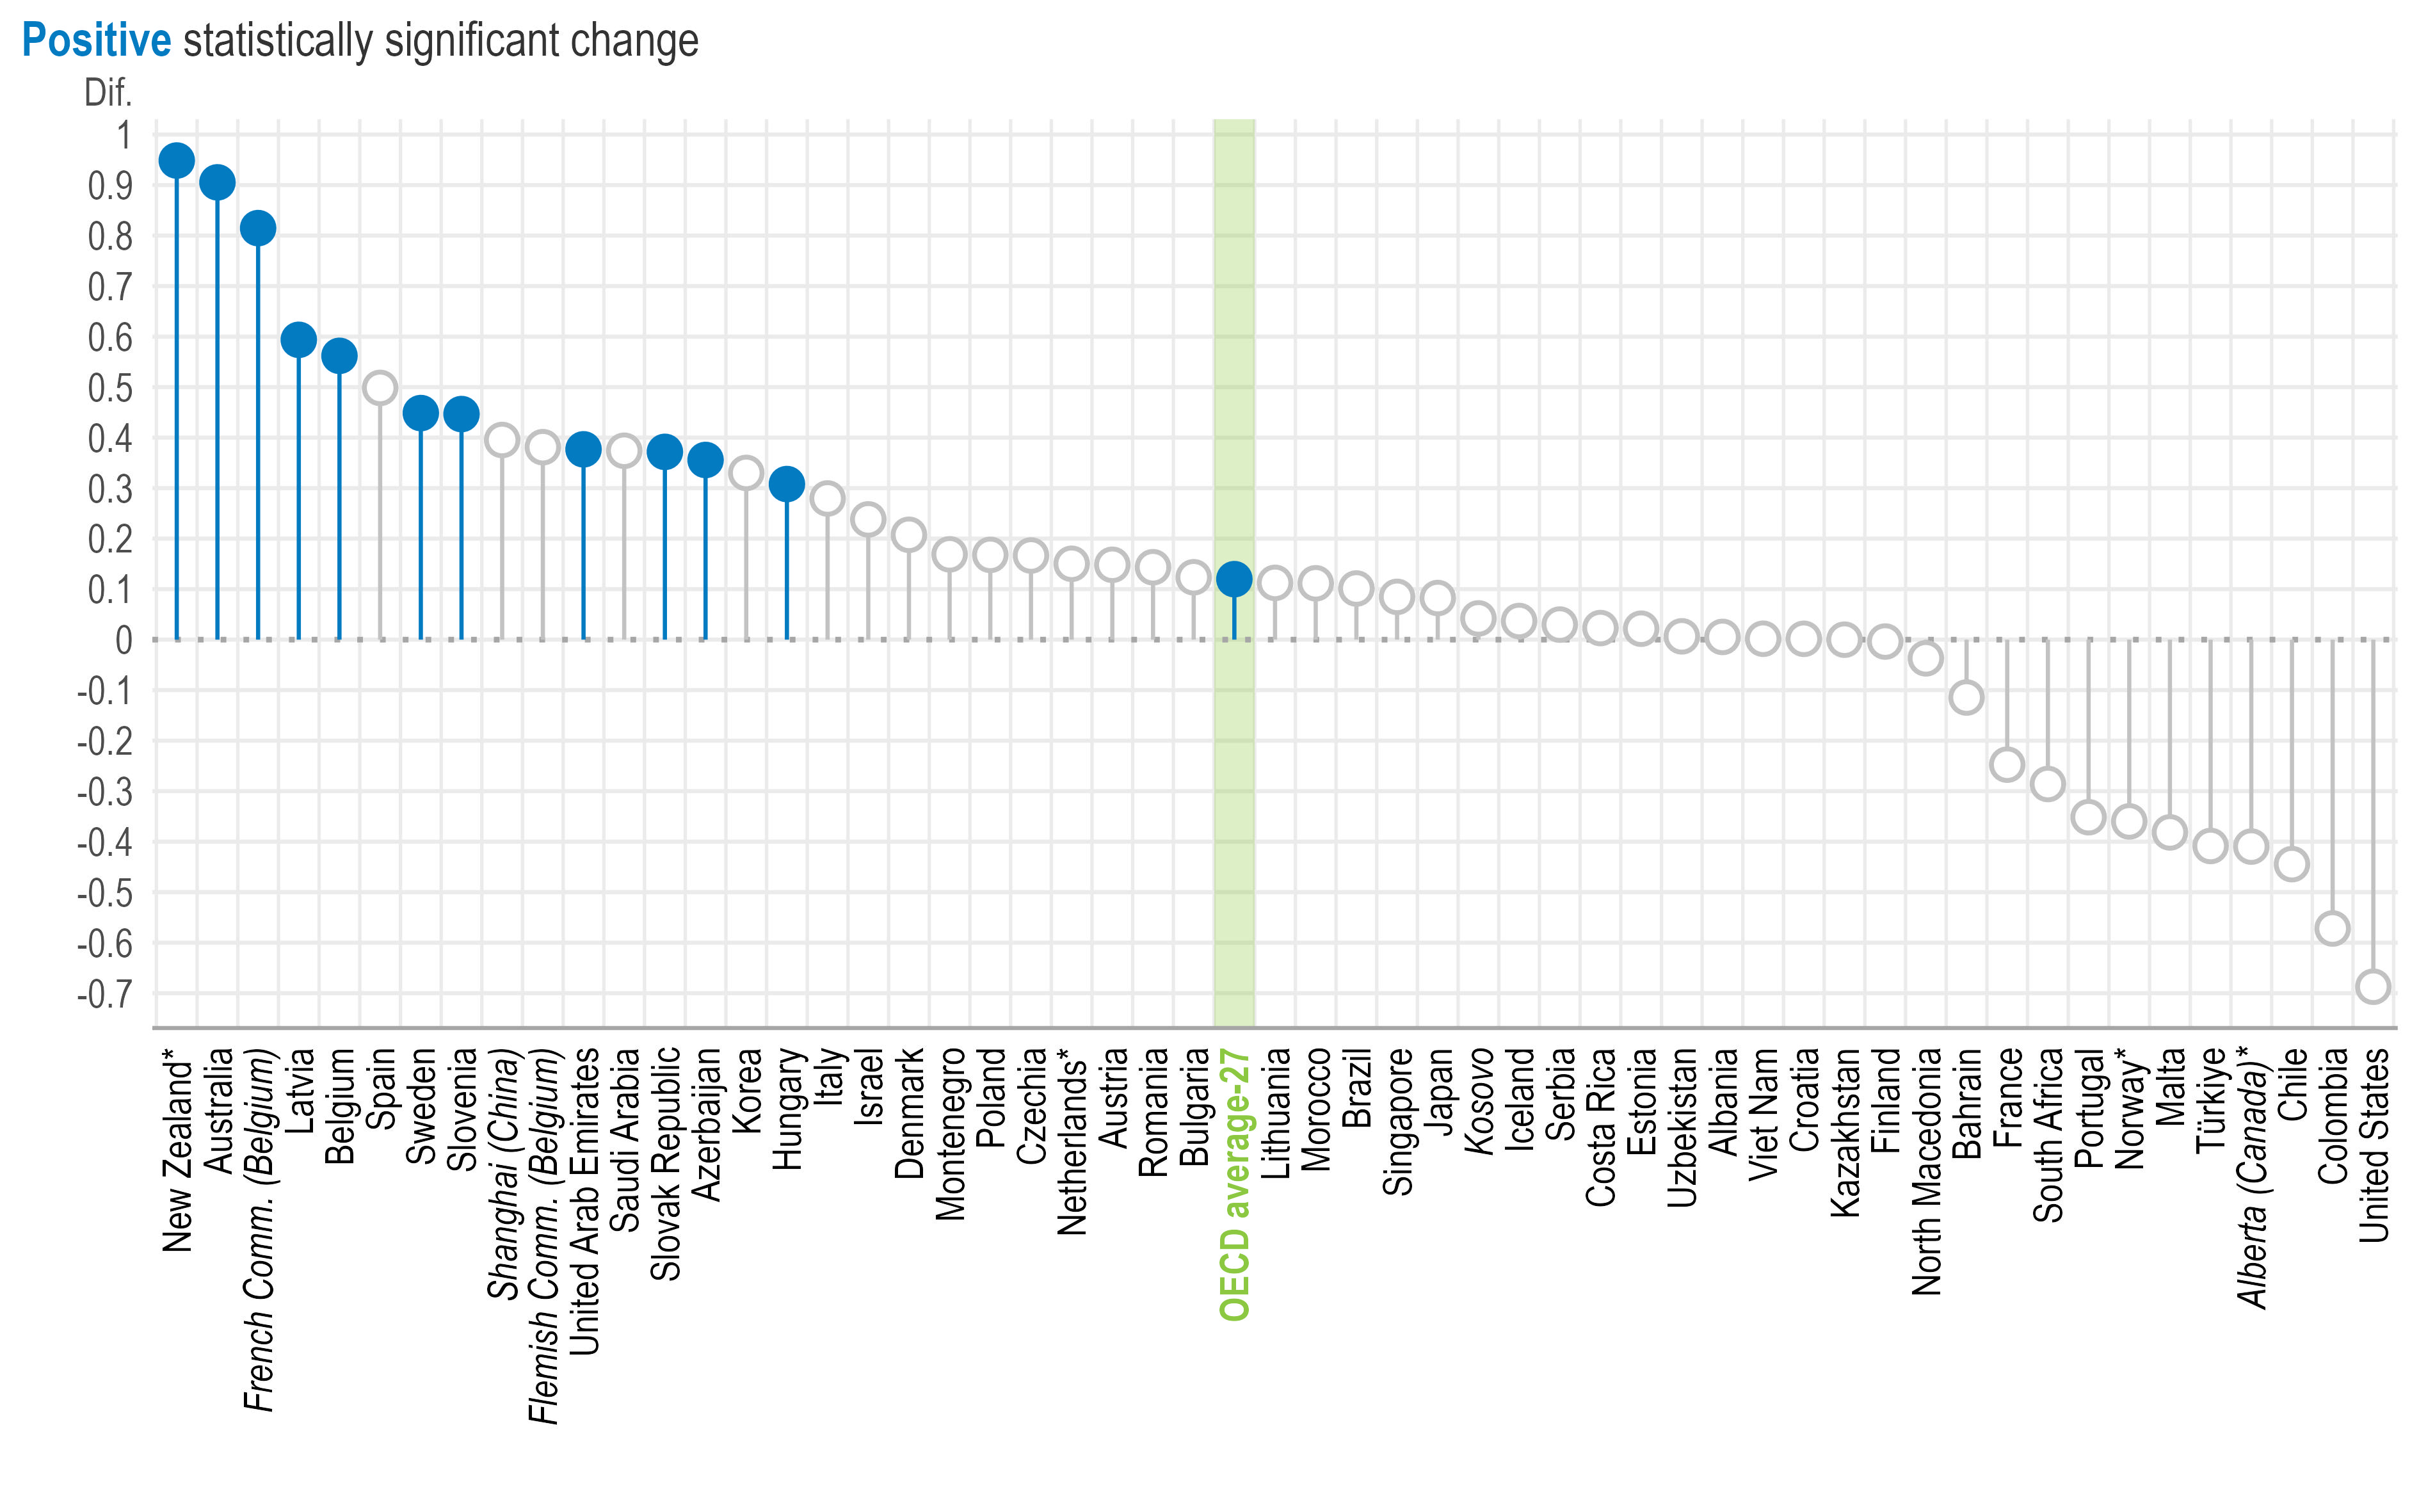
Note: *Estimates should be interpreted with caution due to a higher risk of non-response bias.
Statistically significant coefficients are highlighted with filled circles (see Annex B). Filled circles above 0 indicate a positive association, while those below 0 reflect a negative relationship.
1. Standardised scale scores with a standard deviation of 2 and the value of 10 corresponding to the item mid-point value of the response scale. For more information on the scales, see Annex B.
2. Results are based on school-level linear regression analysis controlling for principal characteristics (i.e. gender and age [standardised at the international level]) and school characteristics (i.e. school governance type, school size and school intake of students from socio-economically disadvantaged homes).
Source: OECD, TALIS 2024 Database, Table 4.15.
Among the different forms of CPL, two activities stand out as positively associated with instructional leadership: self-initiated learning activities (which may be interpreted differently across systems) and courses, seminars or workshops on developing strategies for the use of digital tools for teaching. However, the association depends on the mode of participation. Self-initiated learning activities are associated with instructional leadership only when undertaken in person (Table 4.14). This suggests that face-to-face engagement, observation, coaching and exchange with colleagues may be particularly conducive to developing the leadership practices that teachers value in their principals. By contrast, participation in training on digital strategies is associated with instructional leadership only when delivered virtually (Figure 4.1). This may reflect the suitability of online learning for digital skills development and that principals who engage with digital learning may be better positioned to support the use of technology in teaching.
Participation varies considerably across education systems in the two professional learning activities that are positively associated with instructional leadership. For digital training, participation ranges from less than 30% of principals in France and Sweden to more than 90% in Kazakhstan, Shanghai (China) and Viet Nam (Figure 4.2). Similar variation is observed for self-initiated learning activities, ranging from 50% in Türkiye to nearly universal participation (98%) in Iceland, Poland and Shanghai (China) (Table 4.5).
Percentage of lower secondary principals who participated (in the 12 months prior to the survey) in training on developing strategies for the use of digital tools for teaching
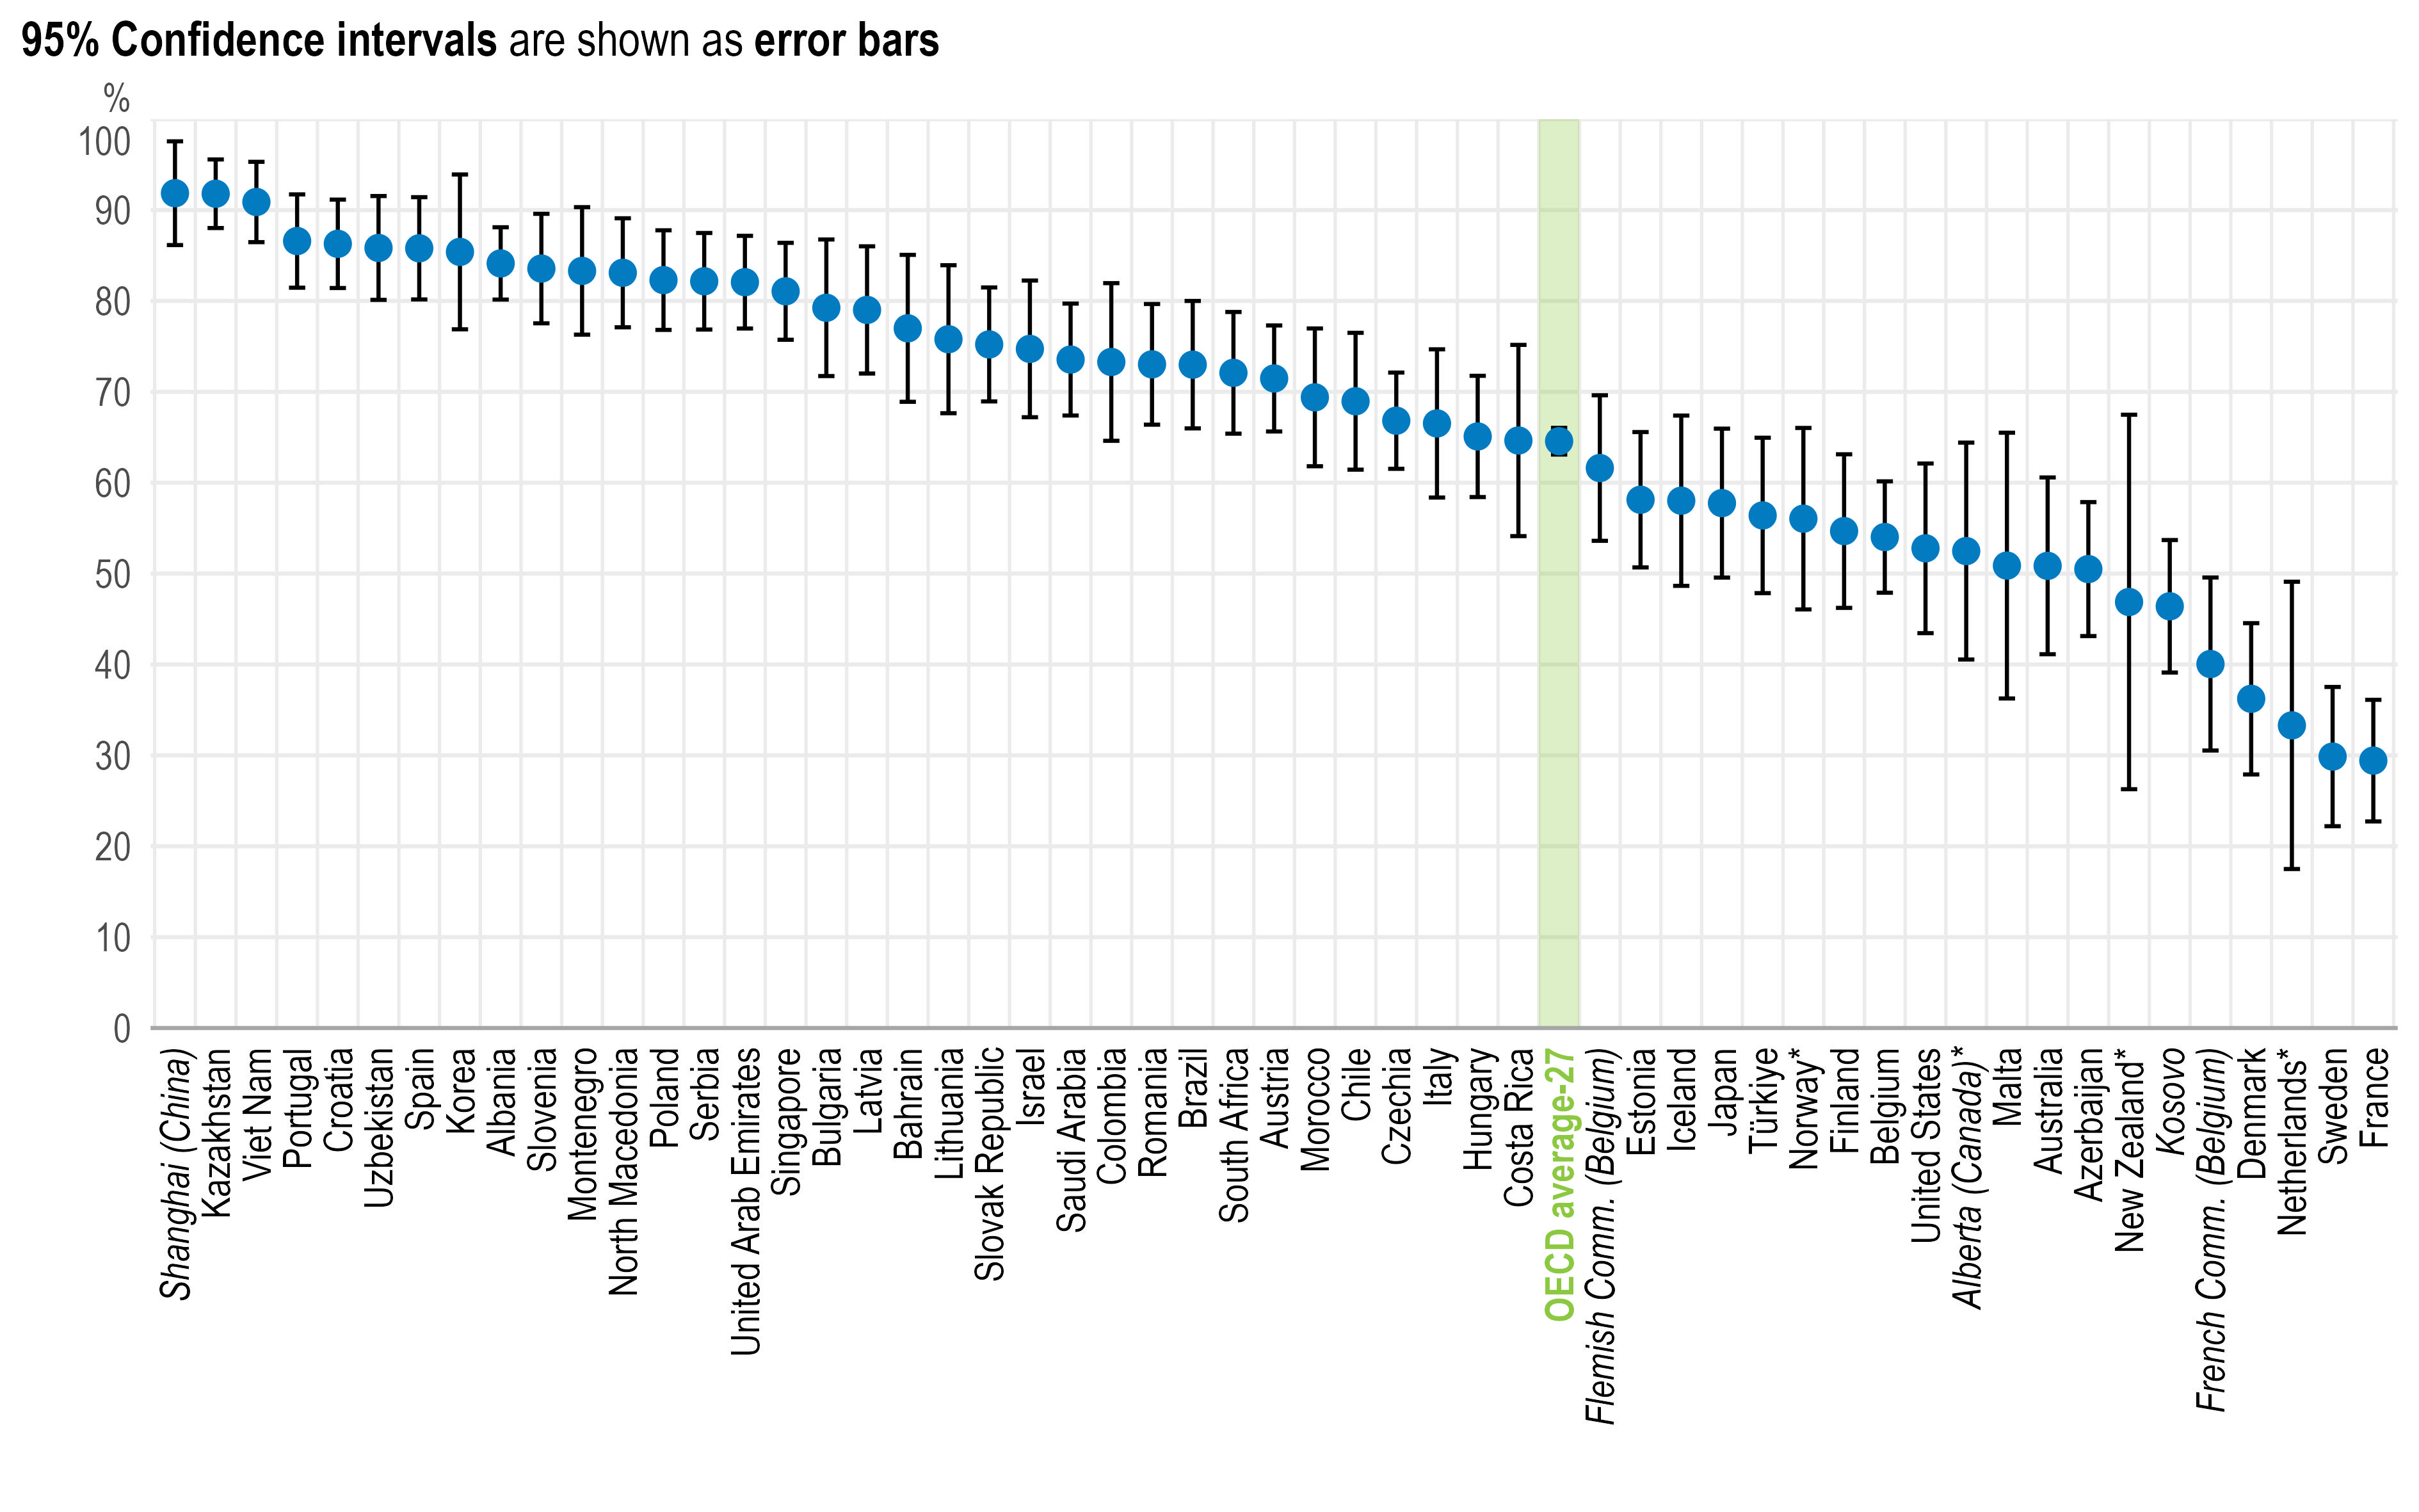
Note: *Estimates should be interpreted with caution due to a higher risk of non-response bias.
A 95% confidence interval shows the range within which the true value is likely to lie, taking into account the uncertainty associated with survey estimates. It shows how precise an estimate is: narrower intervals indicate greater precision, while wider intervals indicate greater uncertainty.
Source: OECD, TALIS 2024 Database, Table 4.16.
Principals in privately managed schools report less participation in training on the use of digital tools for teaching (54% versus 66%, respectively), on average (Table 4.16). Participation is higher in larger schools (750 students or more), schools with more disadvantaged students (over 30% disadvantaged) and schools with a larger share of students who struggle with the language of instruction (10% or more).
Principals in primary education are more valued when they:
participate in courses on developing strategies for using digital resources and tools for teaching (Tables 4.6 and 4.7);
report low professional learning needs in leadership research and theory, and in developing collaboration (Tables 4.23 and 4.24);
are involved in decisions on budget allocations and the selection of learning materials (Tables 4.40 and 4.41);
They also report higher job satisfaction when they:
face fewer material resource shortages that hinder the school's capacity to provide quality instruction (Table 4.25);
are satisfied with both their salary and their non-salary terms of employment (Table 4.45).
The patterns observed for primary principals differ from those observed at the lower secondary level in:
Professional learning: On average, more primary principals than lower secondary principals participate in professional learning on subject matter, teaching methods and pedagogical training, while fewer participate in educational conferences (Table 4.5). They also report higher learning needs, on average, in leadership theory, curriculum design, classroom observation, providing feedback and digital tools (Table 4.21).
Digital tools and Internet connectivity: In most systems, fewer primary school principals reported shortages of digital resources and tools or insufficient Internet access in 2024 than in 2018, with declines observed in 7 and 6 out of 9 systems, respectively (Table 4.34). Primary principals report higher learning needs around digital tools, on average, than lower secondary principals, ranging from 2% in the Netherlands* to 54% in Morocco (Table 4.21).
Decision-making: Primary principals have less responsibility for budgetary, staffing and curriculum decisions than lower secondary principals, on average (Tables 4.36, 4.37 and 4.38, 4.39). Responsibility is higher in privately managed schools than in publicly managed schools across all decision areas.
Salary satisfaction: On average, primary principals are less satisfied with their salary than lower secondary principals (Table 4.42). In public schools, the two groups differ little (Table 4.43). Between 2018 and 2024, satisfaction fell by 17 percentage points in Korea, while it rose by 38 percentage points in the Netherlands*‧ª (Table 4.47).
Note: *Estimates should be interpreted with caution due to a higher risk of non-response bias.
ª Estimates for TALIS 2018 and the change between TALIS 2018 and TALIS 2024 should be interpreted with caution due to a higher risk of non-response bias.
The levels of professional learning need reported by principals are relatively modest. On average, reported needs range from around 14% in promoting equity and diversity to around 28% in promoting staff well-being (Table 4.21). Developing collaboration among teachers (27%), using data to improve school quality (25%) and school management (25%) also rank high in terms of reported needs, on average.
Compared to TALIS 2018, developing collaboration and using data remain important focus areas for principals (Table 4.22). Staff well-being emerged as a top priority in 2024, marking the introduction of a new topic that was not included in the TALIS 2018 questionnaire (Table 4.21).
The prominence of staff well-being may reflect a post-pandemic shift towards well-being as a growing area of concern among principals (Dreer and Gouasé, 2022[5]; Karakus, Toprak and Chen, 2024[6]). However, the evidence base on how best to support principals in promoting staff well-being remains limited (Dreer and Gouasé, 2022[5]). At the same time, educational leaders themselves face challenges such as stress and burnout. Supporting the well-being of staff and principals is therefore likely to remain an important challenge for education systems (Doyle Fosco, 2022[7]).
The absence of a clear relationship between professional learning needs and teachers’ perceptions of leadership (Tables 4.23 and 4.24) may reflect differences in how professional learning is targeted and pursued across systems. Principals with weaker leadership practices may seek or receive training to address identified gaps, while highly motivated principals may engage in professional learning as part of their ongoing development. The relationship between need and outcome is therefore not straightforward.
The adequacy of resources available to principals shapes their ability to lead effectively. They are an important component of principals’ working conditions, supporting both staff well-being and schools’ capacity to provide quality instruction (OECD, 2018[8]; OECD, 2023[9]).
In TALIS, material resource constraints are measured using an index based on principals’ reports of the extent to which shortages or inadequacies of material resources hinder their school’s capacity to provide quality instruction. Based on these reports, schools are classified into three categories based on whether principals perceive such constraints as “not a problem”; “a bit of a problem”; or “a problem”.
Consistent with evidence based on TALIS 2018 data showing that school resources influence school leaders’ job satisfaction and workload stress (Chen, Bellibaş and Gümüş, 2023[10]), TALIS 2024 results show that principals in schools with greater material resource constraints report lower job satisfaction on average (Figure 4.3). This helps explain the within-country differences in principals’ job satisfaction documented in Chapter 2 and highlights school-level resource conditions as a factor shaping how principals experience their role.
Perceived shortages or inadequacies of instructional space and physical infrastructure are the most common resource constraints, with around one-quarter of principals (25% and 24%, respectively) reporting that they hinder the school’s capacity to provide quality instruction “quite a bit” or “a lot”, on average (Table 4.26). Shortages of digital resources and tools (16%), instructional materials (15%) and Internet access (14%) are reported less frequently, with wide variation across systems. In Colombia, more than half of principals report shortages across all resource areas, while less than 4% of principals in Singapore report shortages in any area.
On average, principals in publicly managed schools report shortages across all resource areas examined more frequently than those in privately managed schools (Tables 4.27, 4.28, 4.29, 4.30, 4.31, 4.32 and 4.33). Gaps are particularly wide for physical infrastructure (12 percentage points) and Internet access (11 percentage points).
Change in the scale of lower secondary principals' job satisfaction1 associated with the index of lack of material resources2,3
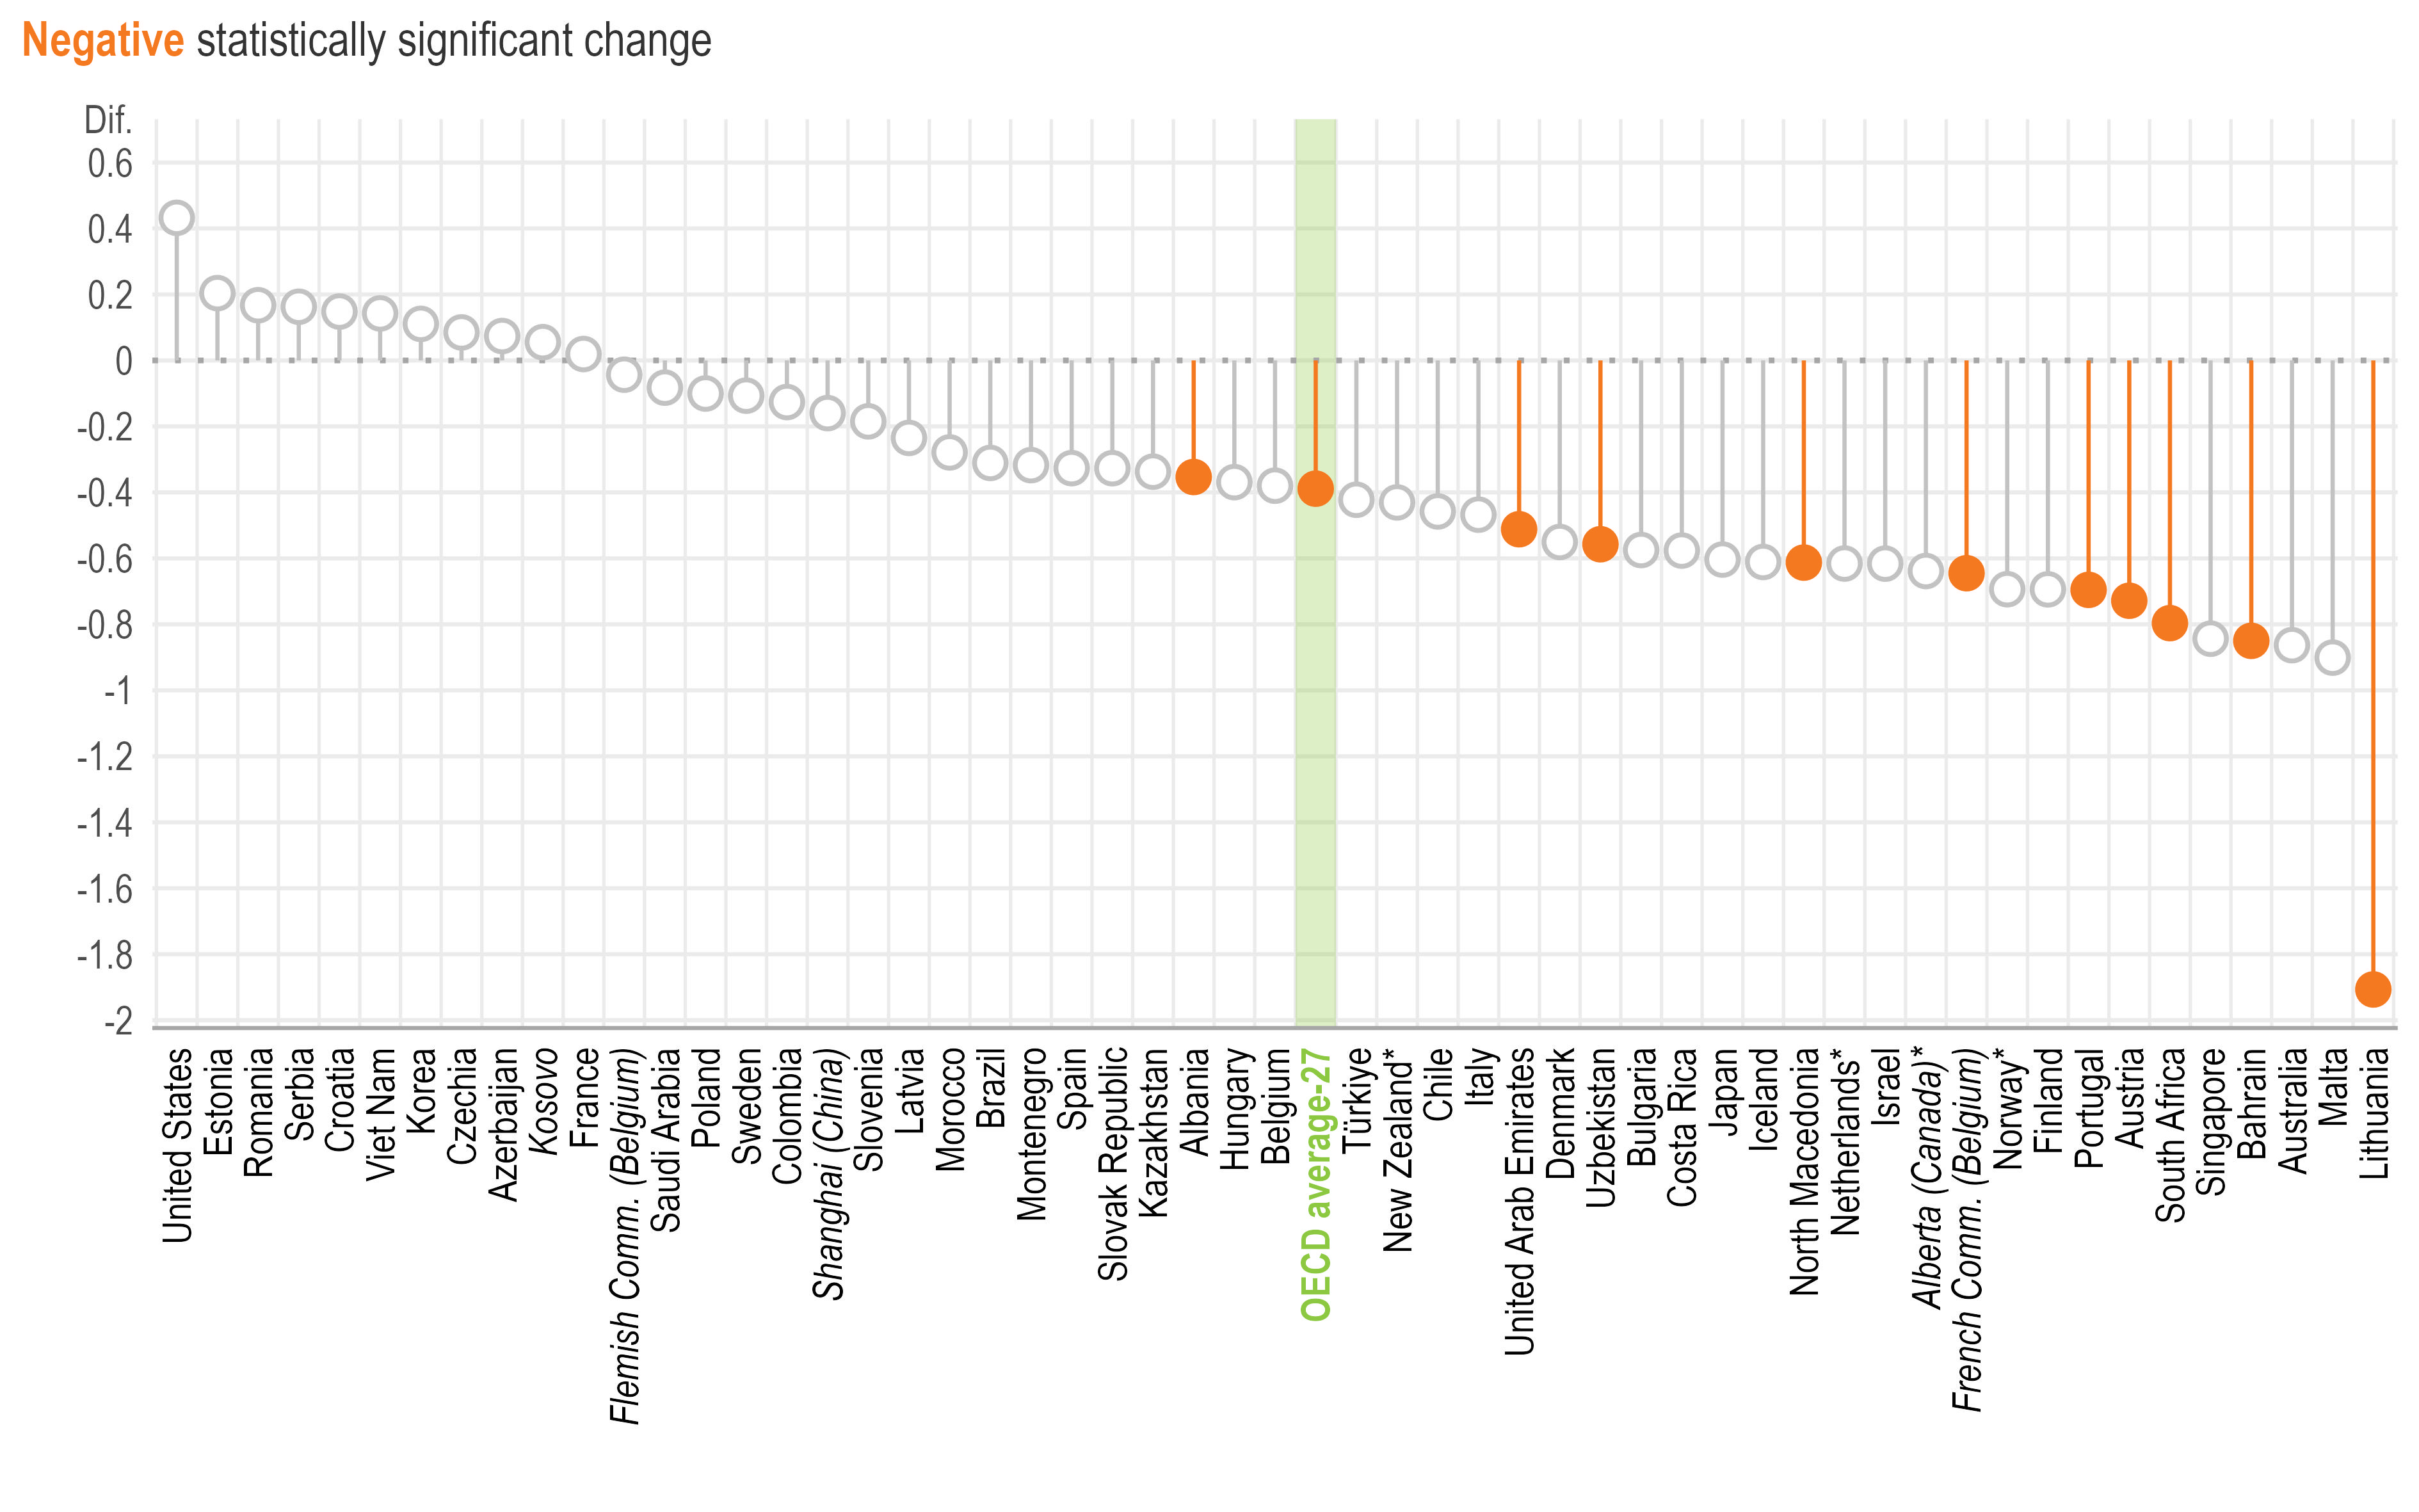
Note: *Estimates should be interpreted with caution due to a higher risk of non-response bias.
Statistically significant coefficients are highlighted with filled circles (see Annex B). Filled circles above 0 indicate a positive association, while those below 0 reflect a negative relationship.
1. Standardised scale scores with a standard deviation of 2 and the value of 10 corresponding to the item mid-point value of the response scale. For more information on the scales, see Annex B.
2. Simple index ranging from 1 “Not a problem” to 3 “A problem”, derived from seven items on shortages of material resources. A value of 1 indicates that all seven resource issues hindered instruction “Not at all” or “To some extent”. A value of 3 indicates that all issues hindered instruction “Quite a bit” or “A lot”. All other response combinations are coded 2 “A bit of a problem”.
3. Results are based on school-level linear regression analysis controlling for principal characteristics (i.e. gender and age [standardised at the international level]) and school characteristics (i.e. school governance type, school size and school intake of students from socio-economically disadvantaged homes).
Source: OECD, TALIS 2024 Database, Table 4.25.
Shortages are also more prevalent in schools with a high proportion of disadvantaged students across all resource areas, with the largest gaps observed for vocational materials (9 percentage points), physical infrastructure (8 percentage points), and Internet access (8 percentage points) (Tables 4.27, 4.28, 4.29, 4.30, 4.31, 4.32 and 4.33). Insufficient Internet connectivity is reported as a barrier to quality instruction by over 70% of principals in disadvantaged schools in Colombia, Morocco, Saudi Arabia and South Africa (Figure 4.4). The largest gaps between disadvantaged and advantaged schools appear in Costa Rica, Morocco and South Africa (over 40 percentage points in each system).
Percentage of lower secondary principals who report that the school’s capacity to provide quality instruction is hindered by insufficient Internet access “quite a bit” or “a lot”
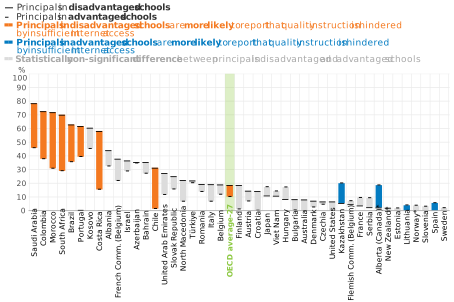
Note: *Estimates should be interpreted with caution due to a higher risk of non-response bias.
Education systems are sorted in descending order by the percentage of lower secondary principals in disadvantaged schools who report that the school’s capacity to provide quality instruction is currently hindered "quite a bit" or "a lot" by insufficient Internet access.
Advantaged schools are those with 10% or less of students from socio-economically disadvantaged homes. Disadvantaged schools are those with more than 30% of students from socio-economically disadvantaged homes.
Source: OECD, TALIS 2024 Database, Table 4.29.
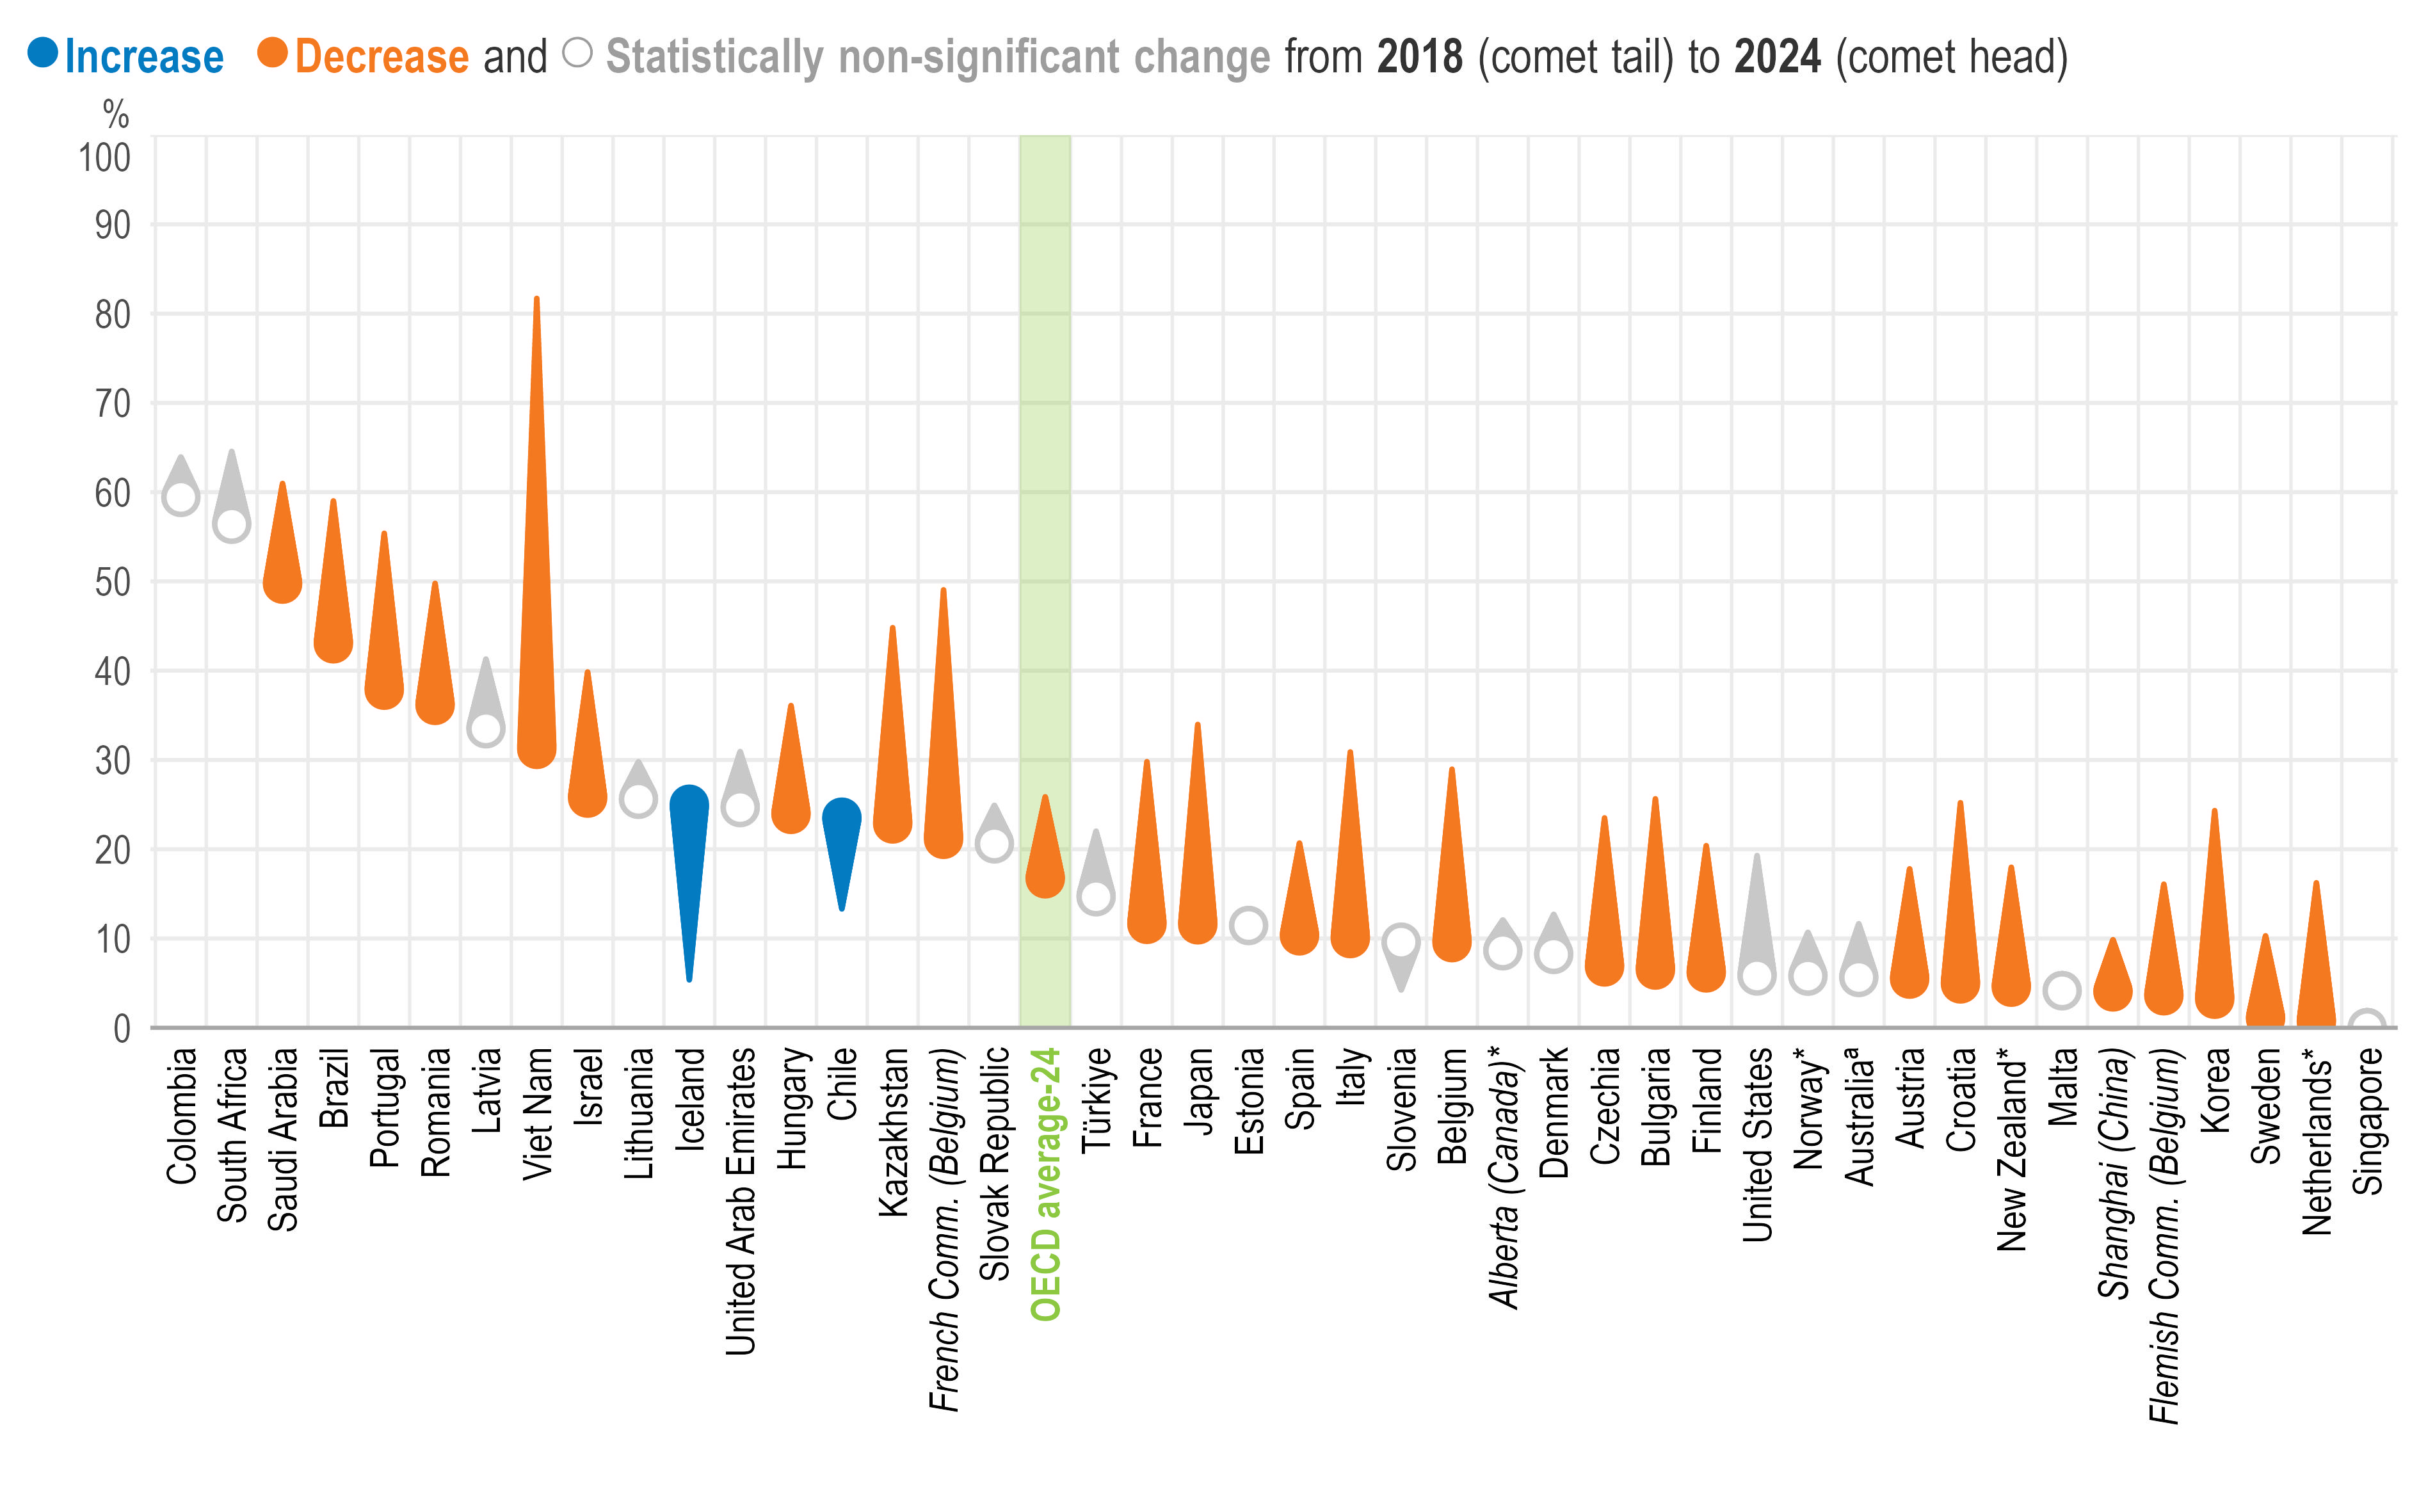
The share of principals reporting such shortages has fallen since 2018 for most resource areas (Table 4.34). Shortage or inadequacy of digital resources and tools showed the largest improvement (9 percentage points, on average), with reductions observed in most systems (Figure 4.5). Viet Nam recorded the sharpest decline (51 percentage points), reflecting sustained national investment in digital infrastructure in education (Box 4.2). Chile and Iceland were notable exceptions where reported shortages increased over the period.
Percentage of lower secondary principals who report that the school’s capacity to provide quality instruction is hindered by a shortage in or inadequacy of digital resources and tools for instruction “quite a bit” or “a lot”
Note: *Estimates should be interpreted with caution due to a higher risk of non-response bias.
ª Estimates for TALIS 2018 and the change between TALIS 2018 and TALIS 2024 should be interpreted with caution due to a higher risk of non-response bias.
Education systems are sorted in descending order by the percentage of lower secondary principals in 2024 who report that the school's capacity to provide quality instruction is hindered "quite a bit" or "a lot" by a shortage in or inadequacy of digital resources and tools for instruction.
Source: OECD, TALIS 2018 and TALIS 2024 Databases, Table 4.34.
In January 2017, the prime minister of Viet Nam launched a project (2016-2020) to strengthen the application of information technology in education and training. The project focused on deploying IT systems across schools and education authorities; establishing a sector-wide education database; moving administrative processes and teacher training to digital platforms and developing a shared repository of digital learning materials.
Building on this foundation, a successor phase (2022-2025) was adopted with an outlook to 2030, prioritising digital transformation across the education system. Its main objectives are to ensure fibre-optic Internet connectivity for all educational institutions, prioritise cloud-based services, support Internet access for teachers and learners, and equip students and educators with the devices needed for digital learning.
By 2025, the project aimed for half of all students and educators to have the facilities, connectivity and software needed to participate in digital and online learning. Funding combines state budget allocations with enterprise contributions and public-private partnerships.
Sources:
Government of Viet Nam (2017). Decision No. 117/QD-TTg approving the "Strengthening the Application of Information Technology in Management and Support for Teaching, Learning, and Scientific Research to Enhance the Quality of Education and Training for the 2016–2020 Period, with Orientation to 2025" project (Quyết định số 117/QĐ-TTg, 25 January 2017). https://vanban.chinhphu.vn/default.aspx?pageid=27160&docid=188112
Government of Viet Nam (2022). Decision No. 131/QD-TTg approving the "Strengthening the Application of Information Technology and Digital Transformation in Education and Training for the 2022–2025 Period, with Orientation to 2030" project (Quyết định số 131/QĐ-TTg, 25 January 2022). https://vanban.chinhphu.vn/?pageid=27160&docid=205236&classid=0
Principals’ ability to address school challenges such as resource constraints depends, in part, on their decision-making authority. As shown in Box 4.3, budgetary decisions are the most centralised across education systems. Less than one-quarter (22%) of principals in publicly managed schools report school-level authority in this area, on average. A principal with greater control over resources can respond to a shortage more effectively by reallocating funds than one who must rely on external authorities to act. This may be especially relevant in systems that combine low school-level decision-making authority and high rates of material shortages, such as Brazil, Costa Rica, Kosovo, Morocco and Saudi Arabia (Tables 4.26 and 4.35).
Neither greater centralisation nor greater school-level authority is inherently preferable. Having responsibility can strengthen principals’ ability to address the needs of the school (Hanushek, Link and Woessmann, 2013[11]). At the same time, too much can reduce the time available for leadership tasks (Pont, Nusche and Moorman, 2008[4]).
TALIS measures the distribution of decision-making authority between schools and external authorities across four domains: student policies (student discipline, assessment and admissions), curriculum (learning materials, course content and offerings), staffing (hiring, dismissing and suspending teachers) and budgets (setting teachers’ salaries and allocating school budgets).
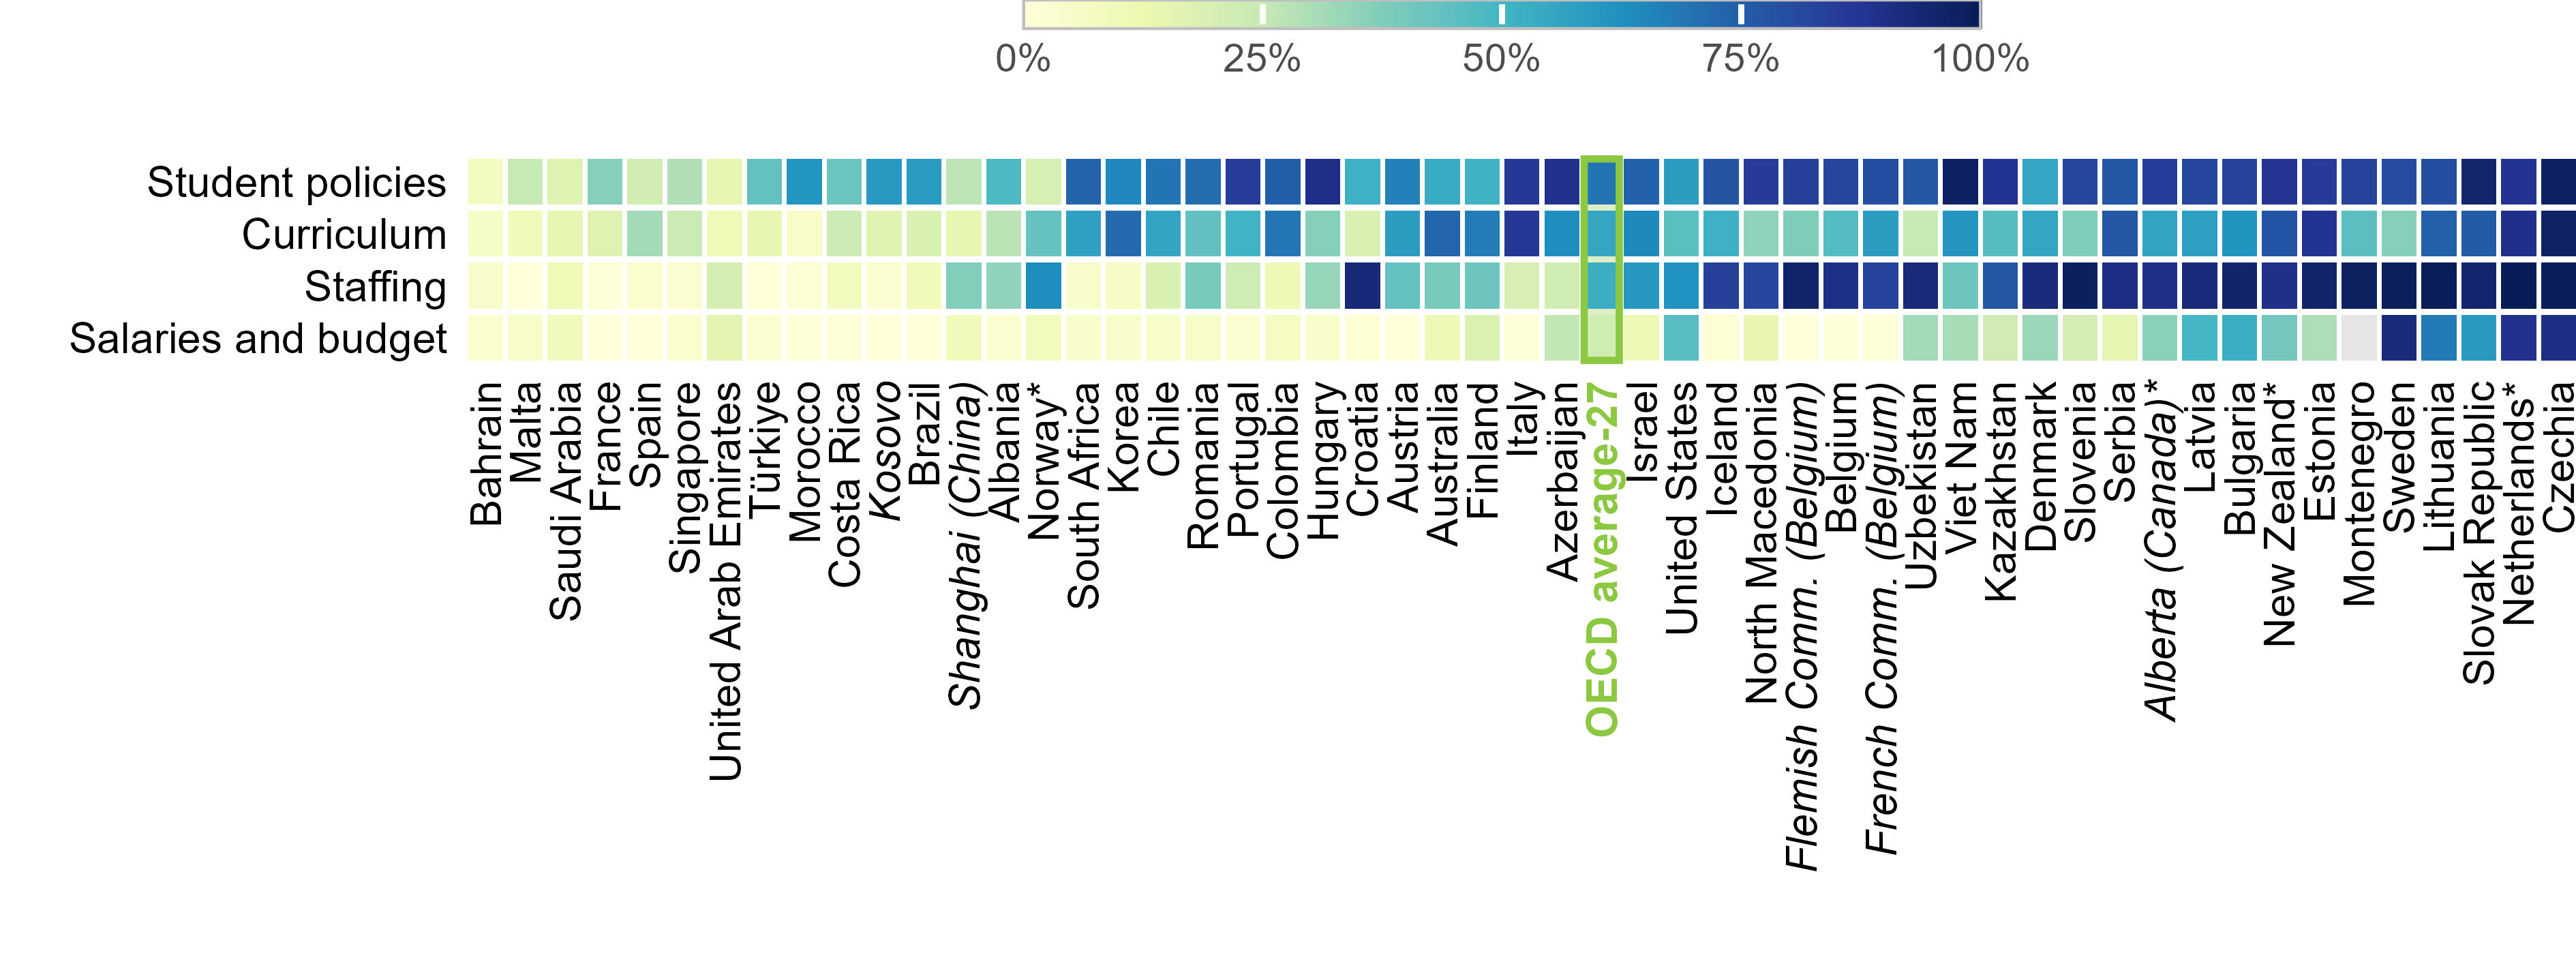
Student policies are the domain where principals most commonly report having authority (Figure 4.6). Around 70% of principals in publicly managed schools report that these decisions are made mostly at the school level, on average, followed by curriculum (56%) and staffing decisions (53%), while budgetary decisions are the most centralised domain, with fewer than one-quarter of principals (22%) reporting school involvement.
Privately managed schools have considerably more decision-making authority than publicly managed schools across all domains, with gaps particularly wide for budgeting (+45 percentage points) and staffing (+44 percentage points) (Tables 4.36, 4.37, 4.38. and 4.39). Figure 4.6 shows the distribution of school-level decision-making responsibility for publicly managed schools.
Percentage of lower secondary principals in publicly managed schools who report that decisions are mostly taken within schools1,2
Note: *Estimates should be interpreted with caution due to a higher risk of non-response bias.
Education systems are sorted in ascending order of the average percentage of lower secondary principals in publicly managed schools reporting that decisions are mostly within schools across the four domains.
1. Based on four indices that include: salaries and budget: T4PAUTB (TC4G24D–E); staffing: T4PAUTS (TC4G24A–C); curriculum: T4PAUTC (TC4G24I–K) and student policies: T4PAUTP (TC4G24F–H). Schools are classified by the distribution of decision-making as mostly external, shared, or school-level. Data are unavailable for Montenegro (T4PAUTB only), Japan and Poland.
2. Comparisons between the Netherlands* and other education systems should be interpreted with caution, as the estimates for the Netherlands* are based on schools that are privately managed but publicly funded.
Source: OECD, TALIS 2024 Database, Table 4.35.
Two broad governance profiles emerge across TALIS systems. The first group reports consistently high school-level involvement in decisions across all domains. This includes Czechia, Lithuania, the Netherlands* (where most schools are privately managed but publicly funded) and the Slovak Republic, consistent with allocations previously documented (OECD, 2018[12]). A second group reports low involvement in most areas. This includes Bahrain, Malta and Saudi Arabia, though the pattern is not uniform. Most systems fall somewhere between these two groups, with mixed decision-making profiles, where budget and staffing decisions remain more centralised.
The scope of principals’ decision-making involvement is not associated with how teachers rate their leadership, on average (Tables 4.40 and 4.41). The finding may suggest that what teachers value is not how much authority principals have, but on the quality of the support they receive, their relationships and working conditions (Darling-Hammond et al., 2026[1]).
Earnings quality and labour market security are two foundational dimensions of job quality (Cazes, Hijzen and Saint-Martin, 2015[13]; Eurofound and International Labour Organization, 2019[14]). For principals, these translate into satisfaction with salary levels, and the terms and conditions of their employment contract. Adequate employment conditions help prevent dissatisfaction and support sustained professional engagement and effective school leadership.
Salary
Salaries, both in absolute terms and relative to comparable professions, can influence decisions to enter and remain in school leadership, with higher relative salaries generally associated with greater occupational attractiveness (OECD, 2025[15]). Conversely, relatively low salaries may discourage experienced teachers from taking on leadership roles, with implications for the future pipeline of school principals (Pont, Nusche and Moorman, 2008[4]).
Education at a Glance (OECD, 2025[15]) provides system-level data on the statutory and actual salaries of principals in public institutions for the 2023 reference year, expressed in USD using purchasing power parities (PPPs). Statutory salaries refer to scheduled pay set by official salary scales, while actual salaries include all work-related payments, including bonuses and allowances. According to Education at a Glance, the actual salaries of lower secondary principals in 2023 were around USD 87 000.
Compared to teachers, principals earn roughly one and a half times more across systems with available data (OECD, 2025[15]). However, the comparison does not capture differences in how compensation is structured. For example, principals are less likely than teachers to receive additional compensation for responsibilities beyond regular duties (OECD, 2025[15]).
In the public sector, the pay difference between middle managers relative to professionals in central public administrations in OECD countries is broadly comparable to the pay difference between principals and teachers (OECD, 2017[16]).6 However, in the private sector, pay differentials can be larger: evidence from Australia suggests that managers earn around twice as much as those in non-managerial roles (Workplace Gender Equality Agency, 2025[17]).
Assessing whether principals are adequately compensated is not straightforward. Different indicators provide complementary perspectives. Principals’ salaries relative to tertiary-educated workers provide a useful labour market reference point. However, a favourable ratio in an economy where salaries are generally low may still leave principals feeling underpaid. Comparing principals’ salaries to those of teachers instead reflects the pay advantage associated with school leadership. Too small a differential may make it difficult to recruit and retain principals, while too large a differential may attract experienced teachers away from the classroom.
Beyond a certain threshold, pay levels may not explain whether principals feel adequately compensated. Salary satisfaction captures what objective pay measures cannot, how principals feel about their pay in the context of the cost of living, pay structures, workload, expectations and norms.
TALIS 2024 measures salary satisfaction by asking principals to rate their agreement (“strongly disagree”; “disagree”; “agree”; “strongly agree”) with the statement: “I am satisfied with the salary I receive from my work”. Around half of principals (49%) are satisfied with their salary, on average, although levels vary across systems, from below 25% in Kosovo, Malta, Portugal, Serbia and Slovenia to over 80% in Lithuania and the Netherlands* (Table 4.42).
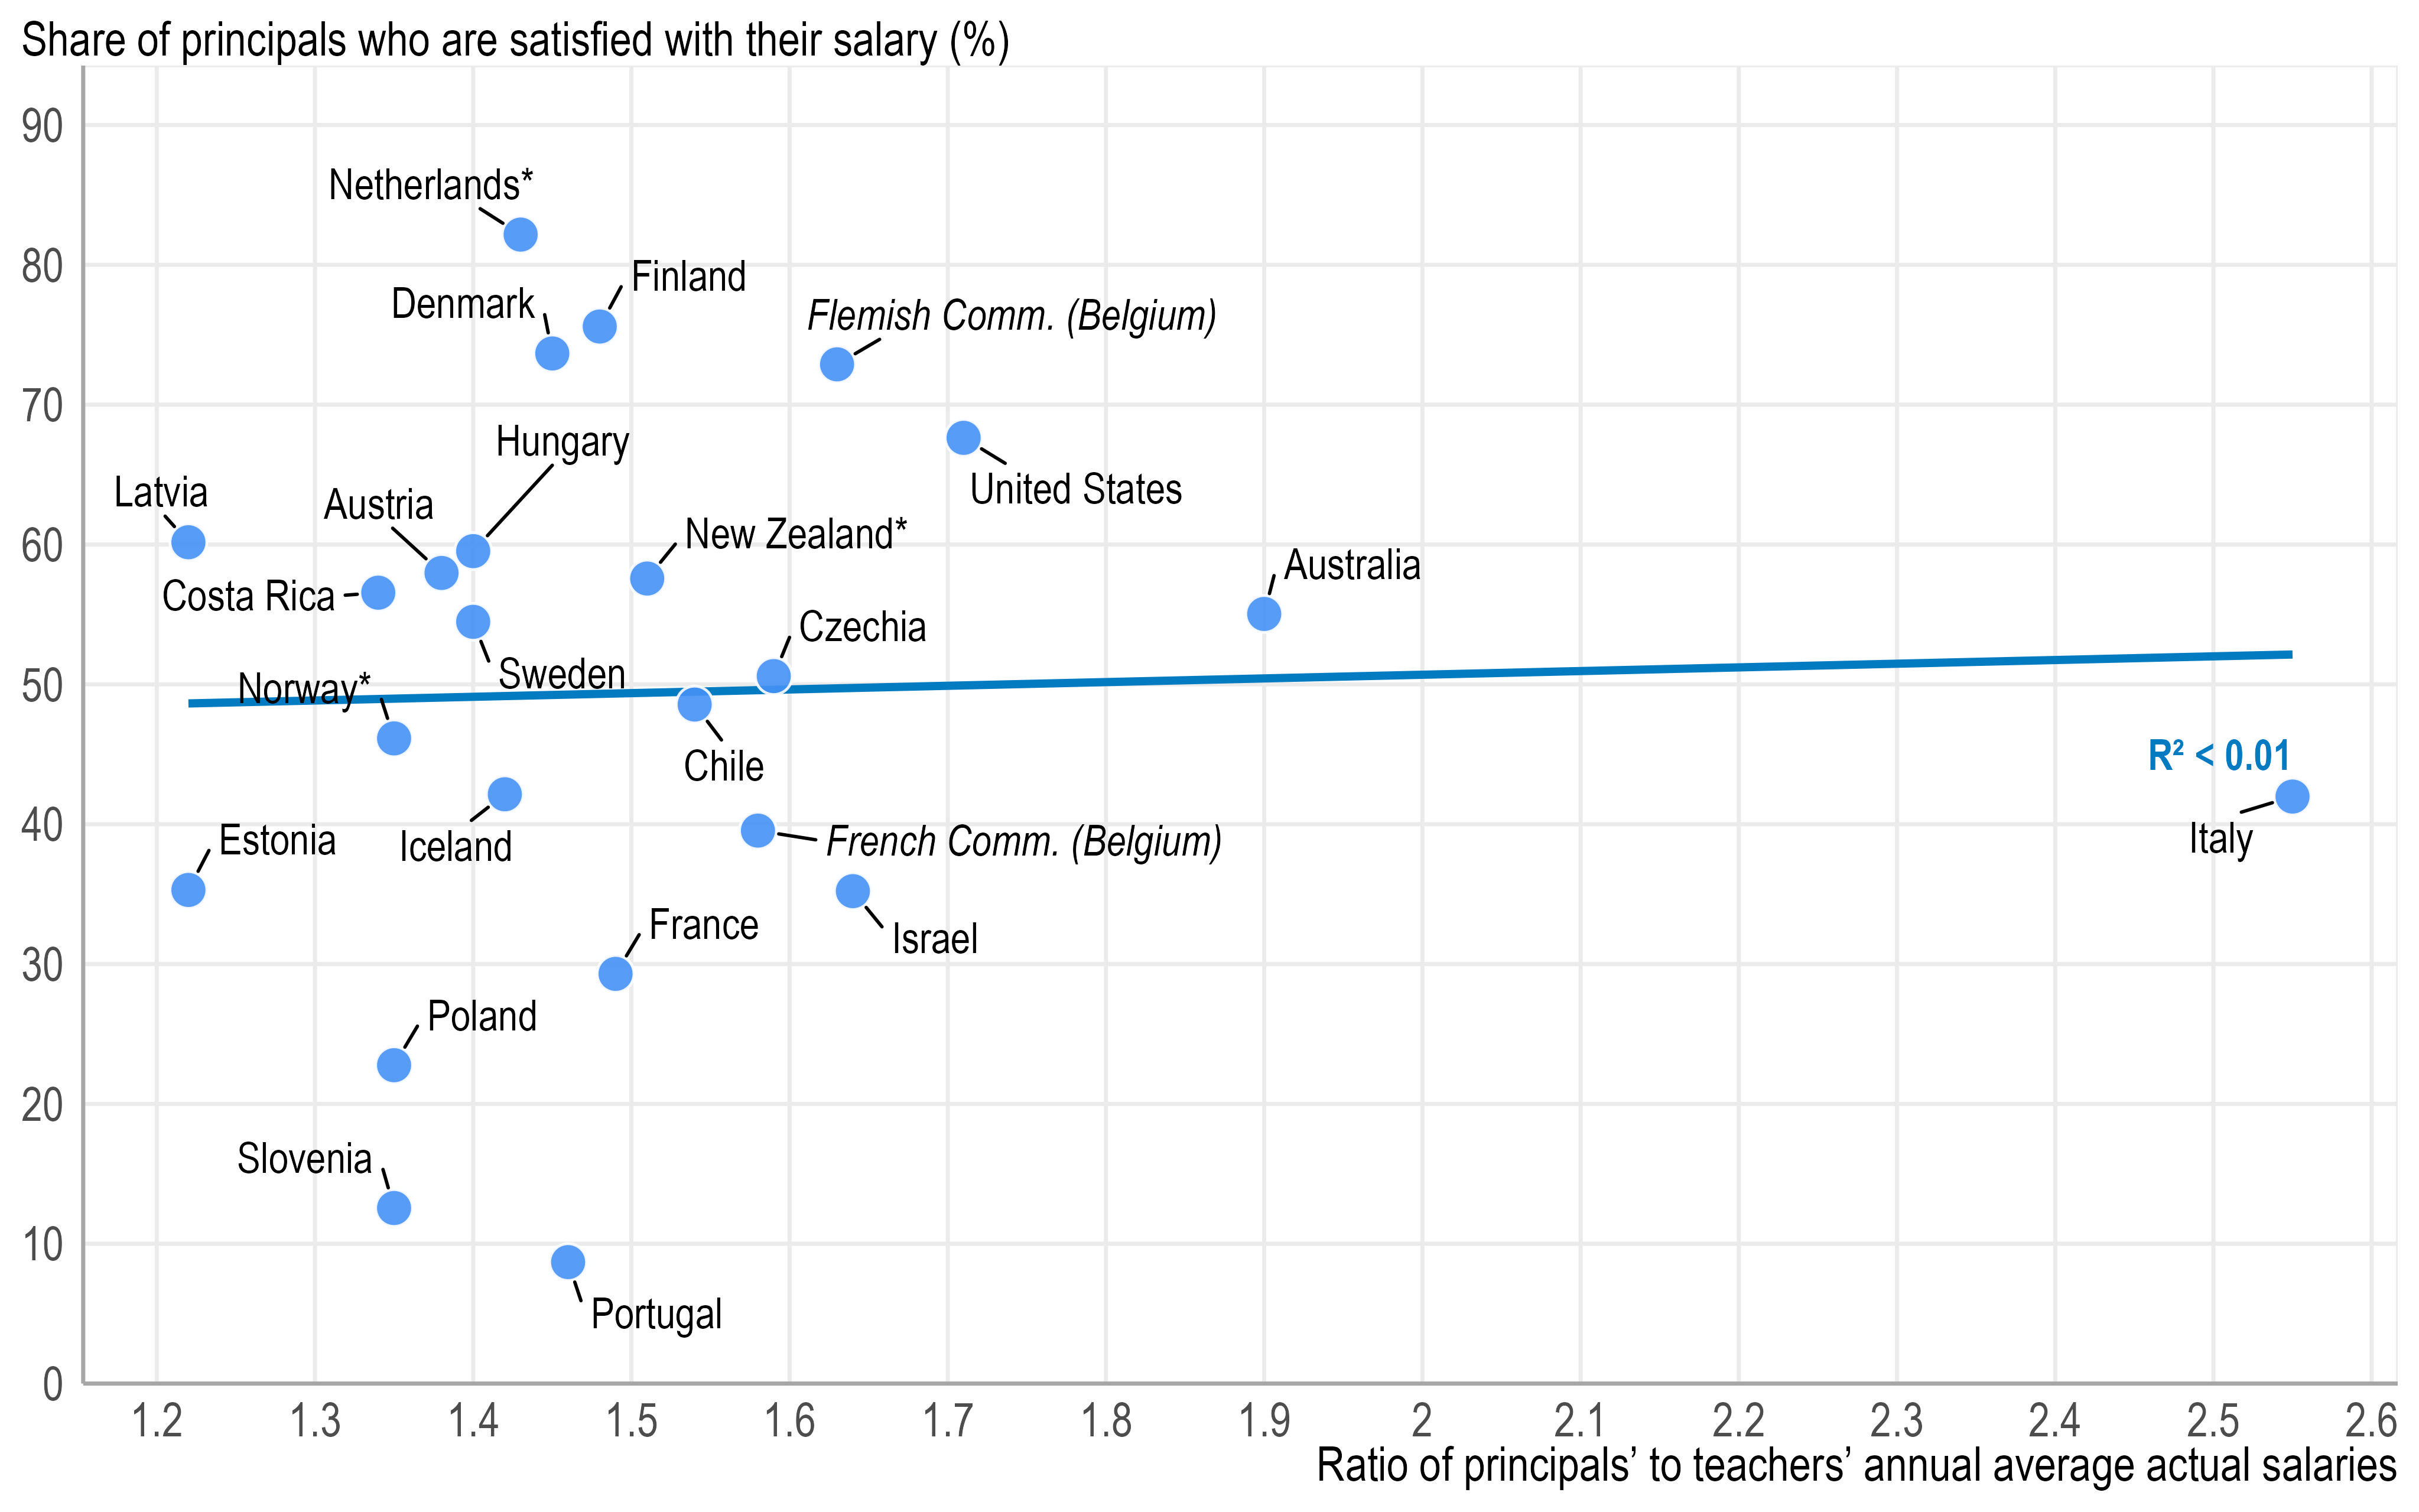
At the system level, no relationship is observed between the ratio of principal-to-teacher salaries and principals’ salary satisfaction (Figure 4.7). Systems with similar relative salary ratios often report very different levels of satisfaction. For example, Denmark and Portugal have comparable salary ratios, yet satisfaction levels differ. Around three‑quarters (74%) of principals in Denmark report being satisfied with their salary compared to fewer than one in ten (9%) in Portugal.
Based on responses of lower secondary principals working in publicly managed schools and system-level data on principals’ salaries relative to teachers’ salaries1,2
Note: *Estimates should be interpreted with caution due to a higher risk of non-response bias.
The value (less than 0.01) indicates that the principal-to-teacher salary ratio accounts for less than 1% of the variation in principals’ salary satisfaction across systems.
1. Ratio of the average annual salaries (including bonuses and allowances) of full-time principals aged 25–to–64 to full-time teachers aged 25–to–6 4working in public schools in lower secondary general programmes (2023, or latest year available).
2. Comparisons between the Netherlands* and other education systems should be interpreted with caution, as the estimates for the Netherlands* are based on schools that are privately managed but publicly funded.
Source: OECD, TALIS 2024 Database, Tables 4.43 and 4.44.
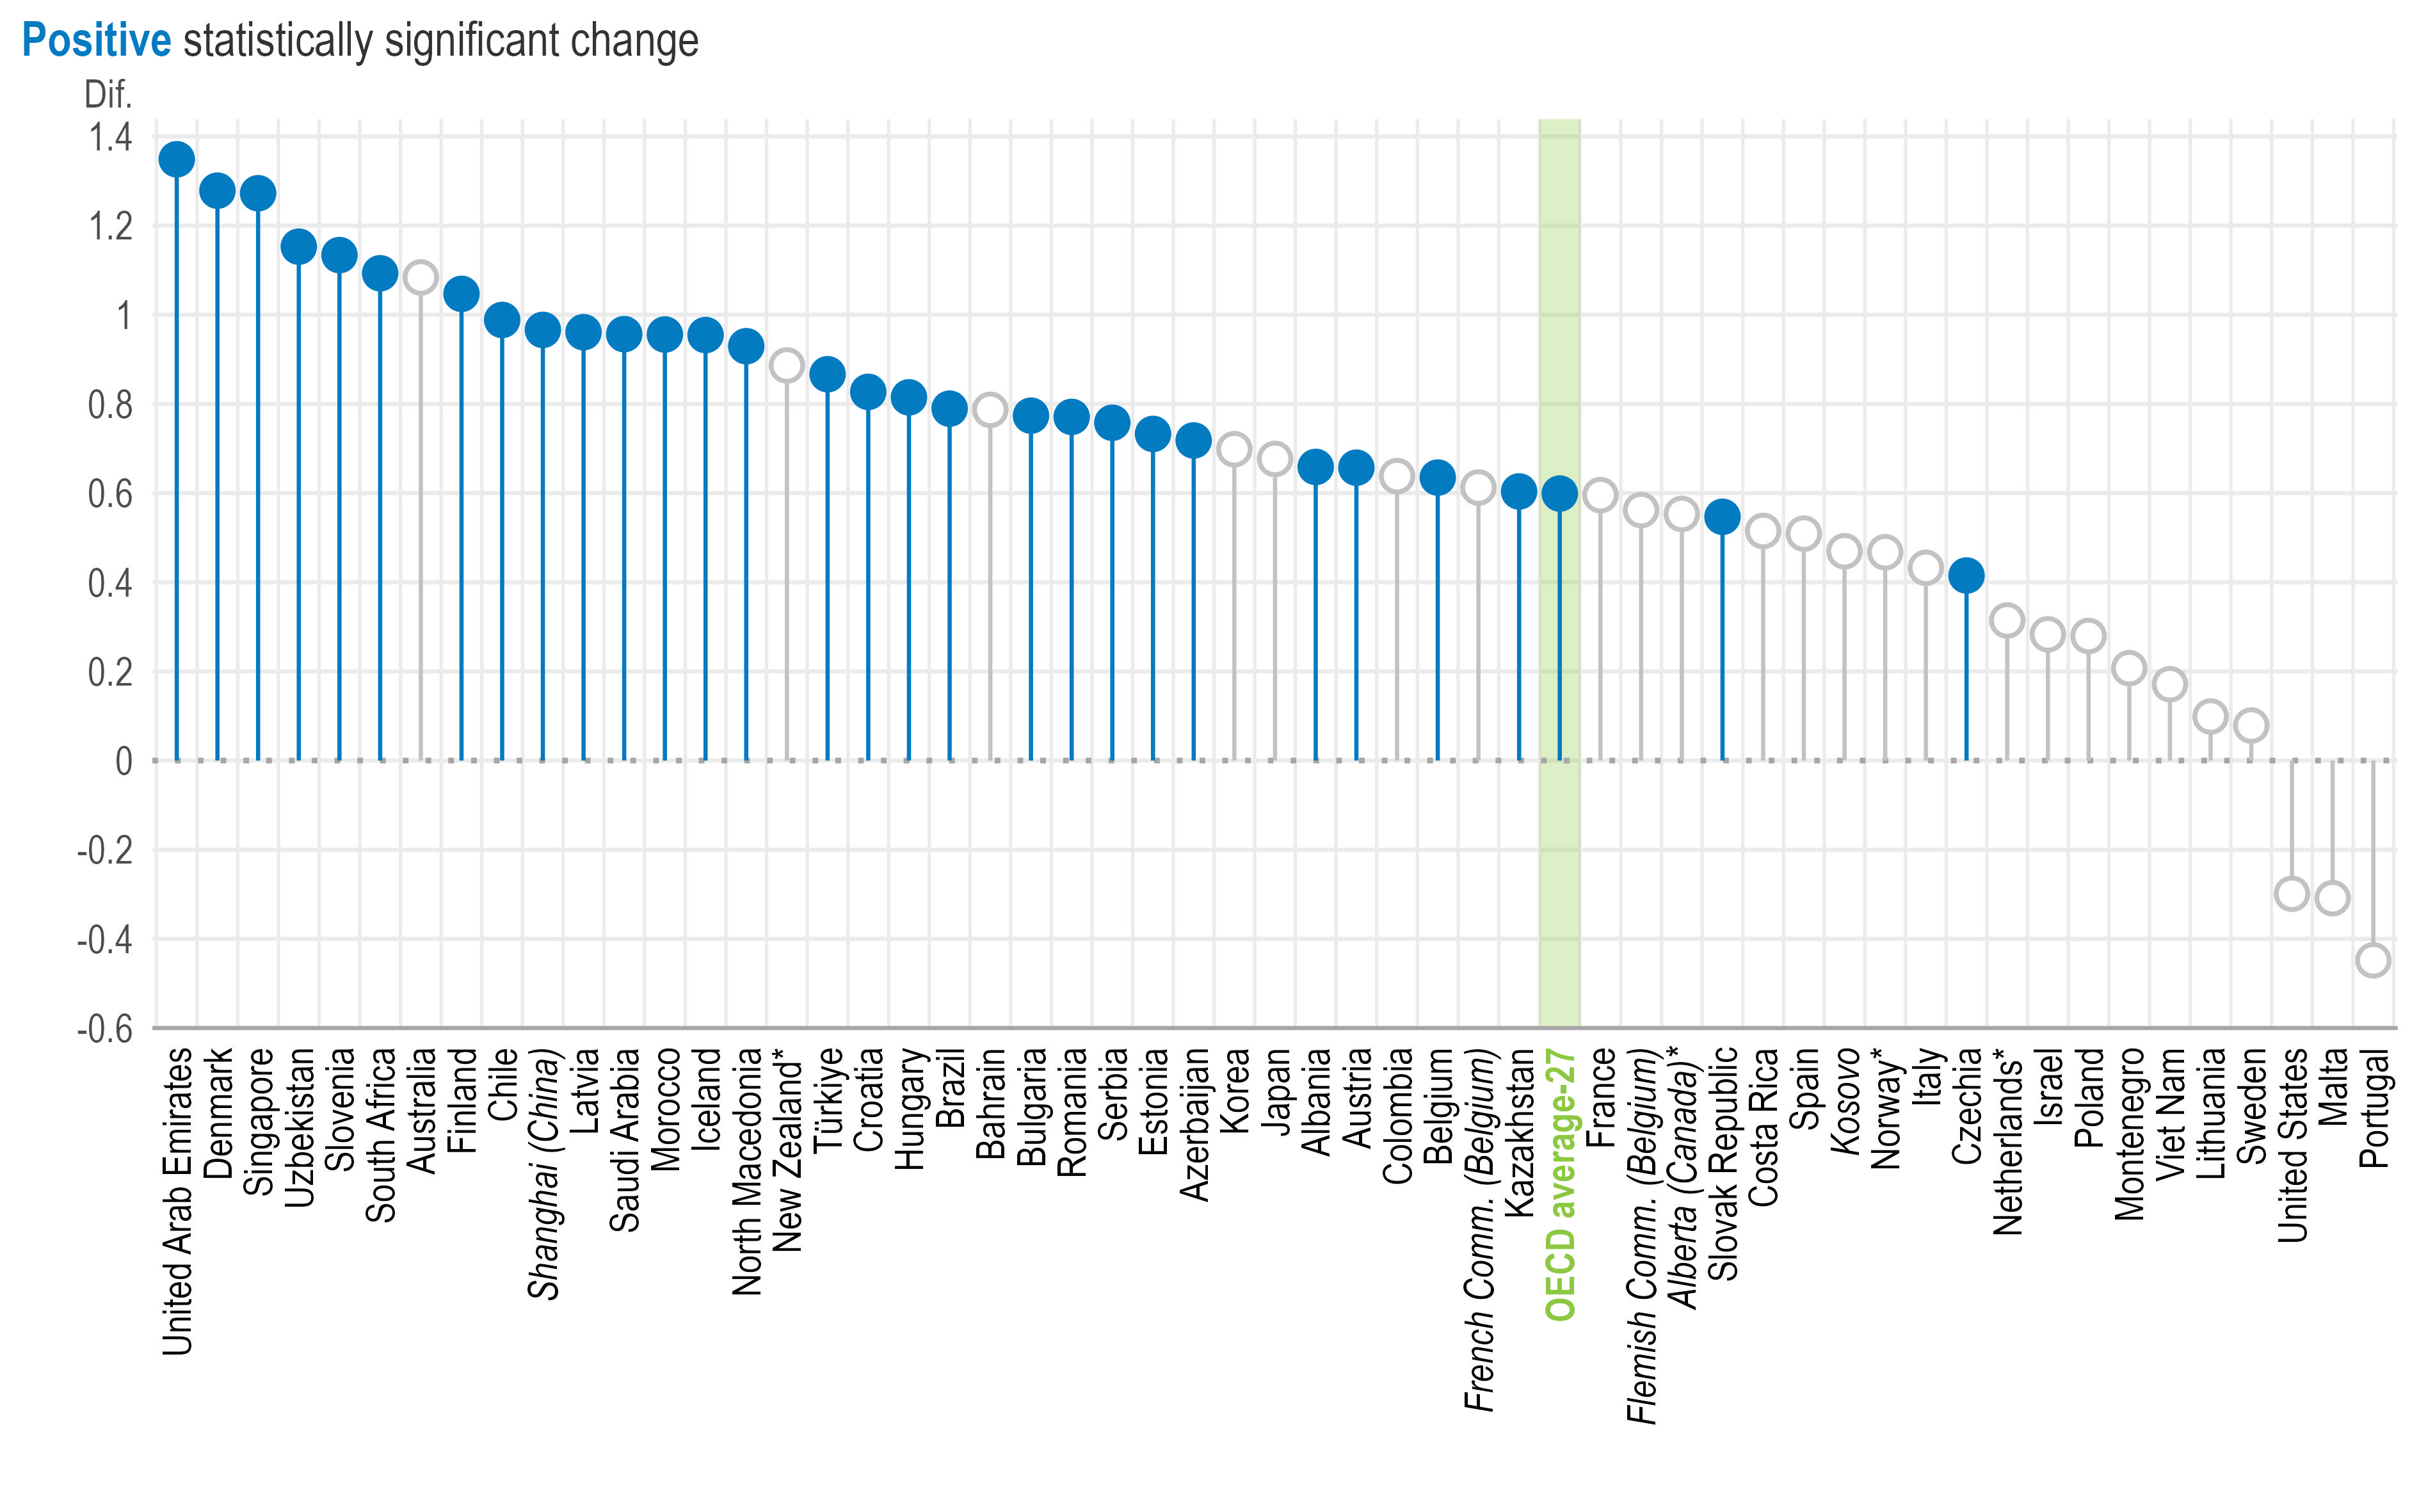
Principals who are satisfied with their salaries tend to report higher levels of job satisfaction (Figure 4.8), which, as mentioned earlier in this chapter, is associated with being more valued by teachers (Chapter 2, Table 2.25).
Change in the scale of lower secondary principals' job satisfaction1 associated with principals “agree[ing]” or “strongly agree[ing]” that they are satisfied with their salary2,3
Note: *Estimates should be interpreted with caution due to a higher risk of non-response bias.
Statistically significant coefficients are highlighted with filled circles (see Annex B). Filled circles above 0 indicate a positive association, while those below 0 reflect a negative relationship.
1. Standardised scale scores with a standard deviation of 2 and the value of 10 corresponding to the item mid-point value of the response scale. For more information on the scales, see Annex B.
2. The reference category is “strongly disagree” or “disagree”.
3. Results are based on school-level linear regression analysis controlling principal characteristics (i.e. gender and age [standardised at the international level]) and school characteristics (i.e. school governance type, school size and school intake of students from socio-economically disadvantaged homes).
Source: OECD, TALIS 2024 Database, Table 4.45.
The share of principals reporting satisfaction with their salary is around 14 percentage points higher among older principals (aged 60 and above) than among younger principals (under age 40), on average (Table 4.42). This age difference is most evident in Türkiye (62 percentage points), Bahrain (56 percentage points), Alberta (Canada)* (50 percentage points) and Spain (41 percentage points). It is also 8 percentage points higher among more experienced (over 10 years) than novice (5 years or fewer) principals, on average.
Principals in privately managed schools report more salary satisfaction, on average (55% versus 48%) (Table 4.46). This gap is most pronounced in Portugal (+43 percentage points) and Poland (+40 percentage points). The pattern is reversed in Denmark (-39 percentage points) and the Flemish Community of Belgium (-19 percentage points).
Between 2018 and 2024, salary satisfaction increased in many systems (Figure 4.9). The largest increases were observed in Lithuania, where the share of principals reporting satisfaction rose from 33% to 87% (+55 percentage points), reflecting sustained policy commitments to improve principals’ pay and working conditions (Box 4.4). This was followed by Bulgaria (+30 percentage points), New Zealand* (+27 percentage points) and Italy (+25 percentage points).
Percentage of lower secondary principals who “agree” or “strongly agree” that they are satisfied with their salary
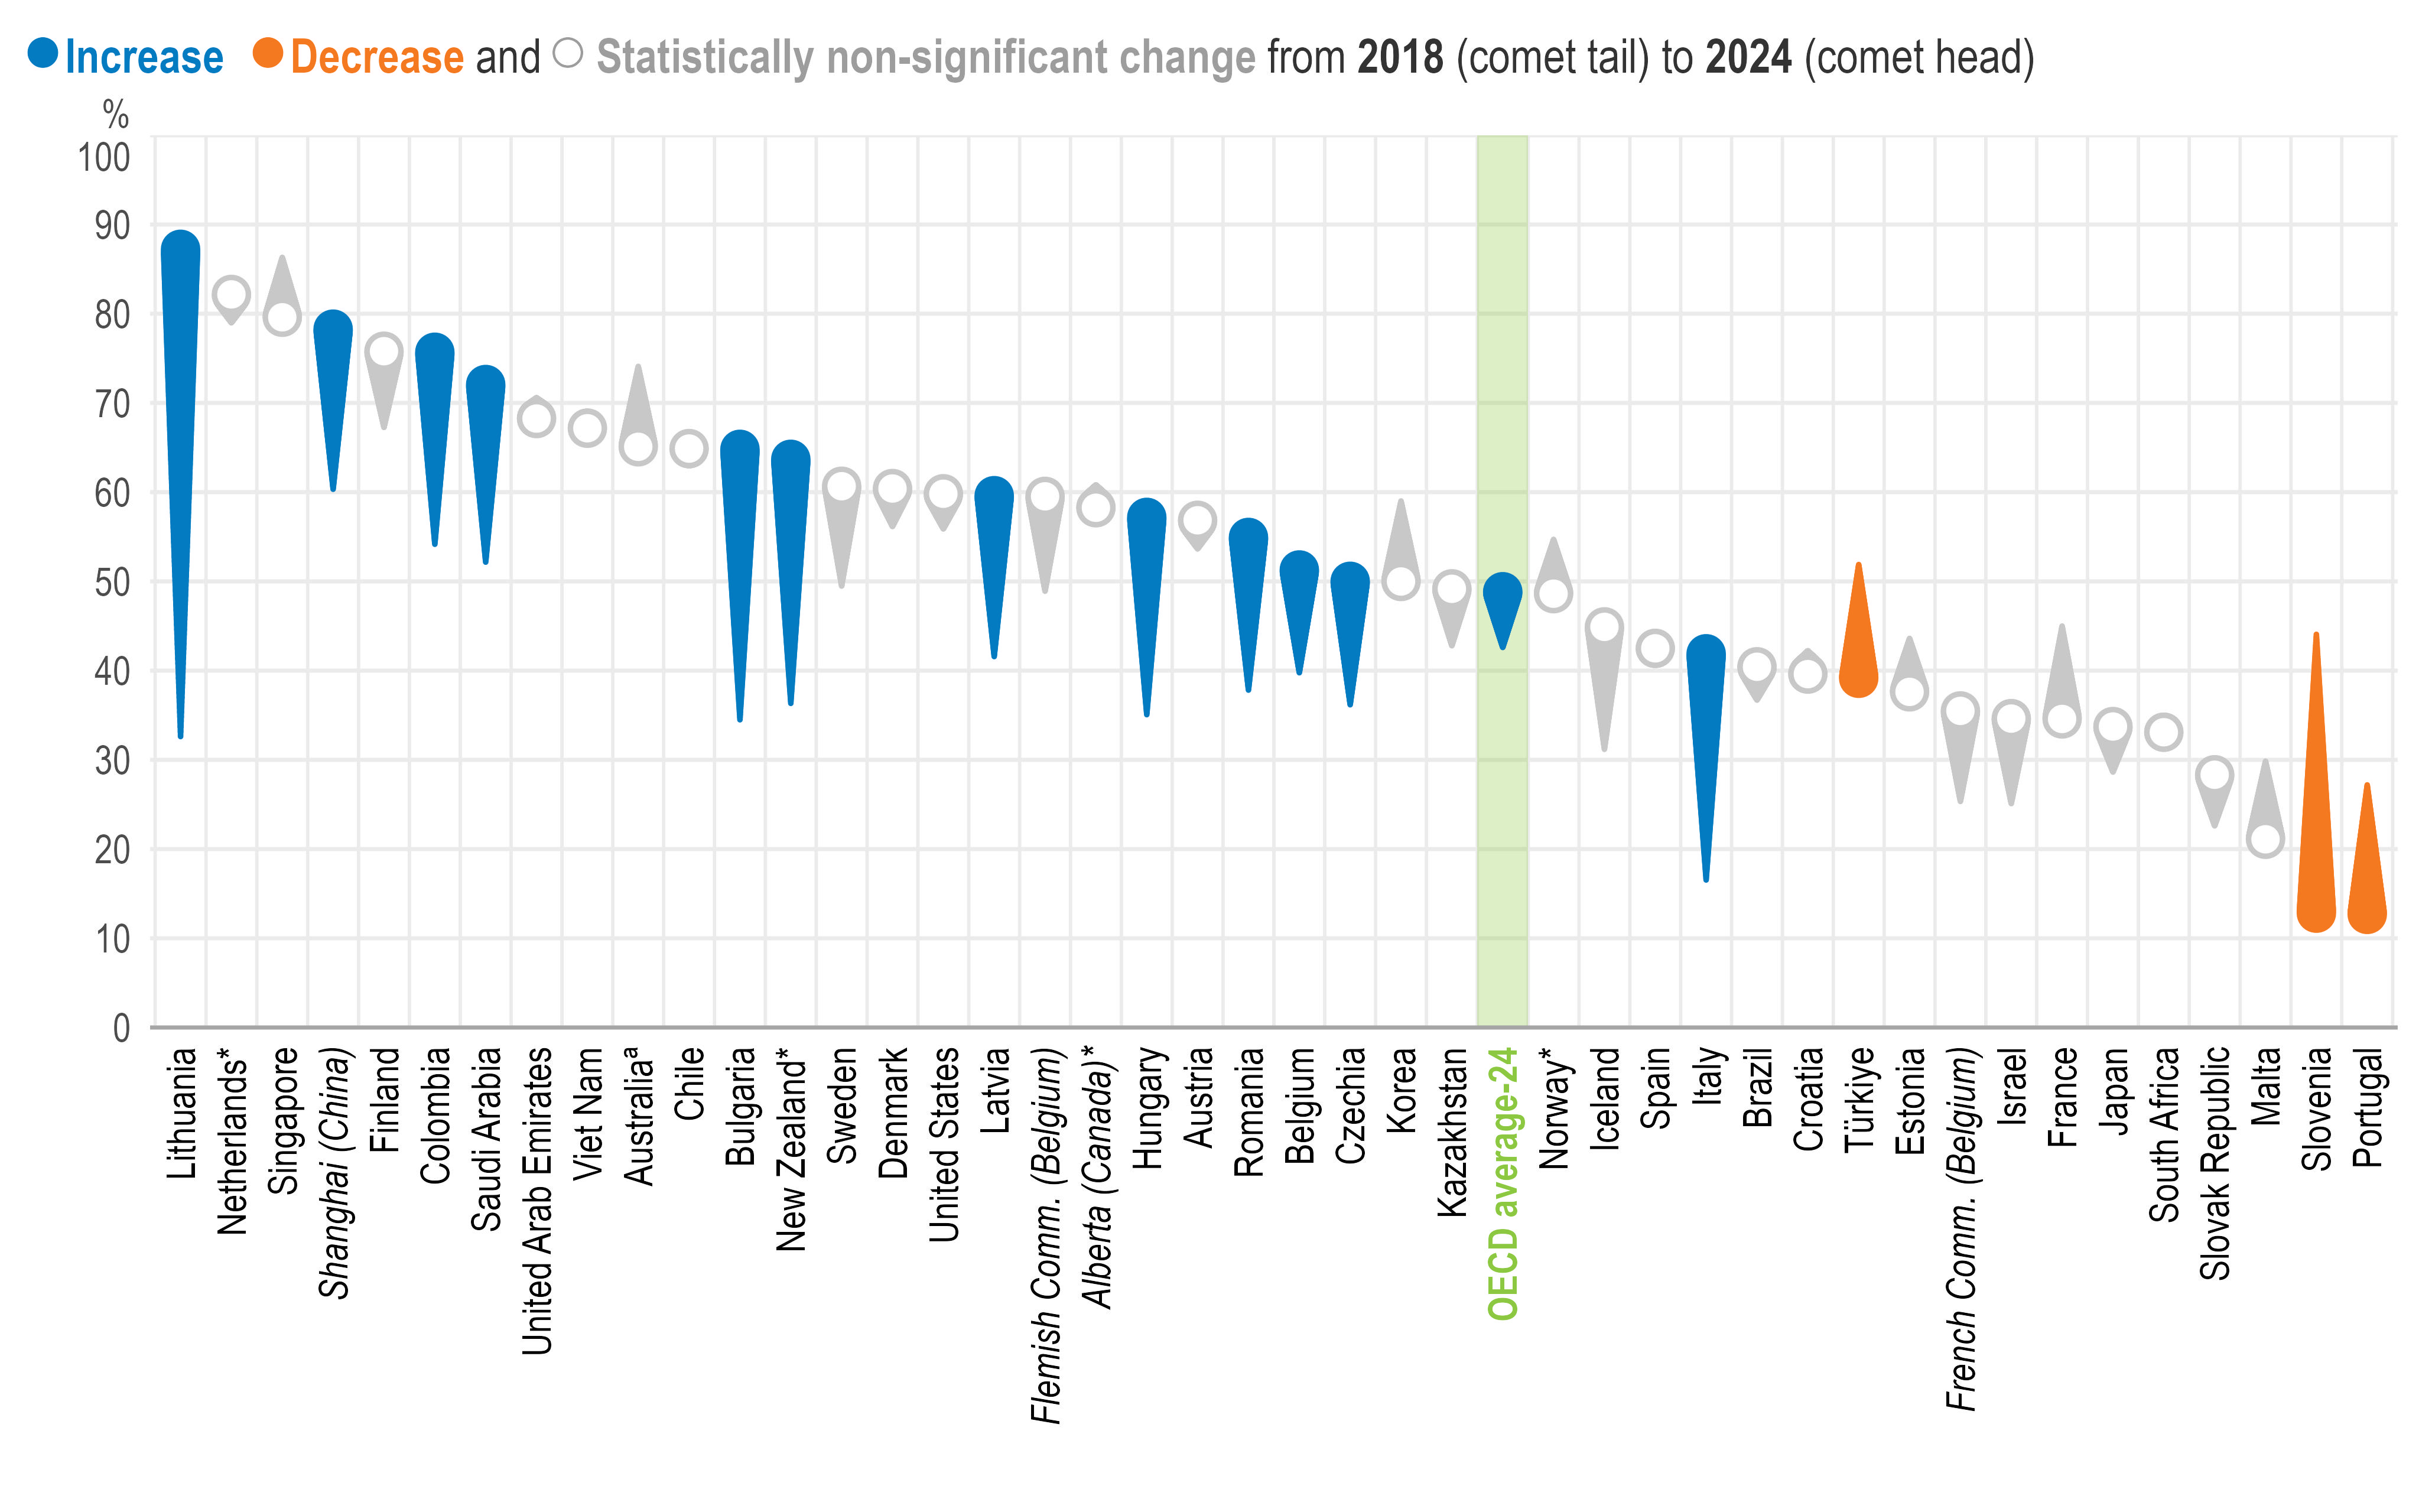
Note: *Estimates should be interpreted with caution due to a higher risk of non-response bias.
ª Estimates for TALIS 2018 and the change between TALIS 2018 and TALIS 2024 should be interpreted with caution due to a higher risk of non-response bias.
Education systems are sorted in descending order by the percentage of lower secondary principals in 2024 who "agree" or "strongly agree" that they are satisfied with their salary.
Source: OECD, TALIS 2018 and TALIS 2024 Databases, Table 4.47.
In 2021, leaders of parliamentary parties signed an agreement on Lithuania's education policy until 2030 establishing a long-term framework for salary growth across the education sector.
Building on this, in 2022 the Ministry of Education, Science and Sports signed a collective agreement with the Lithuanian Trade Union of Educational Institution Leaders to improve the working and economic conditions of school principals. The agreement raised salary coefficients for school principals by 18%, ensuring that the minimum coefficient for a principal would be at least 30% higher than the maximum possible teacher coefficient, with the final salary increase for principals reaching 21% in 2023. The agreement also established additional benefits for trade union members, including double pay for work on rest or public holidays, 3 additional paid annual leave days, 2 paid working days for health improvement and up to 10 paid working days of study leave.
Salary increases have continued beyond 2023, reflecting the ongoing implementation of long-term collective agreements and a broader national commitment to raising salaries across the education sector.
Sources:
Lithuanian Parliamentary Parties (2021), “Agreement on Lithuania's Education Policy (2021–2030)” [Susitarimas dėl Lietuvos švietimo politikos (2021–2030)], https://smsm.lrv.lt/public/canonical/1763620063/7146/Susitarimas%20d%C4%97l%20Lietuvos%20%C5%A1vietimo%20politikos%20(2021%E2%80%932030).pdf
Ministry of Education, Science and Sports of Lithuania (2022), “Collective agreements with trade unions” [Ministerija ir profsąjungos], https://smsm.lrv.lt/lt/struktura-ir-kontaktine-informacija/komisijos-tarybos-ir-darbo-grupes/ministerija-ir-profsajungos/
Ministry of Education, Science and Sports of Lithuania (2022), “Sector collective agreement signed with the Lithuanian Trade Union of Educational Institution Leaders” [Pasirašyta šakos kolektyvinė sutartis su Lietuvos švietimo įstaigų vadovų profesine sąjunga], 23 December 2022, https://smsm.lrv.lt/lt/naujienos-1/pranesimai-ziniasklaidai-1/pasirasyta-sakos-kolektyvine-sutartis-su-lietuvos-svietimo-istaigu-vadovu-profesine-sajunga/
Ministry of Education, Science and Sports of Lithuania (2026), “New collective agreement with trade unions enters into force” [Įsigaliojo nauja kolektyvinė sutartis su profesinėmis sąjungomis], 14 January 2026, https://smsm.lrv.lt/lt/naujienos-1/pranesimai-ziniasklaidai-1/isigaliojo-nauja-kolektyvine-sutartis-su-profesinemis-sajungomis-fRPK/
Non-salary terms
TALIS measures principals’ satisfaction with non-salary employment terms through a single item asking: “Apart from my salary, I am satisfied with the terms of my principal contract/employment (e.g. benefits, work schedule)”, using a four-point response scale ranging from “strongly disagree” to “strongly agree”.
Around two-thirds (66%) of principals are satisfied with their non-salary employment terms, on average, a higher share than for salary satisfaction (Figure 4.10). Levels range from below 35% in France, the French Community of Belgium and Portugal to over 90% in Colombia and the United States.
Percentage of lower secondary principals who “agree” or “strongly agree” that they are satisfied with their terms of employment (excluding salary)1
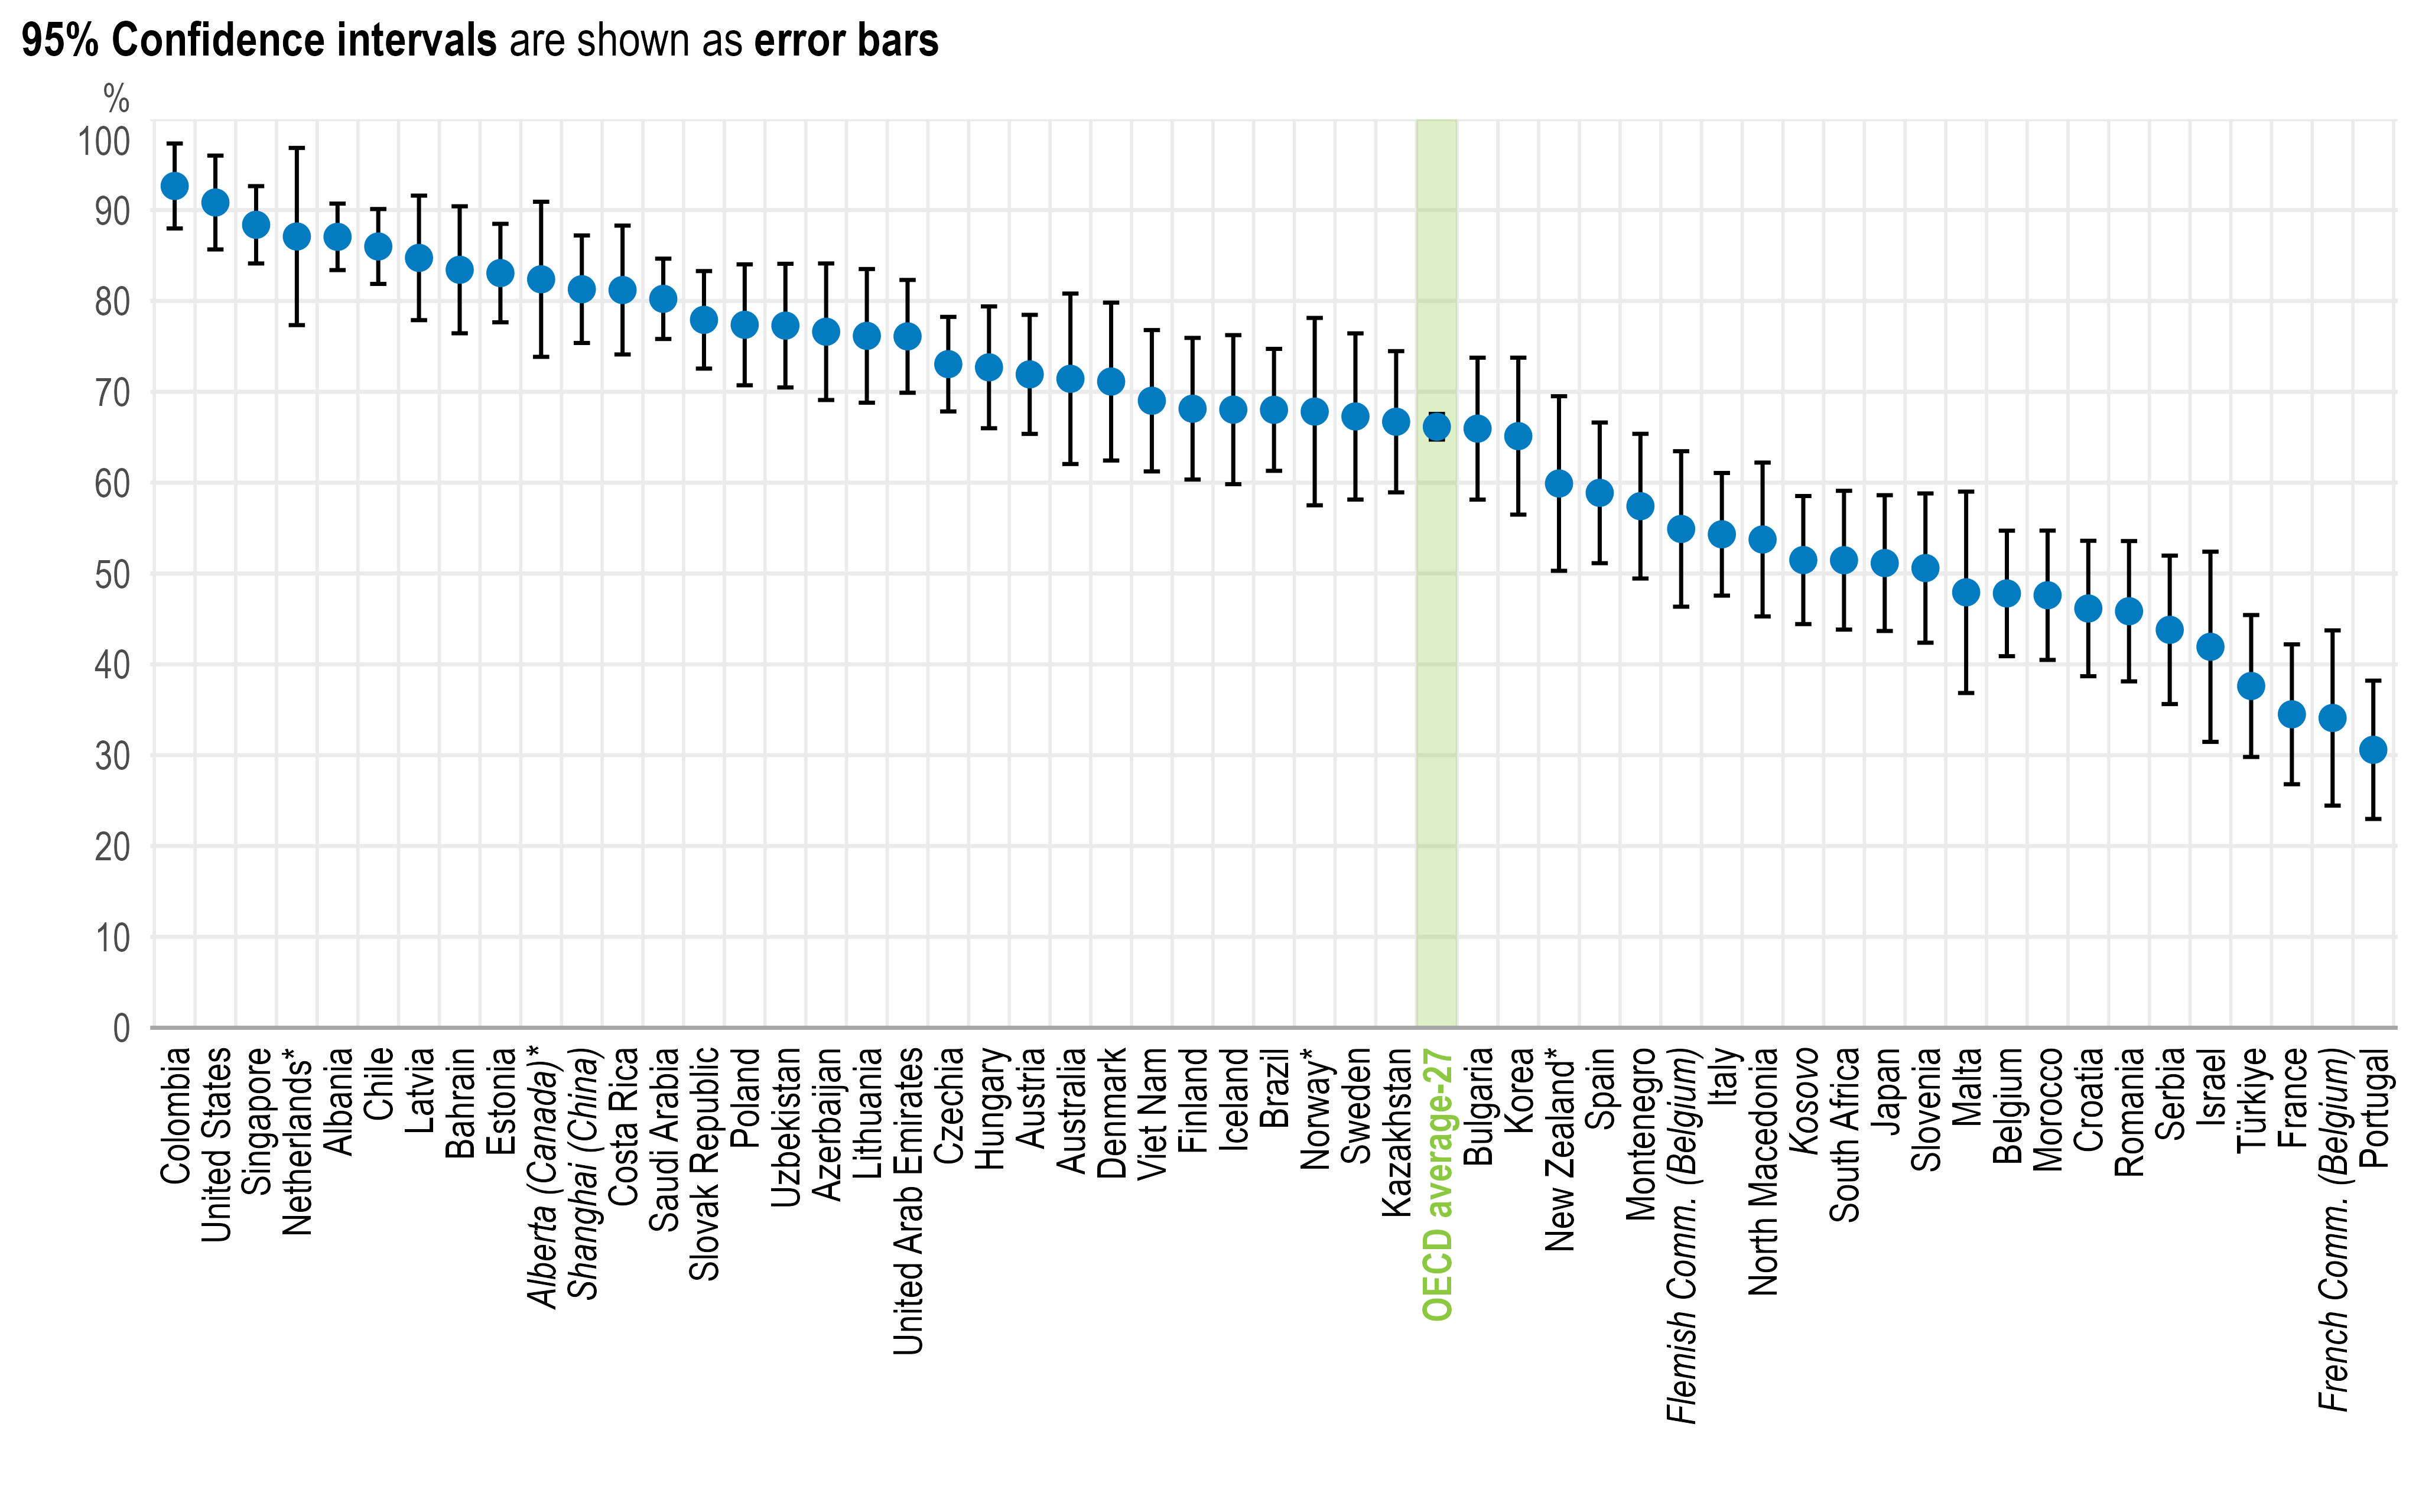
Note: *Estimates should be interpreted with caution due to a higher risk of non-response bias.
A 95% confidence interval shows the range within which the true value is likely to lie, taking into account the uncertainty associated with survey estimates. It shows how precise an estimate is: narrower intervals indicate greater precision, while wider intervals indicate greater uncertainty.
1. For example, benefits and work schedule.
Source: OECD, TALIS 2024 Database, Table 4.48.
Regression analysis shows that, on average, satisfaction with non-salary employment terms is positively associated with job satisfaction (Figure 4.11). Given the association between job satisfaction and valued leadership (Chapter 2, Table 2.25), this suggests an indirect link with valued leadership.
Change in the scale of lower secondary principals' job satisfaction1 associated with principals “agree[ing]” or “strongly agree[ing]” that they are satisfied with their terms of employment (excluding salary)2,3
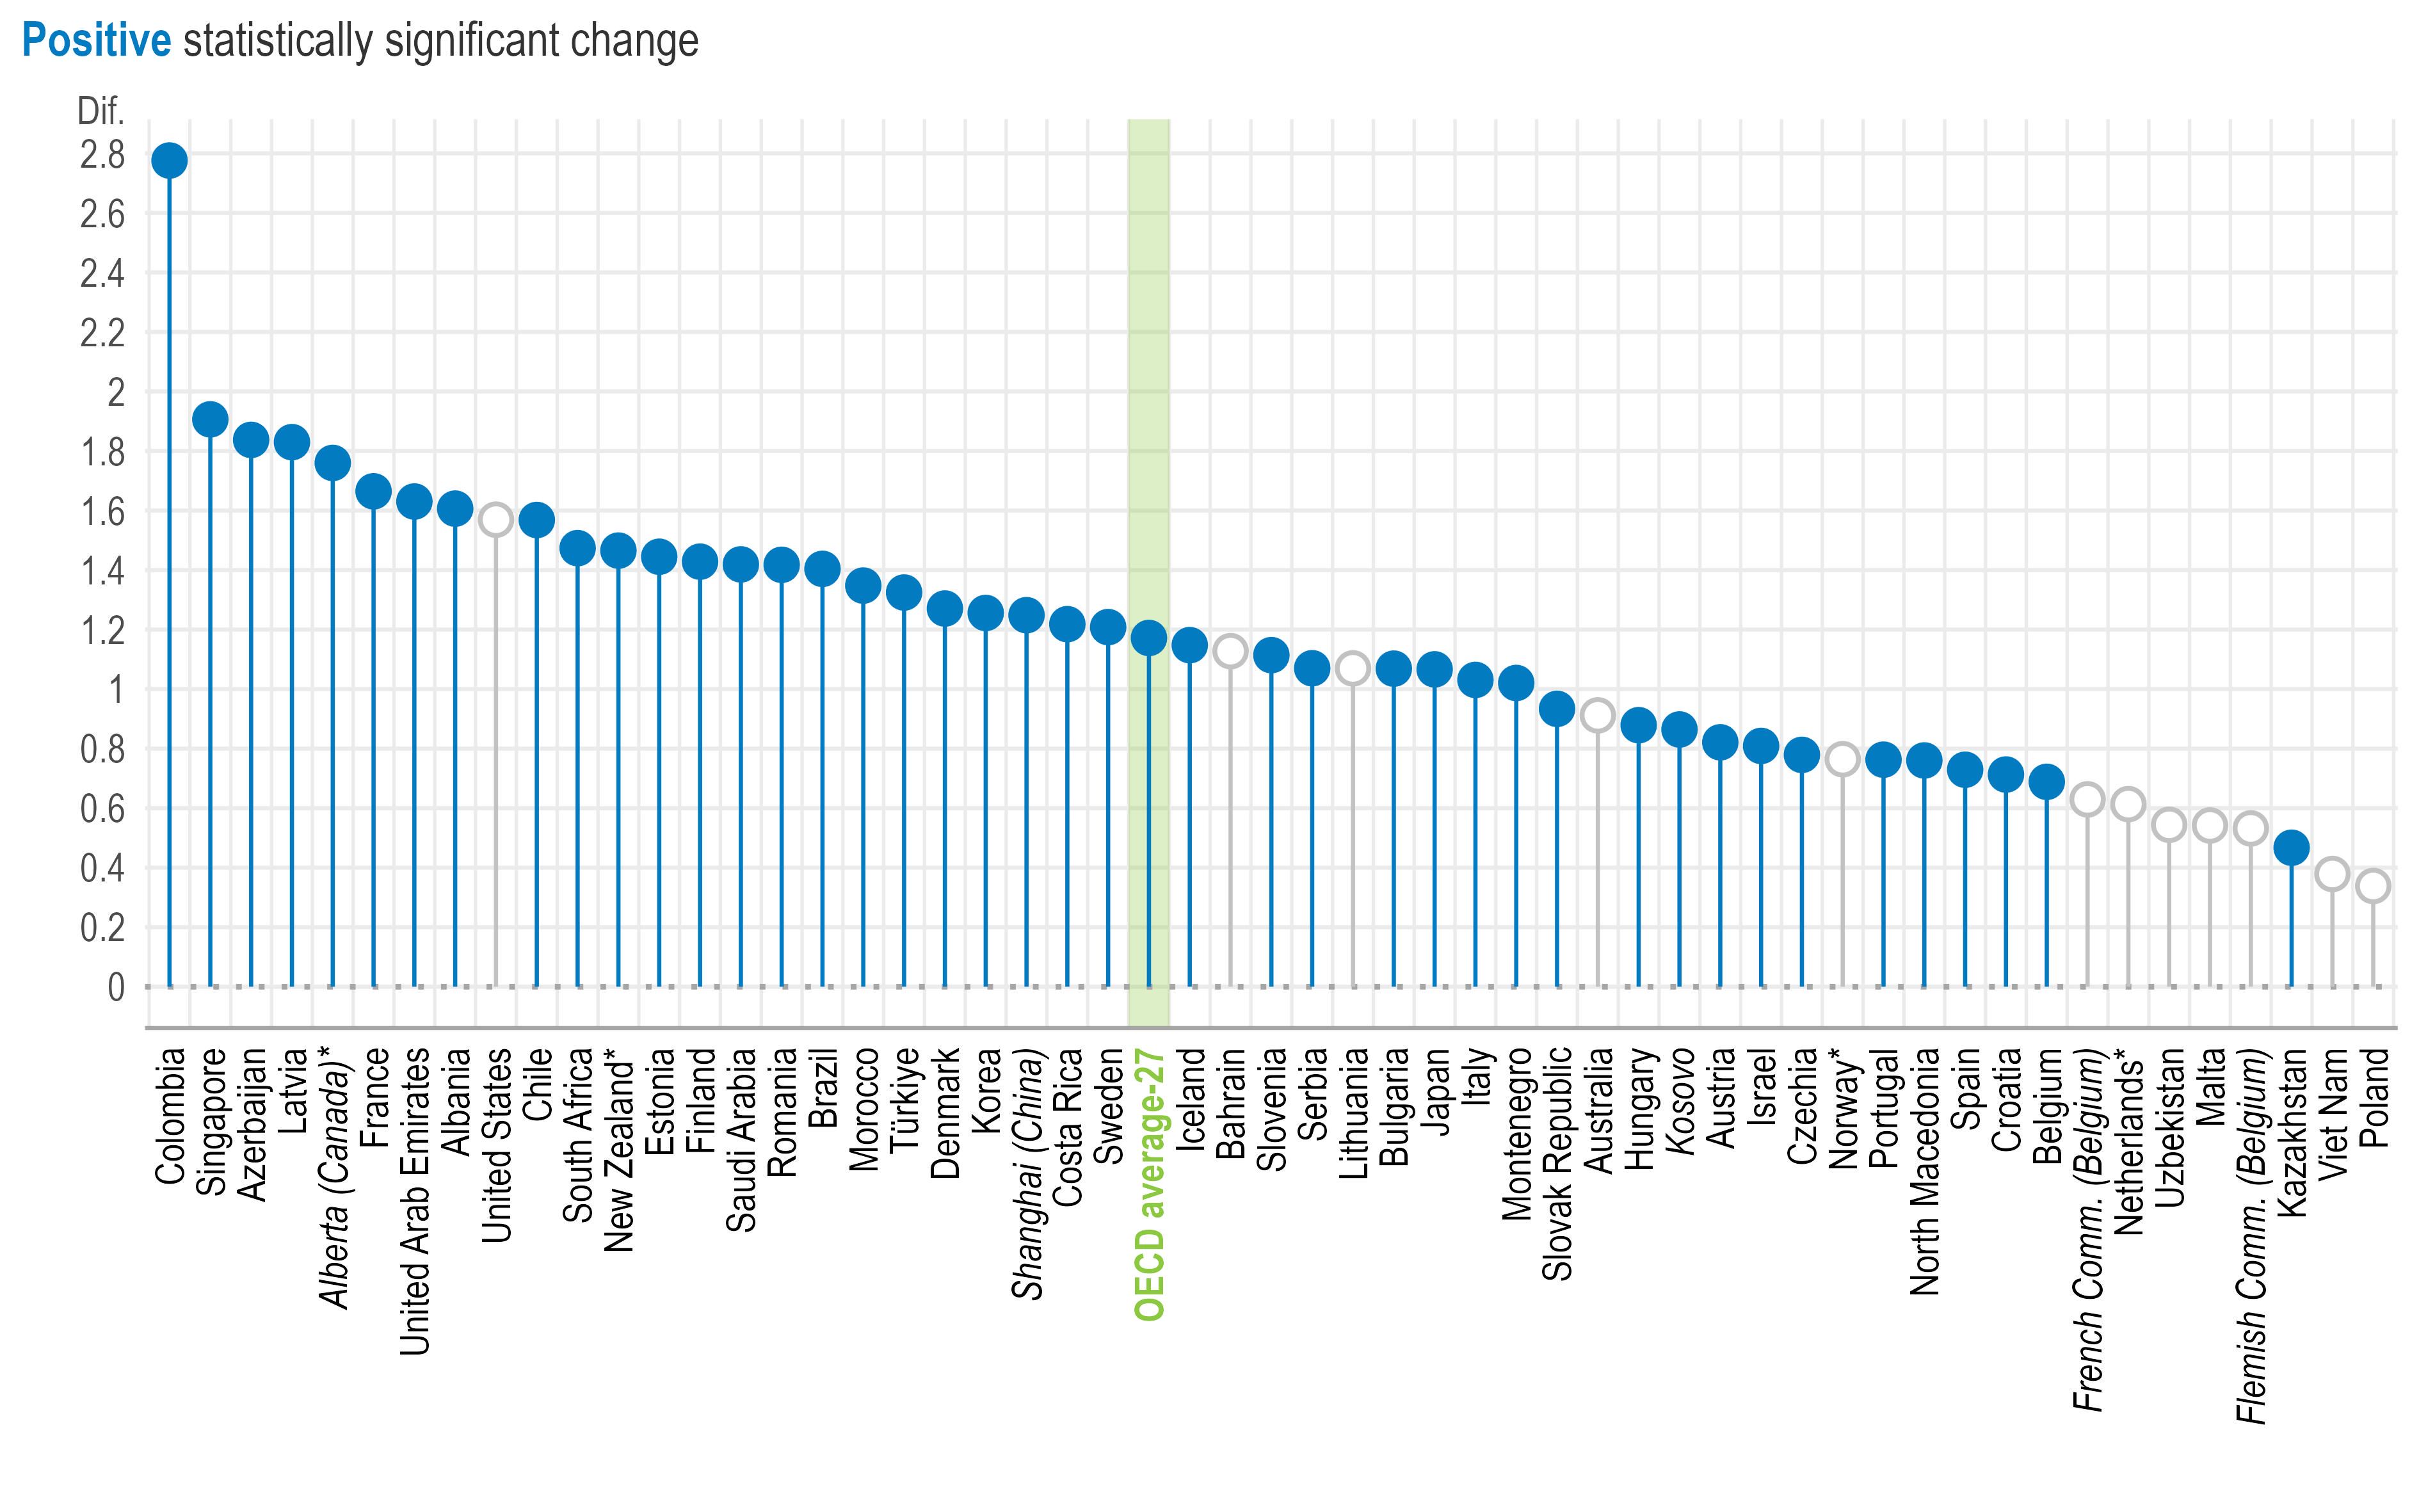
Note: *Estimates should be interpreted with caution due to a higher risk of non-response bias.
Statistically significant coefficients are highlighted with filled circles (see Annex B). Filled circles above 0 indicate a positive association, while those below 0 reflect a negative relationship.
1. Standardised scale scores with a standard deviation of 2 and the value of 10 corresponding to the item mid-point value of the response scale. For more information on the scales, see Annex B.
2. The reference category is “strongly disagree” or “disagree”.
3. Results are based on school-level linear regression analysis controlling for principal characteristics (i.e. gender and age [standardised at the international level]) and school characteristics (i.e. school governance type, school size and school intake of students from socio-economically disadvantaged homes).
Source: OECD, TALIS 2024 Database, Table 4.45.
Older and more experienced principals report higher levels of satisfaction, on average (Figure 4.12). Those aged 60 and over report satisfaction rates around 14 percentage points higher than those under 40. The age difference is steepest in Türkiye (50 percentage points) and Czechia (38 percentage points) (Table 4.55). Similarly, the share of principals who are satisfied with their non-salary employment terms is 7 percentage points higher among more experienced principals than novice principals.
Male principals are more likely to be satisfied with their non-salary employment terms than female principals (68% versus 63%, respectively), though this gap varies considerably across systems and runs in the opposite direction in Morocco and Saudi Arabia, where female principals are more satisfied (Table 4.48).
Percentage-point difference in the share of lower secondary principals who “agree” or “strongly agree” that they are satisfied with their terms of employment (excluding salary)1
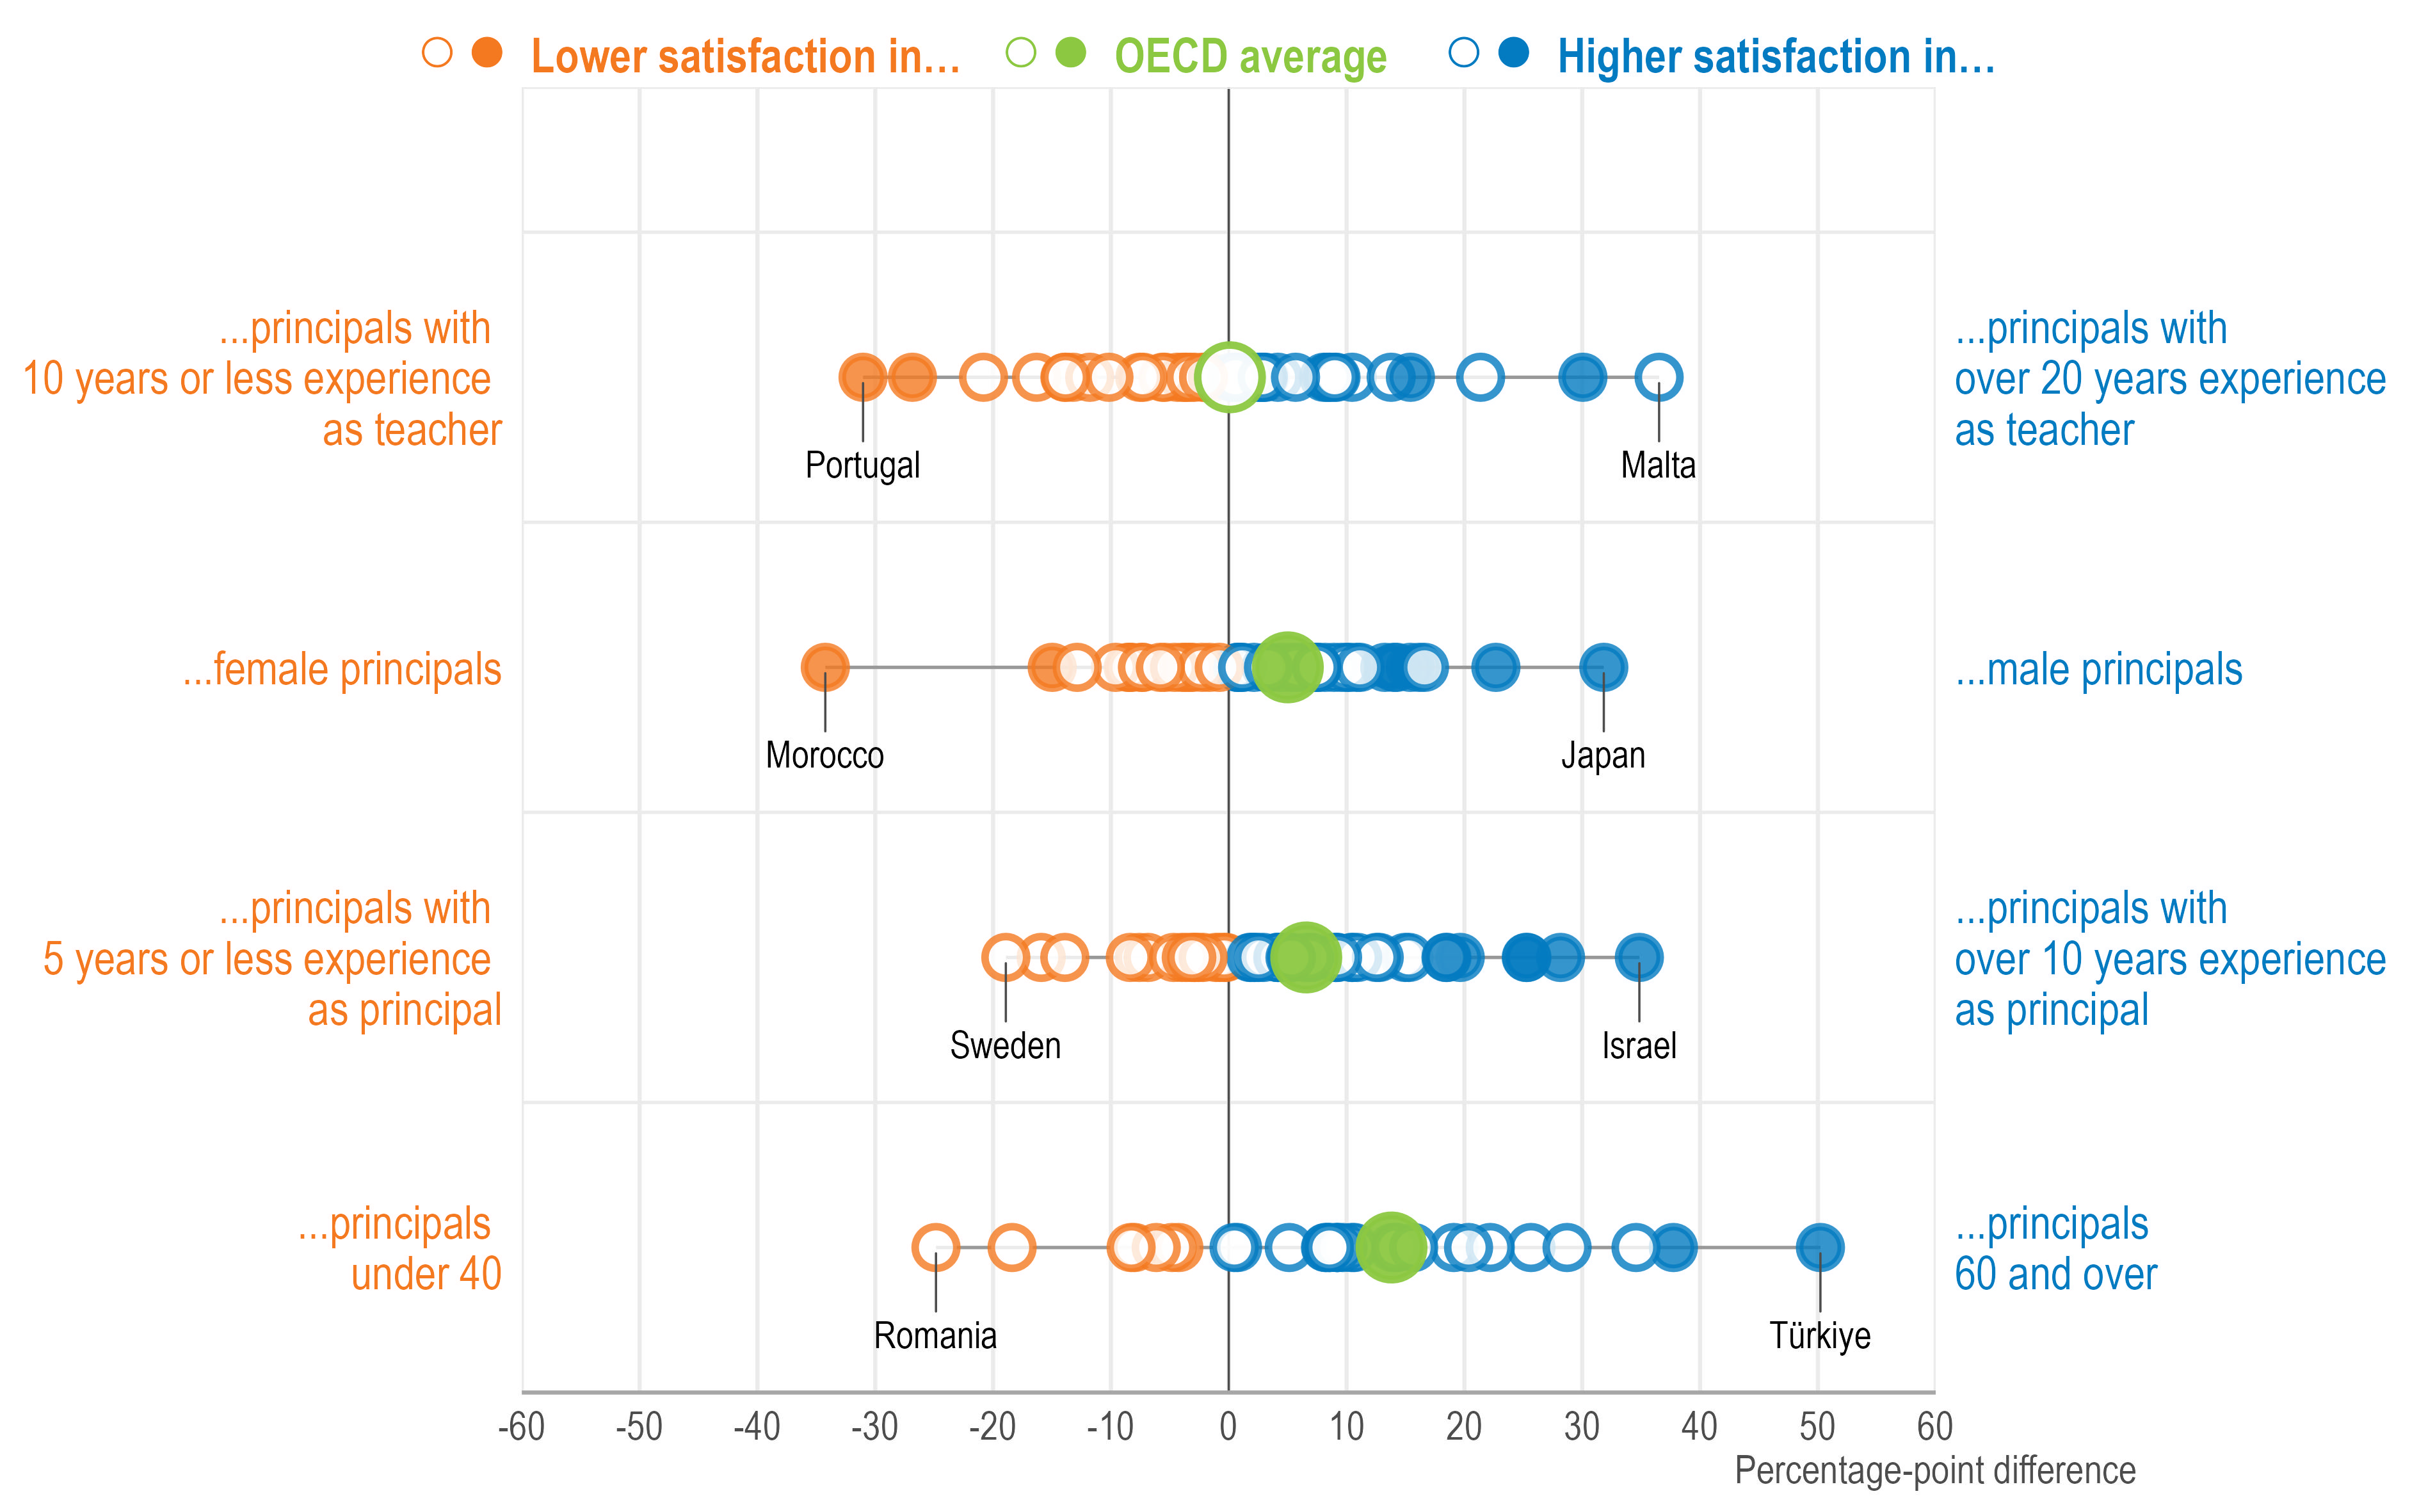
Note: 1. For example, benefits and work schedule.
Source: OECD, TALIS 2024 Database, Table 4.48.
Principals in privately managed schools are more satisfied than those in publicly managed schools, on average (76% versus 64%, respectively) (Table 4.49). The gap is most pronounced in Malta (59 percentage points) and Portugal (47 percentage points). Principals in schools with a larger share of students who experience language difficulties are less satisfied than those in schools with no such students (63% versus 73%, a difference of 10 percentage points). The gap is largest in Australia, France, Morocco and Spain (over 30 percentage points in each system), pointing to a relationship between the intensity of student support needs and how principals perceive their working conditions.
Principals in upper secondary education are more valued when they:
participate in courses on leadership (Tables 4.6 and 4.7).
They also report higher job satisfaction when they:
face fewer material resource shortages that hinder the school's capacity to provide quality instruction (Table 4.25);
are satisfied with their salary and their employment terms (Table 4.45).
Patterns among upper secondary principals differ from those at the lower secondary level in:
Professional learning: On average, more upper secondary principals participate in formal or informal principal networks and in courses on developing strategies on the use of digital resources and tools for teaching than lower secondary principals (Table 4.5).
Decision-making: Upper secondary principals have more responsibility for budgetary, staffing and curriculum decisions than lower secondary principals, on average, though less so for student policies. Responsibility varies markedly by school type and location, with principals in privately managed and urban schools reporting more decision-making responsibility than those in publicly managed and rural schools across all decision areas (Tables 4.36, 4.37, 4.38 and 4.39).
Salary satisfaction: Upper secondary principals report similar levels of satisfaction with their salary as their lower secondary counterparts. However, upper secondary principals in rural and publicly managed schools are less satisfied with their salaries (Table 4.46). Between 2018 and 2024, satisfaction fell by at least 13 percentage points in Portugal, Slovenia and Türkiye (Table 4.47).
Satisfaction with employment terms: Upper secondary principals are more satisfied with their employment terms (excluding salary) than lower secondary principals. Principals in privately managed and large schools (750 students or more) are more satisfied than those in publicly managed schools and small schools (fewer than 250 students) (Table 4.49).
References
[2] Bakker, A. and E. Demerouti (2007), “The Job Demands‐Resources model: State of the art”, Journal of Managerial Psychology, Vol. 22/3, pp. 309-328, https://doi.org/10.1108/02683940710733115.
[3] Boeskens, L., D. Nusche and M. Yurita (2020), “Policies to support teachers’ continuing professional learning: A conceptual framework and mapping of OECD data”, OECD Education Working Papers, No. 235, OECD Publishing, Paris, https://doi.org/10.1787/247b7c4d-en.
[13] Cazes, S., A. Hijzen and A. Saint-Martin (2015), “Measuring and Assessing Job Quality: The OECD Job Quality Framework”, OECD Social, Employment and Migration Working Papers, No. 174, OECD Publishing, Paris, https://doi.org/10.1787/5jrp02kjw1mr-en.
[10] Chen, J., M. Bellibaş and S. Gümüş (2023), “Impact of school climate and resources on principal workload stress and job satisfaction: multinational evidence from TALIS 2018 data”, Journal of Educational Administration, Vol. 61/5, pp. 476-494, https://doi.org/10.1108/JEA-08-2022-0128.
[1] Darling-Hammond, L. et al. (2026), “The principal effect: How investing in school leaders is key to solving education’s challenges”, https://doi.org/10.54300/644.197.
[7] Doyle Fosco, S. (2022), Educational leader wellbeing: A systematic review, Elsevier Ltd, https://doi.org/10.1016/j.edurev.2022.100487.
[5] Dreer, B. and N. Gouasé (2022), “Interventions fostering well-being of schoolteachers: a review of research”, Oxford Review of Education, Vol. 48/5, pp. 587-605, https://doi.org/10.1080/03054985.2021.2002290.
[14] Eurofound and International Labour Organization (2019), “Working conditions in a global perspective”, p. 196, https://doi.org/10.2806/870542.
[11] Hanushek, E., S. Link and L. Woessmann (2013), “Does school autonomy make sense everywhere? Panel estimates from PISA”, Journal of Development Economics, Vol. 104, pp. 212-232, https://doi.org/10.1016/j.jdeveco.2012.08.002.
[6] Karakus, M., M. Toprak and J. Chen (2024), “Demystifying the impact of educational leadership on teachers’ subjective well-being: A bibliometric analysis and literature review”, Educational Management Administration and Leadership, https://doi.org/10.1177/17411432241242629.
[15] OECD (2025), Education at a Glance 2025: OECD Indicators, OECD Publishing, Paris, https://doi.org/10.1787/1c0d9c79-en.
[18] OECD (2025), Teaching and Learning International Survey (TALIS) 2024 Conceptual Framework, OECD Publishing, Paris, https://doi.org/10.1787/7b8f85d4-en.
[9] OECD (2023), Shaping Digital Education: Enabling Factors for Quality, Equity and Efficiency, OECD Publishing, Paris, https://doi.org/10.1787/bac4dc9f-en.
[12] OECD (2018), Education at a Glance 2018: OECD Indicators, OECD Publishing, Paris, https://doi.org/10.1787/eag-2018-en.
[8] OECD (2018), Responsive School Systems: Connecting Facilities, Sectors and Programmes for Student Success, OECD Reviews of School Resources, OECD Publishing, Paris, https://doi.org/10.1787/9789264306707-en.
[16] OECD (2017), Government at a Glance 2017, OECD Publishing, Paris, https://doi.org/10.1787/gov_glance-2017-en.
[4] Pont, B., D. Nusche and H. Moorman (2008), Improving School Leadership, Volume 1: Policy and Practice, OECD Publishing, Paris, https://doi.org/10.1787/9789264044715-en.
[17] Workplace Gender Equality Agency (2025), “Ages and Wages”, https://www.wgea.gov.au/sites/default/files/documents/251029-Ages-and-wages-V8-final.pdf (accessed on 18 September 2026).
← 1. This report defines valued leadership based on teachers’ views about their principals’ instructional and relational leadership. The conceptualisation of valued leadership is guided by the Teaching and Learning International Survey (TALIS) 2024 Conceptual Framework (OECD, 2025[18]), which identifies instructional and relational leadership as key domains of school leadership. To note, TALIS does not survey teachers about their views on other important aspects of principals’ leadership, such as managerial leadership. Moreover, the instructional and relational leadership scales, which are based on teachers’ perceptions, may partly reflect principals’ popularity rather than leadership quality. Principals who make difficult but necessary decisions may consequently be viewed less favourably, even when their leadership is highly effective.
← 2. The instructional leadership scale (T4INSTLE) summarises teachers’ responses to three four-point agreement items (“strongly disagree”; “disagree”; “agree”; “strongly agree”) about their school principal. The scale is constructed using latent variable modelling within a confirmatory factor analysis (CFA) framework and is based on the following items: “The principal encourages co-operation among teachers to develop new teaching practices”; “The principal ensures that teachers take responsibility for improving their teaching skills”; “The principal ensures that teachers feel responsible for their students’ learning outcomes”. Standardised scale scores with a standard deviation of 2 and the value of 10 corresponding to the item mid-point value of the response scale.
← 3. The relational leadership scale (T4RELEAD) summarises teachers’ responses to four four-point agreement items (“strongly disagree”; “disagree”; “agree”; “strongly agree”) about their school principal. The scale is constructed using latent variable modelling within a confirmatory factor analysis (CFA) framework and is based on the following items: “The principal has a clear vision for this school”; “The principal encourages all staff to have a say on important decisions”; “The principal has good professional relationships with staff”; “The principal has good professional relationships with parents or guardians”. Standardised scale scores with a standard deviation of 2 and the value of 10 corresponding to the item mid-point value of the response scale.
← 4. Descriptive statistics for the control variables can be found in the online TALIS 2024 Statistical Compendium.
← 5. Coefficients for the OECD and TALIS averages may be statistically significant even when country-level coefficients are statistically significant in only a small number of participating education systems. As such, these average results may not reflect a consistent pattern across education systems.
← 6. Based on 2015 compensation data reported in Government at a Glance 2017, the estimated ratio of middle managers’ compensation to that of professionals in public administration ranges from 1.26 to 1.97 (OECD, 2017[16]). The lower bound compares D4 managers (leaders of specific professional teams) with senior professionals, while the upper bound compares D3 managers (heads of directorates or administrative units) with junior professionals.