This chapter examines territorial trends on demography, housing, accessibility, digital connectivity, environment and land-use patterns, across FRAs and FUAs. Unlike Chapters 3 and 4, which adjust FRA parameters specifically to compare against LMAs, the analysis in this chapter relies on optimal FRA boundaries. Most indicators are presented by degree of rurality, classifying each functional area according to the size of its largest settlement. A separate analysis groups FRAs by demographic change trajectory (growing, stable or declining) to examine the relationship between demographic change and the expansion of built-up areas. The results reveal systematic territorial differences that broader regional classifications may conceal.
The Geography of Choice
Mapping Everyday Lives across Rural Regions

Abstract
The analysis classifies functional areas according to the type and total population of the settlement with the largest population overlap1. To qualify, the settlement must lie in the same country as the functional area and at least 2 500 of its residents must live within the functional area.2
The analysis distinguishes three categories of functional rural areas (FRAs):
FRA with a village but no town3
FRA with a town between 2 500 and 15 000 people
FRA with a town4 of 15 000 to 50 000 people
The analysis applies a corresponding classification to FUAs, based on the total population of the settlement with the largest population overlap:5
FUA with a city below 100 000 people6
FUA with a city between 100 000 and 250 000 people
FUA with a city between 250 000 and 1 000 000 people
FUA with a city of over 1 000 000 people
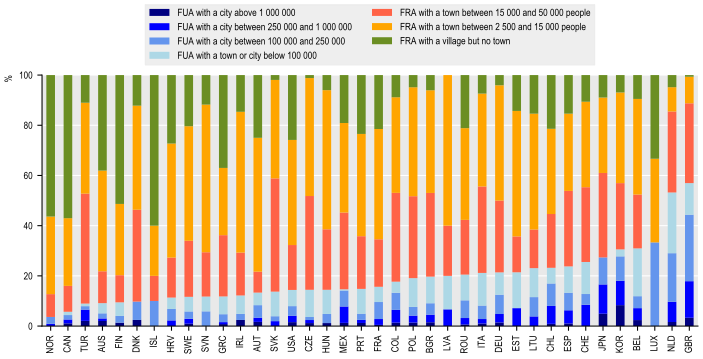
Before turning to how outcomes vary across the settlement size, it is useful to examine the distribution of FRAs and FUAs for each of the 38 OECD member countries. Figure 5.1 shows the share of all delineated functional areas within each country falling into each of the seven settlement categories. This measures the number of functional areas of each type.
On an unweighted average across the 38 countries, FRAs account for 81.1% of all functional areas, against 18.9% for FUAs. Within FRAs, the largest single category is FRAs with a town of 2 500 to 15 000 people which corresponds to 38.6% of all functional areas, followed by FRAs with a town of 15 000 to 50 000 people (23.6%) and FRAs with a village but no town (18.8%). Within FUAs, smaller city-size tiers account for a larger share of area counts than larger ones: FUAs below 100 000 make up 7.5% of all functional areas, compared with just 1.4% for FUAs above one million people.
This pattern reflects the underlying geography and shows how rural catchments are typically delineated over larger and more numerous areas than the commuting zones around major cities. This implies that most countries contain many FRAs alongside comparatively few FUAs, even where the reverse is true of population. Norway, Canada and Turkey have the highest FRA share of area counts (over 90% each), while the United Kingdom and the Netherlands are the only two countries where FUAs account for more than half of all functional areas. This reflects their high levels of urbanisation and compact territories, where dense networks of cities and their commuting zones leave comparatively little land outside FUAs.
Share of functional areas by type, 2025 or latest year available
Note: 38 countries covered. NZL, ISR and CRI excluded.
Source: OECD Regions, Cities and Local Areas database http://oe.cd/geostats.
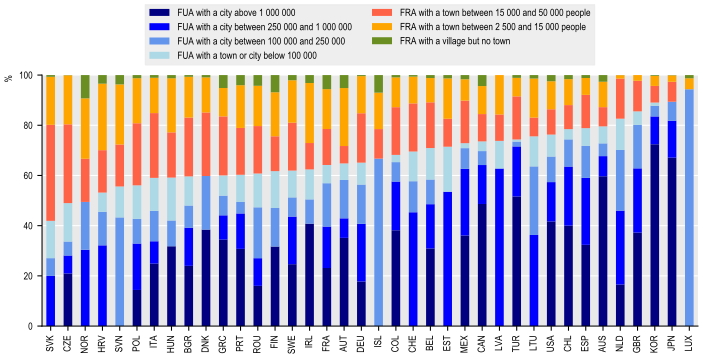
The distribution of national population across the seven functional area categories is shown next in Figure 5.2. On average (unweighted across the sample), FUAs account for 67.5% of national population, across 37 OECD countries against 32.5% for FRAs. These figures are consistent with previously reported OECD estimates of the share of population living in FUAs (OECD, 2022[1]).
The distribution varies considerably across the sample. FUA population shares are highest in Luxembourg (94%), Korea (89%) and Japan (89%) and lowest in Slovak Republic (42%), Czechia and Norway (49%). These three countries have a larger share of the population living in FRAs with 58.2% in Slovakia, 51% in Czechia and Norway and the remaining OECD holds a majority of its population in FUAs.
This contrasts with the distribution of functional areas (i.e. Figure 5.1), where FRAs account for the large majority of areas in all but two countries. Rural catchments are typically larger and more numerous than urban catchments, but hold a smaller share of population, while urban catchments are fewer in number but concentrate most of the population.
Share of national population by functional area type, 2025 or latest year available
Note: 38 countries covered. NZL, ISR and CRI excluded.
Source: OECD Regions, Cities and Local Areas database http://oe.cd/geostats.
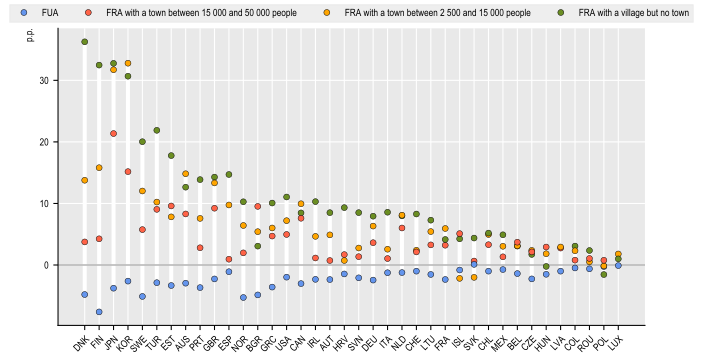
Old-age dependency ratios, defined as the ratio of people aged 65 and older and those aged 15-64, increase with rurality (Figure 5.3). FUAs exhibit systematically lower dependency ratios than the national average. On average, across OECD countries, the old-age dependency ratio in FUAs is 2.3 percentage points below the national value. In contrast, FRAs display on average a 4.5 points higher percentage point deviation for FRAs with a town of 15 000-50 000, 7 points higher for FRAs with a town of 2 500-15 000, and 10.8 points higher for FRAs with a village but no town. FRAs show higher dependency rates than nationally across all three sub-categories with the exception of Iceland, Slovakia, Hungary and Poland.
Cross-country differences are substantial. Denmark records the largest gap in the most rural category, at 36.2 percentage points, followed by Finland, Korea and Japan, all above 30 percentage points. Poland is the only country in which the ratio for this category is below the national average, by 2 points.
This pattern is broadly consistent with OECD's work on rural demography showing that remote rural regions have both the highest old-age dependency ratios and the largest increases (OECD, 2025[2]). Figure 5.4 examines whether international migration may partly offset these demographic pressures.
Old-age dependency ratio, deviation from national average, p.p., 2025 or latest year available
Note: 38 countries covered. NZL, ISR and CRI excluded.
Source: OECD Regions, Cities and Local Areas database http://oe.cd/geostats.
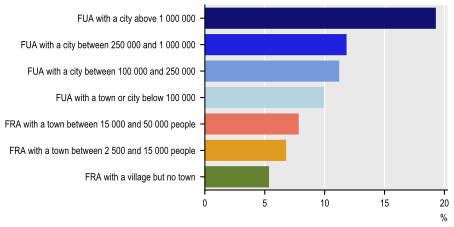
The foreign-born share also follows a clear settlement gradient (Figure 5.4). It averages 19.3% in FUAs with more than 1 000 000 people, followed by 11.8%, 11.2% and 9.9% across the smaller FUA categories. The share falls to 7.8% and 6.8% in FRAs containing a town and to 5.4% in FRAs with a village but no town.
The higher concentration of foreign-born population in urban areas is consistent with previous OECD research (OECD, 2022[1]). Cities tend to attract a large share of international migrants, as well as younger people moving within countries. The most rural FRAs therefore combine higher old-age dependency ratios with lower shares of foreign-born residents. This suggests that migration currently contributes less to demographic renewal in the areas where population ageing is most pronounced.
Share of foreign-born population by functional area type, OECD average, 2025 or latest year available
Note: 36 countries included. IRL, TUR, KOR, COL, CRI, JPN and ROU excluded due to data availability.
Source: OECD Regions, Cities and Local Areas database http://oe.cd/geostats.
Figure 5.5 displays growth in built-up areas between 2010 and 2020 using the demographic-change typology developed in (OECD, 2025[3]). Across all categories, built-up areas have increased during the 10-year period around 14.4% on average in growing FRAs, 12.4% in stable FRAs and 11.7% in declining FRAs. Expansion in declining FRAs indicates that population loss has not been accompanied by a contraction of the physical footprint that requires infrastructure and services7.
Growth in built-up area, 2010-2020, by population trajectory
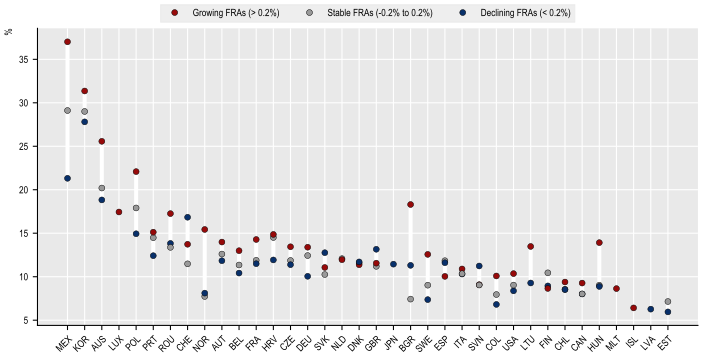
Note: The demographic change classification is here computed based on the average annual population change rate over the past 10 years of data available in each country, e.g. a growing FRA corresponds to a FRA for which the average annual population change rate over the past 10 years is higher than 0.2%. 36 countries covered. IRL, TUR, GRC, NZL, CRI and ISR not included.
Source: OECD Regions, Cities and Local Areas database http://oe.cd/geostats based on Pesaresi M., Politis P. (2023): GHS-BUILT-S R2023A - GHS built-up surface grid, derived from Sentinel2 composite and Landsat, multitemporal (1975-2030), European Commission, Joint Research Centre (JRC), PID: http://data.europa.eu/89h/9f06f36f-4b11-47ec-abb0-4f8b7b1d72ea, doi: 10.2905/9F06F36F-4B11-47EC-ABB0-4F8B7B1D72EA
Dwelling vacancy also increases with rurality (Figure 5.6). On average, the share of unoccupied dwellings in FUAs is 3.0 percentage points below the national average. By contrast, it is 2.8 points above the national average in FRAs with a town of 15 000 to 50 000 inhabitants, 5.8 points above in FRAs with a town of 2 500 to 15 000 inhabitants, and 11.5 points above in FRAs with a village but no town.
This pattern is widespread across countries. In 34 of the 37 countries covered, the vacancy rate in the most rural FRA category exceeds the national average; the same number of countries record a below-average rate in FUAs. Sweden shows the largest positive difference for the most rural category (11.5 points), followed by Croatia, Spain, Italy and Greece. Poland and Luxembourg are the only countries in which vacancy in this category is below the national average.
These trends are consistent with previous OECD work ( (OECD, 2021[4]), (OECD, 2023[5])) showing that housing supply has often failed to keep pace with demand in employment-rich urban areas. Higher vacancy in the most rural areas may reflect several factors, including population decline associated with low fertility and outmigration, and a high share of older people. Together, these trends can reduce household formation and the number of potential occupants available to replace households that disappear or relocate. In some countries, it may also reflect seasonal or second-home use, since dwellings occupied for only part of the year may be recorded as unoccupied. The indicator should therefore not be interpreted as measuring surplus housing caused by demographic decline alone.
Unoccupied dwelling share, deviation from national average, p.p., 2025 or latest year available
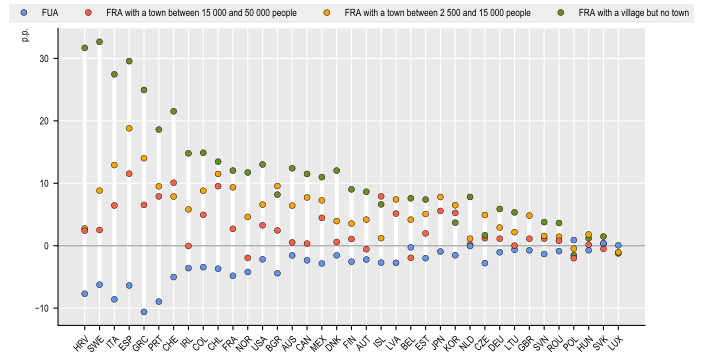
Note: positive figures in the graph refer to more vacancy (e.g. higher unoccupied dwelling share). 37 countries included. TUR, NZL, CRI and ISR not included.
Source: OECD Regions, Cities and Local Areas database http://oe.cd/geostats.
Figure 5.7 compares mean rent for 13 OECD countries where data are available. Rents in FUAs are on average around 9% higher than the national average. In contrast, rents are below the national average in every FRA category: by 21% in FRAs with a town of 15 000-50 000, 30 in FRAs with a town of 2 500-15 000, and 33 in FRAs with a village but no town.
This is broadly consistent with the previous trends in dwelling vacancy (Figure 5.6): lower vacancy and higher rents in FUAs both indicate tighter housing markets.
Mean rent, deviation from national average, %, 2024 or latest year available
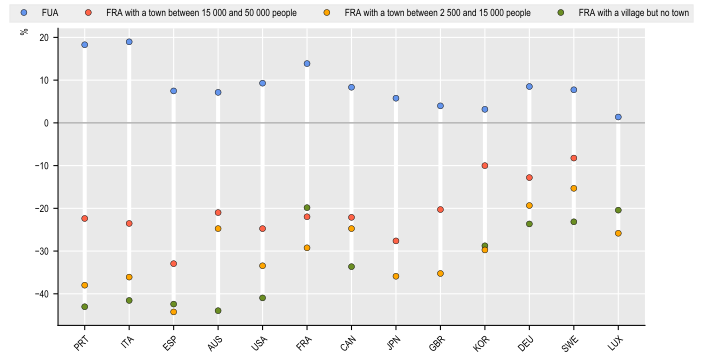
Note: The variable used is the average rent per square metre (m²) in DEU, ESP, FRA, KOR, ITA, PRT and SWE, and the average rent in AUS, CAN, GBR, JPN, LUX, MLT, NZL and USA.
Source: OECD Regions, Cities and Local Areas database http://oe.cd/geostats.
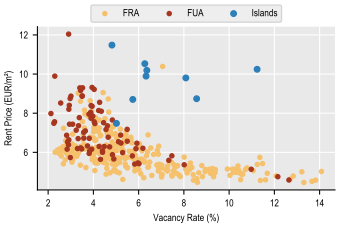
The relationship between dwelling occupancy and rent price across functional-area-level data is examined more in detail for Germany (Figure 5.8). In functional areas with tight housing markets, there is a strong association between fewer vacancies and higher rents, including in most German FUAs but also a considerable number of FRAs. The association weakens for functional areas with more vacant housing units; once the vacancy rate in a functional area surpasses approximately 8%, more vacant dwellings are no longer associated with lower rents.
A small group of eight FRAs, German islands, are a clear exception to the general pattern. They show rents well above what their occupancy levels alone would predict, probably because seasonal or amenity-related demand shapes these housing markets.
Rent price and dwelling vacancy, functional areas, Germany, 2022
Source: OECD Regions, Cities and Local Areas database http://oe.cd/geostats based on 2022 German census.
Figure 5.9 compares the share of residents unable to reach a general hospital within 45 minutes across 18 OECD countries; Figure 5.10 maps the indicator for Spain and Portugal. In FUAs, the share with access above 45 minutes is 3.3 percentage points below the national average. It rises progressively with rurality: 1.9 points above the national average in FRAs with a town of 15 000 to 50 000 people, 5.5 points above in those with a town of 2 500 to 15 000 people, and 29.5 points above in FRAs with a village but no town.
The gap in the most rural category is heavily influenced by the Netherlands, at 99.8 points, nearly 1.5 times the next-highest country (Sweden, at 65.5). Czechia is the only country where this category shows better-than-average access (-0.5 points).
This pattern is consistent with broader OECD evidence that, after adjusting for population, hospital bed rates are almost 50% lower in regions far from metropolitan areas than in metropolitan areas, and that this gap has been widening over time (OECD, 2022[1]). Hospitals require a minimum catchment population to remain viable, making dispersed areas without a town of meaningful size less likely to have a facility within reasonable driving distance.
Hospital access within 45 minutes, deviation from national average, p.p., 2022 or latest year available
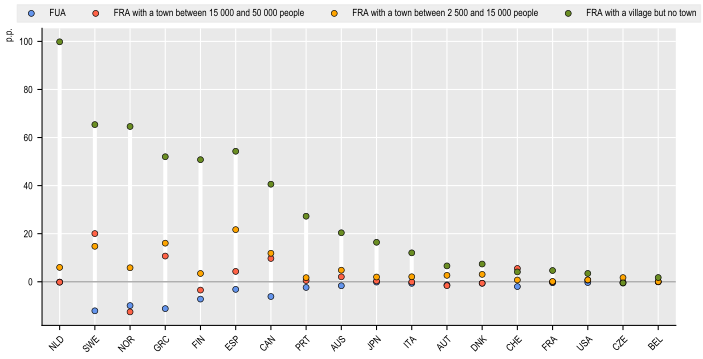
Note: Values represent the deviation in the share of population unable to reach a general hospital within 45 minutes' driving time, relative to the national average. Positive values indicate worse access (a higher share of the population without access); negative values indicate better access.
Source: OECD Regions, Cities and Local Areas database http://oe.cd/geostats.
Hospital access differs markedly between Spanish and Portuguese FRAs (Figure 5.10). Spain showed one of the largest hospital access gaps (Figure 5.9) when compared to OECD countries, with an average share of population in FRAs unable to reach a hospital within 45 minutes of 28%, more than three times the average (8.5%) across Portuguese FRAs. The map in Figure 5.10 shows how access gaps in Spain are concentrated in the interior and along parts of the Spain-Portugal border, while FRAs closer to the coast and to major cities generally show better access. Portugal's lower share may partly reflect its more even population distribution.
Share of population unable to reach a hospital within 45 minutes, by functional rural area, Spain and Portugal, 2022 or latest year available

Source: OECD Regions, Cities and Local Areas database http://oe.cd/geostats.
Internet speeds also decline with rurality (Figure 5.11). Fixed internet download speeds in FUAs average 7.5 percentage points above the national value. Internet speed declines linearly with rurality, standing 14.1 percentage points lower than nationally for FRAs with a town of 15 000-50 000, 21.8 lower for FRAs with a town of 2 500-15 000, and 33.6 lower for FRAs with a village but no town.
The range across countries is wide with Colombia, Mexico and the United Kingdom showing the largest overall gap (between highest and lowest), while Hungary, France Korea, Denmark and Slovenia show the smallest. In countries including Colombia, Estonia, Greece, Latvia, Lithuania, Mexico and Spain, the most pronounced divide is between FUAs and all three FRA categories. Elsewhere, fixed internet download speeds decline more gradually across the settlement hierarchy8.
This connectivity divide compounds the accessibility challenges to hospital services previously discussed in this chapter. Good digital connectivity is increasingly a prerequisite for accessing services, including e-health consultations and remote diagnostics, and e-education and remote learning, which depend on adequate broadband to function as substitutes for in-person provision (OECD, 2021[6]). Despite progress in recent years, a significant geographic divide persists and remains most pronounced in the most remote rural areas (OECD, 2021[7]), (OECD, 2025[8]).
Internet download speed, deviation from national average, p.p., 2025
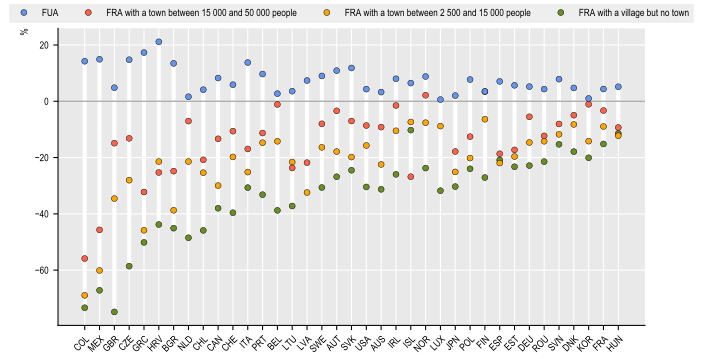
Note: Speed tests here refer to fixed devices and exclude mobile devices.
Source: OECD Regions, Cities and Local Areas database http://oe.cd/geostats based on speed tests by Ookla Global Fixed and Mobile Network Performance Maps
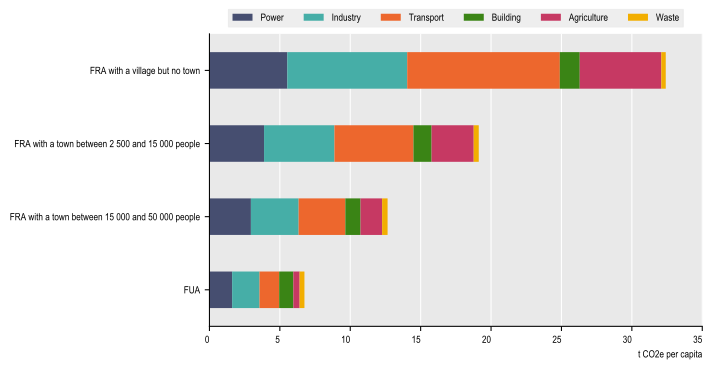
Figure 5.12 and Figure 5.13 show levels and changes in per-capita greenhouse gas emissions by sector. Per-capita emissions from transport, industry, power and buildings are higher in FRAs than in FUAs, although the size and pattern of these differences vary across FRA categories. Unsurprisingly, given the concentration of agricultural activity in rural areas, agriculture accounts for the largest gap. Consequently, total per-capita emissions increase sharply with rurality: FRAs with a village but no town emit almost twice as much as FRAs with a town between 2 500-15 000, roughly 2.5 times more than FRAs with a town between 15 000-50 000, and around five times more than FUAs.
These differences reflect a combination of household consumption patterns and the location of emissions-generating activities. Rural dwellings, for example, tend to be larger and less energy-efficient than urban dwellings, while rural residents often travel longer distances to access jobs and services. At the same time, the indicators analysed here attribute greenhouse gas emissions to the place of production. Power generation, heavy industry and large-scale agriculture are disproportionately located in rural areas, although the energy and goods they produce serve the wider population, including urban residents.
This pattern is consistent with existing OECD research on the important role rural regions play in electricity generation and renewable energy. Remote regions produced roughly six times as much electricity per capita as large metropolitan regions in 2019, while drawing over half their generation mix from renewables (51.4%), more than three times the metropolitan share (15.2%) (OECD, 2025[8]). Despite a substantially cleaner generation mix, this scale of production still translates into an estimated 3-4 times higher per-capita power emissions in rural areas (OECD, 2025[8]).
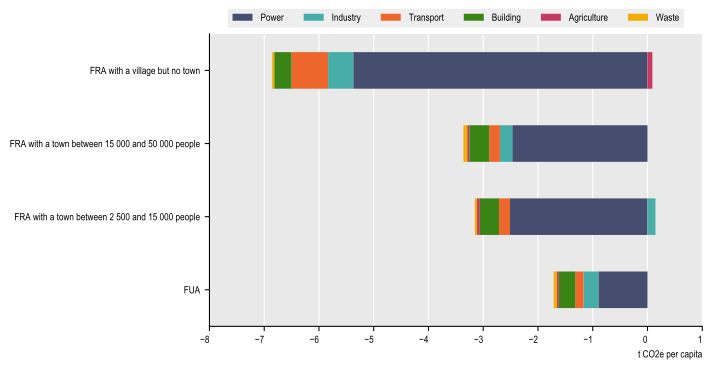
Despite these higher emissions levels, emissions declined across almost every sector and functional-area category between 2010 and 2024. The two exceptions are agriculture in FRAs with a village but no town and industry in FRAs with a town of 2 500 to 15 000 people. FRAs with a village and no town reported the largest declines, roughly four times the FUA declines followed by the two intermediate FRA categories. The power sector accounted for around half of the decline in FUAs and about three-quarters of the decline in each FRA category.
Overall, Figure 5.12 and Figure 5.13 and indicate that the most rural areas combine the highest per-capita emission levels with the largest reductions since 2010.
GHG emissions per capita by sector, t CO2e per capita, 2024
Source: OECD Regions, Cities and Local Areas database http://oe.cd/geostats based on EDGAR (Emissions Database for Global Atmospheric Research) Community GHG Database, a collaboration between the European Commission, Joint Research Centre (JRC), the International Energy Agency (IEA), and comprising IEA-EDGAR CO2, EDGAR CH4, EDGAR N2O, EDGAR F-GASES version EDGAR_2025_GHG (2025) European Commission, JRC (Datasets), https://edgar.jrc.ec.europa.eu/
Change in GHG emissions per capita by sector, 2010-2024
Source: OECD Regions, Cities and Local Areas database http://oe.cd/geostats based on EDGAR (Emissions Database for Global Atmospheric Research) Community GHG Database, a collaboration between the European Commission, Joint Research Centre (JRC), the International Energy Agency (IEA), and comprising IEA-EDGAR CO2, EDGAR CH4, EDGAR N2O, EDGAR F-GASES version EDGAR_2025_GHG (2025) European Commission, JRC (Datasets), https://edgar.jrc.ec.europa.eu/
In sum, the FRA-level evidence presented in this chapter reveals a consistent territorial gradient across several policy domains:
Old-age dependency rises steadily with rurality, adding to the demand for health and care services in the areas least equipped to provide them.
Foreign-born population share, a potential source of demographic renewal, also declines similarly, meaning the most rural areas are least able to offset ageing through migration.
Access to a general hospital within 45 minutes falls sharply with rurality, and internet speeds show a comparable decline, limiting digital services as a substitute for physical ones.
Housing markets show a clear and consistent gradient with rurality: dwelling vacancy rises and rents fall steadily as areas become more rural, and the two move together, consistent with tighter markets commanding higher prices.
Per-capita greenhouse gas emissions are higher in the most rural areas, nearly five times the level in FUAs, driven mainly by industry, transport and agriculture. At the same time, rural areas have seen by far the largest decline in per-capita emissions since 2010, concentrated in the power sector.
Built-up area has continued to expand in FRAs even where population has declined, meaning the physical footprint requiring services and infrastructure is not shrinking in step with the population base that sustains it.
These patterns are broadly consistent with OECD research conducted at the TL3 regional level using the extended OECD regional typology. The FRA-level analysis in this chapter complements, rather than contradicts this existing analysis while offering more granularity than TL3-level analysis allows.
References
[3] OECD (2025), Classifying shrinking regions: Shrinking smartly and sustainably, OECD Publishing, Paris, https://doi.org/10.1787/0185fe09-en.
[8] OECD (2025), Reinforcing Rural Resilience, OECD Rural Studies, OECD Publishing, Paris, https://doi.org/10.1787/7cd485e3-en.
[2] OECD (2025), Shrinking Smartly and Sustainably: Strategies for Action, OECD Rural Studies, OECD Publishing, Paris, https://doi.org/10.1787/f91693e3-en.
[5] OECD (2023), Brick by Brick (Volume 2): Better Housing Policies in the Post-COVID-19 Era, OECD Publishing, Paris, https://doi.org/10.1787/e91cb19d-en.
[1] OECD (2022), OECD Regions and Cities at a Glance 2022, OECD Publishing, Paris, https://doi.org/10.1787/14108660-en.
[4] OECD (2021), Brick by Brick: Building Better Housing Policies, OECD Publishing, Paris, https://doi.org/10.1787/b453b043-en.
[7] OECD (2021), Bridging digital divides in G20 countries, OECD Publishing, Paris, https://doi.org/10.1787/35c1d850-en.
[6] OECD (2021), Delivering Quality Education and Health Care to All: Preparing Regions for Demographic Change, OECD Rural Studies, OECD Publishing, Paris, https://doi.org/10.1787/83025c02-en.
← 1. Settlement boundaries are drawn from Eurostat's GISCO database for EU countries and the Global Human Settlement Layer (GHSL, 2020 vintage) for non-EU countries.
← 2. A minimum overlap of 2 500 residents ensures that a town or city has a meaningful population presence within the functional area and avoids classifications driven by very small boundary overlaps. This threshold affects 37 FRAs, equivalent to around 0.6% of all functional areas in the sample.
← 3. While the big majority of FRAs contain a settlement, 3% of European FRAs without a town also do not have a village, based on CISCO 2021 data. Outside Europe, this share rises to 35%, based on GHSL 2020 data. Part of this difference likely reflects differences in settlement patterns. However, some cases may also result from non-standard local areas. More extensive post-processing and stakeholder engagement, which have not yet been undertaken to the same extent for non-European countries, might substantially reduce the share of such cases.
← 4. In principle, urban centres, as defined by the Degree of Urbanisation, should form the cores of functional urban areas and therefore should not fall within FRAs, which cover areas outside FUAs. In practice, around 5% of FRAs contain an urban centre, which can occur when countries review and adjust FUA boundaries to reflect national knowledge and conditions on the ground.
← 5. Some FUAs do not contain an urban centre with more than 50 000 settlements but the core of a FUA is nevertheless always considered a city.
← 7. In some contexts, this pattern may also reflect the relocation of certain infrastructure and the physical footprint of services intended for the population outside FRAs.
← 8. These estimates capture territorial differences in fixed internet download speeds. Mobile download speeds also tend to decline with rurality, but in some countries these differences may be somehow less pronounced than for fixed internet download speeds.