Functional Rural Areas (FRAs) aim to provide a territorial framework for analysing daily systems outside Functional Urban Areas (FUAs). This chapter assesses how FRAs relate to other spatial classifications and whether they capture meaningful territorial patterns. The first part of the chapter compares FRAs and FUAs with the degree of urbanisation, showing that FRAs are not exclusively rural and that FUAs areas are not exclusively urban. It then uses commuting data to show that many working residents live and work in the same FRA, while some FRAs maintain strong commuting links with nearby FUAs. The second part focusses on a broader quantitative comparison of daily system delineations. It introduces a set of measures developed to assess Labour Market Areas (LMAs), covering autonomy, balance, cohesion and homogeneity. It compares FRA-FUA delineations to LMAs in several countries where such a comparison is possible and finds comparable values in many cases for the two delineations. Random benchmarks suggest that functional areas comprising FRAs and FUAs (FAs), LMAs and Bassins de Vie, an alternative definition based on service proximity, all capture spatial patterns beyond geographic proximity.
The Geography of Choice

Abstract
FUAs and FRAs do not necessarily correspond neatly to urban and rural territories as defined by the degree of urbanisation (DEGURBA) – in fact both types of areas can include a mix of rural areas, towns and semi-dense areas, and cities. The two classifications serve different purposes: the degree of urbanisation describes the settlement characteristics of grid cells or local areas, while FUAs and FRAs delineate broader territorial systems.
Around half of the population in FRAs lives in rural local areas, while most of the remainder lives in towns and semi-dense areas. Across 37 OECD member and accession countries with available data, the balance between these two types of local areas varies substantially (Figure 3.1). In more densely populated countries, such as Belgium and the Netherlands, most people in FRAs live in towns and semi-dense areas. By contrast, in Latvia, Lithuania and Ireland, the population of FRAs concentrates more strongly in rural local areas. Across countries, FRAs do not only cover villages and sparsely populated rural areas; they often revolve around towns with up to 50 000 people that can play an important role in structuring daily life outside FUAs1.
Population share in FRAs by degree of urbanisation of the local area of residency
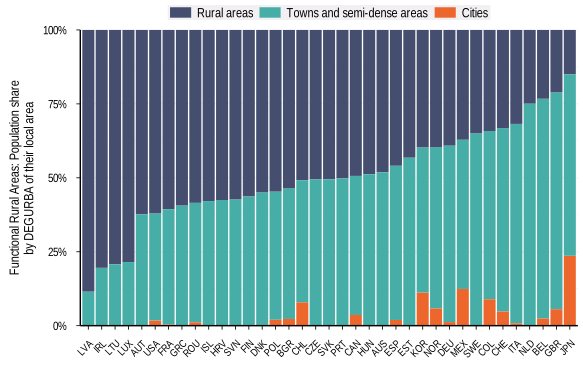
Source: OECD calculations based on FRA boundaries shared by the EC-JRC and DEGURBA data from GHSL.
FUAs also include substantial rural populations. In 13 countries out of 37 with available data, more than 20% of the population living in FUAs resides in local areas classified as rural by the degree of urbanisation (Figure 3.2). This share is particularly high in some Central and Eastern European countries, including Latvia, Lithuania, Romania, the Slovak Republic and Slovenia, while it remains much lower in countries such as Colombia, Iceland and Korea2.
Population share in FUAs by degree of urbanisation of the local area of residency
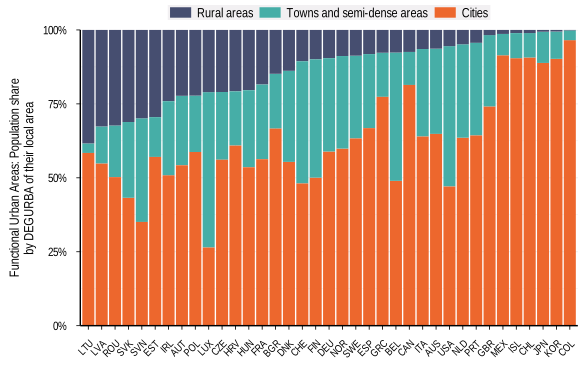
Source: OECD calculations based on FRA boundaries shared by the EC-JRC and DEGURBA data from GHSL.
The presence of rural local areas within FUAs is consistent with the FUA definition. FUAs include a city and a commuting zone, with surrounding local areas added when at least 15% of their employed residents commute to the city Rural local areas can therefore be part of FUAs when they meet this commuting threshold.
The share of rural areas within FUAs is larger if measured by area rather than population. Rural local areas typically have lower population densities than cities and towns, so population-weighted indicators understate their territorial extent. Similarly, rural local areas generally account for a higher share of all local areas in FUAs than of the FUA population.
The results highlight that urban and rural territories are not separate islands. Many rural local areas have close links to cities through labour markets and daily mobility, while many FRAs include towns and semi-dense areas alongside rural areas. Recognising these connections can help support policy approaches that reflect the relationships between different types of places.
Commuting flows help describe how FRAs relate to other functional areas. While the FRA delineation does not use observed commuting flows and is intended to capture daily systems in a broader sense, administrative data on where people live and work can show whether FRAs also capture meaningful labour market geographies. In particular, commuting data make it possible to assess whether working residents of a FRA also work in jobs within the same FRA and where workers commute, when they leave their FRA. These patterns are useful for both evaluating FRAs as a spatial delineation and understanding their relationship with FUAs.
Results show that in most FRAs, the majority of working residents work within the same FRA. Across 26 countries with available data, 92% of FRAs have more than half of their working residents employed within the FRA, and many countries have median values between 60% and 80% (Figure 3.3). Median values are even higher in some countries, exceeding 85% in Australia, Canada, Japan and Korea. These relatively high values are notable because unlike FUAs or LMAs, FRA delineations do not rely on observed commuting flows. Even so, their boundaries often capture a substantial share of residents’ workplaces.
Share of working residents of a functional area who work in the same functional area
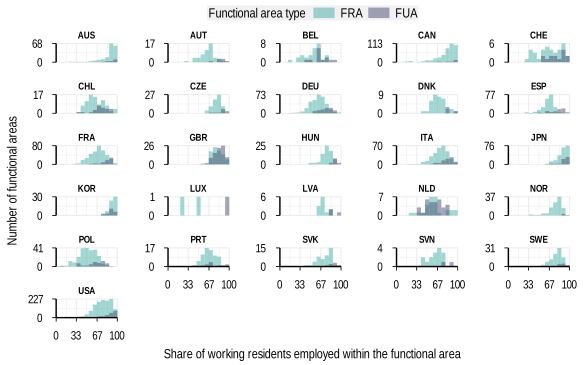
Source: OECD calculations based on FRA boundaries shared by the EC-JRC and data from the OECD Regions, Cities and Local Areas database http://oe.cd/geostats.
The share of working residents employed within the functional area tends to be lower in FRAs than in FUAs, but the two generally move together within a given country: high (low) values for FUAs coincide with high (low) values for FRAs. In the Netherlands, for example, this share is comparatively low for both FUAs and FRAs, reflecting a dense and highly integrated territorial structure in which commuting flows frequently cross functional-area boundaries.3 This suggests that national settlement structures and commuting systems could be shaping both types of functional areas.
FRAs typically maintain labour market links with other places. While many people work in the same FRA in which they live, only 16% of FRAs have 90% or more of their working residents employed within the FRA. Meanwhile, this is the case for a larger fraction of FUAs (35%), particularly in countries such as Hungary, Japan, Luxembourg and Norway. This indicates that, unsurprisingly, rural labour markets often have more dispersed commuting patterns and less dominant employment centres than urban labour markets. It also highlights that even when FRAs capture a large share of resident workers, some residents usually commute elsewhere.
Moreover, commuting patterns from FRAs seem to be decentralised. Figure 3.4 classifies the largest commuting flow from each FRA to any other functional area. In most countries with available data, more than half of FRAs do not have an outflow above 15% of their working residents to any single functional area. In 10 out of 26 countries with available data, including Korea, the United Kingdom, Czechia and Sweden, the share of FRAs with no individual outflow above 15% exceeds three-fourths. This pattern can arise because a FRA is highly self-contained, leaving only small outflows to any external destination; because it has more outflows overall, but these flows are spread across several destinations rather than concentrating in one other functional area; or through a combination of both these effects.
Share of FRAs by the size of their largest commuting outflow to a single other functional area
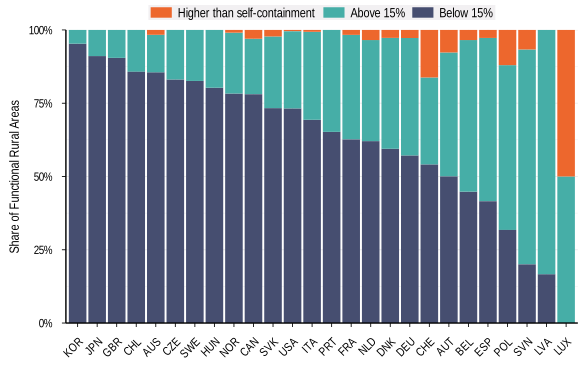
Note: The largest commuting outflow is measured as the share of working residents living in an FRA who commute to the same other functional area. “Higher than self-containment” identifies FRAs where more working residents commute to the same functional area than work within the FRA where they live.
Source: OECD calculations based on FRA boundaries shared by the EC-JRC and data from the OECD Regions, Cities and Local Areas database http://oe.cd/geostats.
There are cross-country differences to the extent to which FRAs operate as self-contained labour market systems or as parts of broader commuting networks. For instance, some countries have a larger share of FRAs with a strong directional outflow. In Latvia and Slovenia, four out of five FRAs have at least 15% of their employed residents commuting to one other functional area4. These FRAs have a clear external labour market orientation while often retaining a substantial number of resident workers in jobs within the FRA. Moreover, a small number of FRAs have more residents working in a single other functional area than in the FRA they live in, implying that their self-containment must be below 50%. These often correspond to FRAs bordering a FUA with highly integrated labour markets.
The FRA around Hemmoor in northern Germany illustrates the case of a FRA with a strong external commuting link. Around 6 100 employed residents both live and work within the FRA, while approximately 8 200 commute to the FUA of Hamburg (Figure 3.5). Smaller flows connect this FRA with other nearby functional areas, including around 500 to 600 commuters travelling to neighbouring FRAs and a smaller number to the FUA of Bremerhaven. Many commuters travelling to the Hamburg FUA do not work in the city of Hamburg itself and travel instead to municipalities within its commuting zone. For example, more than twice as many Hemmoor FRA residents commute to the municipality of Stade, a nearby local area in the Hamburg FUA, than to Hamburg itself. This concentration of flows towards the Hamburg FUA commuting zone, rather than the city, helps explain why the municipalities in the Hemmoor FRA are not themselves included in the Hamburg FUA. Hemmoor nevertheless illustrates how a FRA can retain its own functional identity while remaining closely connected to a nearby urban labour market.

Note: The map excludes additional flows of 10 to 180 commuters from the FRA to nine other functional areas.
Source: OECD calculations based on FRA boundaries shared by the EC-JRC and data from the OECD Regions, Cities and Local Areas database http://oe.cd/geostats.
Sizeable outflows are not exclusive to FRAs. The equivalent analysis for FUAs, shown in Figure A B.1, indicates that most FUAs have no individual outflow above 15%, but some FUAs also have strong commuting links with another functional area. These cases occur less often among FUAs than among FRAs, which is consistent with both the FUA delineation method and the spatial structure of urban labour markets. FUAs are built around cities and commuting zones and often have a more concentrated employment base, while commuting flows in FRAs may be more dispersed across multiple destinations within and outside their boundaries.
FRA commuting outflows, or outcommuting, often go to FUAs, indicating substantial labour market integration of many FRAs with nearby cities. The bars in Figure 3.6 show the share of commuting outflows from FRAs to neighbouring functional areas that goes to FUAs rather than to other FRAs. In most countries, at least half of these commuting outflows goes to FUAs. This share is close to or above two-thirds in 10 out of 26 countries with available data and is particularly high in Luxembourg, the Netherlands, Spain and Latvia. Outcommuting to other FRAs also occurs and is especially high in more sparsely populated countries such as Norway and Sweden.
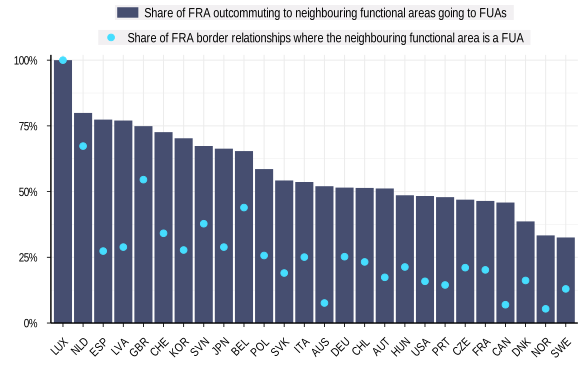
Note: The bars show the share of commuting outflows, or outcommuting, from FRAs to neighbouring functional areas that goes to FUAs. The points show the share of FRA border relationships where the neighbouring functional area is a FUA.
Source: OECD calculations based on FRA boundaries shared by the EC-JRC and data from the OECD Regions, Cities and Local Areas database http://oe.cd/geostats.
The concentration of FRA outcommuting towards FUAs is not simply a result of adjacency. The light blue dots in Figure 3.6 show the share of FRA border relationships where the neighbouring functional area is a FUA. In most countries, this share is substantially smaller than the share of FRA outcommuting to neighbouring functional areas that goes to FUAs. This is particularly visible in countries such as Spain, Latvia, Korea and Japan, where FUAs make up fewer than 30% of FRA border relationships but receive more than 66% of outcommuting from FRAs. In practice, this means that FUAs often act as employment hubs not only for their own residents and commuting zones, but also for workers living in nearby FRAs.
Most large outflows from FRAs go to neighbouring functional areas, but some flows reach beyond adjacent areas. In general, the strongest commuting links from FRAs lead to functional areas that share a border with them. However, a small share of FRAs with an outflow above 15% have their largest outflow going to a non-neighbouring functional area. These cases often involve flows towards FUAs, suggesting that some urban labour markets attract commuters from beyond their immediate surrounding functional areas.
Overall, commuting flows suggest that FRAs often capture meaningful labour market geographies, even though commuting does not enter directly into their delineation. In most FRAs, a majority of working residents work within the FRA boundaries, and many have no high flow to a single external commuting destination. At the same time, some strong external links exist and outcommuting to neighbouring functional areas often goes to FUAs. FRAs therefore combine a degree of self-containment with continued integration into wider territorial labour markets, particularly around cities. This dual pattern is central for interpreting FRAs: they can provide useful units for analysing territories outside FUAs, but they should be understood as part of a wider urban-rural system.
Quantitative measures can help assess whether territorial typologies capture plausible daily systems, even if they are not meant to be used to identify the “best” typology. Different policy questions may require different territorial units, and expert knowledge remains essential when choosing between alternative delineations. In this context, quantitative measures can expose strengths and weaknesses of different typologies, show whether they perform similarly across several dimensions, and identify cases where one option consistently performs better than another.
This section broadens the previous assessment based on commuting flows by using a set of measures developed by Martínez-Bernabeu, Coombes and Casado-Díaz (2019[1]) to evaluate LMAs. These measures make it possible to compare LMAs with FRAs + FUAs through a common framework5.
Four desirable properties of daily systems
The measures assess four desirable properties of daily systems:
Autonomy (self-containment): Captures whether trips remain within the same daily system.
Balance (jobs-workers parity): Captures whether the number of working residents in a daily system matches the number of jobs.
Cohesion (internal connectivity): Captures whether different local areas inside a daily system are strongly interconnected with each other.
Homogeneity (similar size): Captures whether daily systems have similar sizes.
Autonomy requires a large share of trips to have their origin and destination within the boundary of a single daily system. If many commuters regularly cross the boundaries of a daily system, it is probably ill-suited to describe the relevant labour market. This corresponds to the example of the Hemmoor FRA above (Figure 3.5), whose labour market intersects considerably with the labour market of the Hamburg FUA. Combining two daily systems mechanically improves autonomy because fewer trips cross boundaries. Autonomy should therefore never be the only criterion of a quantitative analysis, even if it is an important one.
Balance stipulates that the number of workers in a daily system should be roughly equal to the number of jobs. In this context, mismatches reflect imperfectly delineated daily systems rather than unemployment, as the evaluation typically relies on work-commuting data from people with jobs. When a daily system has more workers than jobs, many workers will inevitably work elsewhere. In this case, the daily system would not be an accurate representation of a commuting zone. Autonomy and balance are related but not interchangeable: if two daily systems each have similar numbers of jobs and workers, but substantial commuting happens between the two, they would have high values for balance and low values for autonomy.
Cohesion helps counterbalance the bias of autonomy towards larger areas. A cohesive daily system should contain local areas that are strongly connected to each other. If two local areas exchange many commuters, assigning them to the same daily system improves cohesion. Adding a weakly connected local area to an otherwise coherent daily system will usually lower cohesion.
Finally, homogeneity refers to having daily systems of similar size. The importance of this criterion depends on the policy question at hand. When delineating electoral constituencies for a first-past-the-post voting system, an equal number of voters in each constituency might be by far the single most important requirement. In contrast, when describing the areas connected by different local public transport systems for statistical purposes, prioritising equal sizes might yield an inaccurate representation of how the transport system actually functions.
Eight quantitative measures to assess daily systems
The analysis translates these four properties into eight quantitative measures (Box 3.1). Global self-containment, median self-containment and minimum self-containment capture different aspects of autonomy. A Gini-based inequality indicator of the worker-to-job ratios across daily systems provides an estimate of balance. Cohesion is measured through the global interaction index and the number of daily systems. Finally, homogeneity is measured through two additional Gini-based indicators: one for geographic area and one for the number of working residents. For all measures, higher values indicate higher fulfilment of the corresponding criterion.
The comparative analysis in this section relies on eight quantitative measures developed by Martínez-Bernabeu, Coombes and Casado-Díaz (2019[1]).
1. Global self-containment: The share of all commuting flows that cross no daily system boundary should be high.
Global self-containment varies between 0 and 1 and constitutes one measure for the entire study area. It is a slightly modified version of self-containment, a core variable of the labour market area algorithm:
Self-containment returns one value per daily system that can be summarised as a distribution or as:
2. Median self-containment: Most commuting flows should happen within daily systems.
3. Minimum self-containment: No daily system should have many working residents working elsewhere or many jobs filled by workers from elsewhere.
4. Balance: 1 – Gini(working residents / jobs). Each daily system should have a similar number of workers and jobs. Gini coefficients fall between 0 and 1, with 0 referring to perfect equality, and 1 to complete inequality. If many people live in daily system A and work in daily system B, the ratio of working residents to jobs will be larger than one for A and smaller than one for B. Many daily systems with values far from one result in a larger Gini coefficient. Subtracting the Gini coefficient from one ensures that larger values indicate higher fulfilment of the criterion.
5. Global interaction index CS: There should be many commuting flows between different local areas in the same daily system. Commuting flows going beyond the borders of a daily system lower CS, as do those staying within the same local area. The expansion of a daily system to include local areas with weak links to the rest of the daily system will typically result in lower CS. Daily systems consisting of one single local area will always have a CS value of zero, as there can never be flows between different local areas within the daily system. If there are many such daily systems in a typology, CS is not a good evaluation measure. The following formula describes the calculation of the global interaction index CS:
6. Number of daily systems: As a crude proxy, the number of daily systems should be high. Although not a highly sophisticated measure, the number of daily systems is the most direct way to ensure a counteracting force against the autonomy criterion, which has the bias of favouring few large daily systems over many smaller ones.
7. Homogeneity of working residents: 1 – Gini of working residents. Daily systems should have a similar number of workers.
8. Area homogeneity: 1 – Gini of area. Daily systems should be of similar geographic size.
These measures provide a labour market perspective on daily systems. Many countries collect commuting flows between local areas, making work trips the most readily available basis for comparison. However, evidence suggests that most trips are not work-related (Couture, Duranton and Turner, 2018[2]) and trips to schools, shops, healthcare, leisure activities, friends and family also matter for daily systems. Focusing only on commuting also excludes people who are not in employment, including students and retirees. This is important when interpreting the results: the measures assess whether a typology captures labour market geographies, not whether it captures every dimension of daily life.
FRA-FUA delineations show similar values to LMAs across several labour market measures
The following analysis compares FRA-FUA typologies with Labour Market Area (LMA) delineations. It evaluates FRAs and FUAs jointly6 because, together, they provide full territorial coverage comparable to LMAs.7 The analysis compares typologies with a similar number of daily systems (Box 3.2) to assess whether FRAs and FUAs produce daily systems with similar values to LMAs on labour market measures based on commuting data.
Both autonomy and cohesion depend on the number of daily systems. Autonomy, measured through self-containment, is generally higher for delineations with fewer systems for the same territory because fewer commuting flows cross boundaries. At the extreme, a single daily system covering an entire country would maximise self-containment.1 A delineation with more and smaller daily systems may, in turn, score higher on cohesion and it can fall when the typology adds weakly connected local areas to an otherwise coherent unit. Jointly assessing the measures helps reduce this size effect, but it does not eliminate it.
To achieve a similar number of daily systems, the analysis keeps the number of LMAs fixed at the level chosen in each country and adjusts the number of FRAs, evaluated together with FUAs, through alternative FRA parametrisations to match the number of LMAs as closely as possible. This approach makes the comparison less sensitive to differences in average unit size and helps ensure that the measures reflect differences in the delineation rather than differences in the number of units.2 The comparison focuses on countries where the number of FRA-FUA daily systems can be brought sufficiently close to the number of LMAs. Different FRA parametrisations produce different numbers of functional areas, and not every country has a parametrisation that yields a plausible FRA-FUA typology with a number of units close to the number of LMAs.
1. The analysis also abstracts from cross-border flows because work-commuting data at the local area level are typically only available within countries. Cross-border flows can be significant, in particular for cross-border FUAs and small countries.
2. The Joint Research Centre of the European Commission provided the custom FRA parametrisations used for this comparison. The FRA methodology depends on three main parameters: a minimum population threshold, a lower travel-time threshold below which the algorithm combines catchment areas, and an upper travel-time threshold above which it does not combine them (Dijkstra and Jacobs-Crisioni, 2023[3]). The currently proposed parametrisation uses thresholds of 25 000 inhabitants, 30 minutes and 60 minutes. Adjusting these thresholds results in different numbers of FRAs, which this analysis leverages for a cleaner comparison.
FRA-FUA delineations and LMAs show broadly similar values across most labour market measures. Table 3.1 compares FRA-FUA and LMAs in a selection of countries where their numbers of daily systems can be matched closely.
Note: FAs refer to FRAs and FUAs evaluated together. The number of FAs is adjusted to be close to the number of LMAs in each country. Higher values indicate higher fulfilment of the corresponding criterion.
Source: OECD calculations based on measures developed by Martínez-Bernabeu, Coombes and Casado-Díaz (2019[1]), LMAs in Table A A.1, FRA boundaries shared by the EC-JRC and commuting data from the OECD Regions, Cities and Local Areas database Regions, cities and local statistics.
No single delineation consistently shows higher fulfilment across all measures and countries. For example, the FA (FRA+FUA) delineation shows higher global self-containment than LMAs in Japan, while LMAs have higher global self-containment than FA in Sweden. Both approaches delineate daily systems with comparable numbers of working residents and jobs across the 7 countries covered in the comparison. Differences in cohesion, in turn, are small, even if LMAs show slightly higher cohesion values in all countries covered. Finally, the FA typology tends to produce some individual daily systems with lower self-containment values than LMAs, especially in Germany, France, Italy and Sweden, which nevertheless do not affect global self-containment (Box 3.3).
There are specific daily systems where the FA delineation may fit labour market geographies less well. These cases relate to oddly-shaped FRAs, in particular near FUA boundaries, where commuting flows can point strongly towards a nearby urban labour market.1 Figure 3.7 illustrates this pattern for the example of France: the distributions of self-containment values overlap strongly, but the FA delineation has a somewhat more visible lower tail.
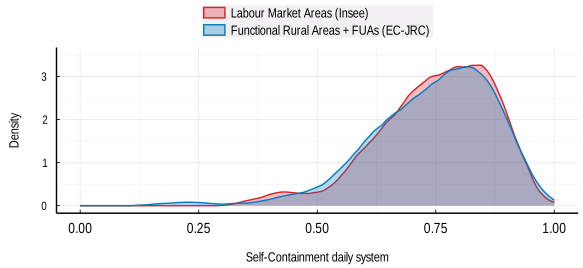
Note: The figure shows the distribution of self-containment values across daily systems in France. FRAs + FUAs refer to the tailored parametrisation used to match the number of LMAs. Self-containment is measured for each daily system.
Source: LMAs from INSEE (https://www.insee.fr/fr/information/4652957), FRA boundaries shared by the EC-JRC and commuting data from the OECD Regions, Cities and Local Areas database Regions, cities and local statistics.
Stakeholder consultation and local knowledge could help address some of these low self-containment cases. Statistical measures can identify daily systems with unusually low self-containment, but they cannot determine on their own whether a boundary should change. In some cases, local experts may confirm that the area has strong functional links with a neighbouring FUA or FRA. In others, they may point to service provision, physical geography or institutional factors that justify the existing delineation despite the commuting pattern.
1. They may partly also reflect less post-processing in the tailored FRA parametrisations used for this comparison.
The results are also robust to alternative FRA parametrisations. For the example of France, Annex Table A B,1 shows that changing the FRA population and travel-time thresholds leads to only modest differences across most measures. Global self-containment and balance remain virtually unchanged, while the two homogeneity measures vary somewhat. The number of daily systems changes across parametrisations, but the overall assessment remains stable.
Overall, the fact that the FA delineation does not show clearly lower values than LMAs across most indicators is notable, given that the assessment criteria relies on commuting data and labour market characteristics. The results suggest that the FA delineation has the potential to approximate several labour market characteristics of daily systems, which can be particularly useful for countries where census-based commuting data are not available.
Random benchmarks help compare typologies with different numbers of units
Random benchmarks provide an additional way to assess whether daily system definitions capture meaningful spatial patterns beyond simple adjacency when matching the number of units is not feasible. Some delineations divide a country into many more units than others. In mainland France, for example, the Bassins de Vie contain 1 681 daily systems, compared to 287 LMAs and 286 tailored FAs. Directly comparing their values on autonomy, cohesion or balance would therefore partly reflect differences in scale (Box 3.2).
A random benchmark compares each delineation with randomly generated groupings that have the same number of units and tests how a delineation would perform if it grouped neighbouring local areas without using information on commuting flows, service provision, driving time or population centres. The algorithm described in Box 3.4 randomly clusters adjacent local areas into compact groups, while keeping the number of groups equal to the number of units in the assessed delineation. If a delineation consistently shows higher fulfilment of the criteria than random groupings with the same number of units, it suggests that the delineation captures relevant spatial structure rather than merely producing compact territories.
The following algorithm randomly clusters adjacent local areas into spatially contiguous groups. These random groups serve as a benchmark when assessing whether daily-system delineations capture patterns beyond geographic proximity. The algorithm clusters adjacent local areas according to a breadth-first logic, meaning that each random group expands gradually from an initial local area to neighbouring local areas. The algorithm then lets all random daily systems expand in turns, so that one system cannot absorb the full territory before others expand. This tends to produce compact random daily systems that resemble those from other delineation methods.
1. Fix the number of random daily systems to the number of units in the daily system typology to assess. This alignment ensures the comparison is not driven by the units’ average size.
2. Initiate empty lists, each representing one random daily system.
3. Populate the first list with a randomly chosen local area. This local area will be at the centre of the first random daily system. Repeat this process for each of the remaining lists. Every local area can only be part of one random daily system and therefore of only one list.
4. Once all lists are filled, take the local area in the first list. Add all neighbouring local areas to the corresponding random daily system, unless they are an initialising local area for another random daily system. Remove the initialising local area from the list and add the neighbouring local areas to the list in random order.
5. Iteratively do the following: Take the local area at the first position of the next list. If it has unassigned neighbours, add them to the random daily system. Remove the processed local area from the list and add the newly added local areas to the back of the list in random order. If there are no unassigned neighbours, drop the first element of the list and move to the next list. Process all lists in sequence and then restart with the first list. Skip empty lists, as the corresponding random daily systems have reached their final state and cannot expand further.
6. Stop once all lists are empty, at which point all local areas are assigned to exactly one of the random daily systems.
This algorithm creates one random daily-system typology. Running it times results in typologies, making it possible to calculate a distribution of benchmark values through a Monte Carlo simulation.
Note: The algorithm assumes a study area of adjacent local areas. Islands or exclaves that are typically reached through a clearly identifiable local area on the main component can be treated as bordering that local area. If the study area nevertheless consists of more than one component, such as a mainland and a large island, the random choice of N initial local areas must include at least one local area on each component; otherwise, the algorithm cannot assign all local areas. A simple solution is to discard draws of initial local areas that do not satisfy this constraint.
Random benchmarks show that daily-system definitions capture more than proximity
Figure 3.8 compares LMAs, FAs and Bassins de Vie in France with distributions from 1 000 randomly generated delineations. Each random delineation clusters adjacent local areas into the same number of daily systems as the observed typology being assessed. This creates a benchmark for what the measures would look like if daily systems were compact and spatially contiguous, without using information on commuting flows, service provision, driving times or population centres.
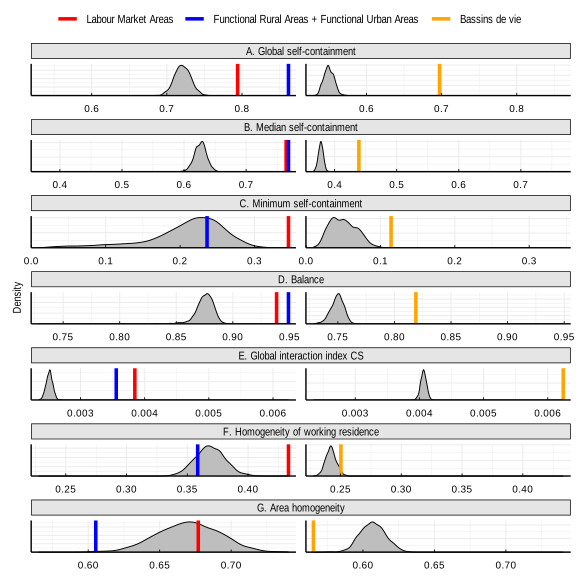
Note: The grey distributions show values from 1 000 random daily-system typologies generated by clustering adjacent local areas into the same number of units as the typology assessed. Vertical lines show the values for observed typologies. FRAs + FUAs refer to the tailored parametrisation used to match the number of LMAs. Bassins de Vie are evaluated against random typologies with the same number of units as Bassins de Vie. Higher values indicate higher fulfilment of the corresponding criterion.
Source: LMAs (https://www.insee.fr/fr/information/4652957) and Bassins de Vie (https://www.insee.fr/fr/information/6676988) from INSEE, FRA boundaries shared by the EC-JRC and commuting data from the OECD Regions, Cities and Local Areas database Regions, cities and local statistics.
LMAs and FRAs + FUAs perform considerably better than random benchmarks on most labour market measures. Both delineations show much higher global and median self-containment than random groupings with the same number of units. They also show higher balance and higher cohesion than the random benchmarks. This indicates that both delineations capture meaningful spatial structures beyond the simple clustering of neighbouring local areas.
The comparison is more nuanced for minimum self-containment. In France, FRAs + FUAs have higher global self-containment and lower minimum self-containment than LMAs, but this varies over countries (Table 3.1). The random benchmark shows that the minimum self-containment of FRAs + FUAs is not significantly higher than what random clustering could produce. This supports the interpretation that most FRA + FUA daily systems fit labour market geographies reasonably well, but that a small number of individual areas have weak labour market self-containment (Box 3.3). At the same time, the higher global self-containment of FRAs + FUAs shows that these cases do not dominate the overall pattern.
Homogeneity is the main dimension where observed typologies do not necessarily outperform random benchmarks. This is not surprising. Historical settlement patterns and agglomeration economies created functional areas that are larger than what a random clustering would produce. Homogeneity can be crucial for some applications, such as electoral constituencies, but it should not dominate the assessment when the goal is to describe daily systems as accurately as possible.
Bassins de Vie operate at a different scale, but they also perform well relative to their random benchmark. France has many more Bassins de Vie than LMAs or tailored FRAs + FUAs. As expected, this results in lower self-containment and higher cohesion in direct comparison with the other typologies. However, when compared with random groupings with the same number of units, Bassins de Vie show much stronger values on most measures. This suggests that they also capture meaningful spatial patterns. Their usefulness relative to other delineation typologies depends on the policy question and the scale at which the analysis needs to operate.
The analysis in this chapter provides three main findings. First, functional delineations such as FRAs + FUAs, do not necessarily correspond neatly to urban and rural territories as defined by the degree of urbanisation. FRAs are not exclusively composed of rural local areas, just as FUAs are not exclusively urban. Towns and semi-dense areas play an important role in many FRAs, while rural local areas can form part of FUAs when they are closely connected to a city.
Second, commuting patterns indicate that FRAs often correspond to meaningful labour market geographies, even though commuting data are not used to define them. In most FRAs, the majority of employed residents work within the same functional area, and many FRAs have no large commuting outflow to any single external destination. At the same time, some FRAs have strong links with other functional areas, particularly FUAs.
Third, the quantitative comparison presented in this chapter does not identify one delineation that performs best across all countries and criteria. When FRAs and FUAs are assessed together and compared with a similar number of LMAs, the two approaches produce broadly comparable results for autonomy, balance and cohesion. The FRA-FUA delineation performs better on some measures and in some countries, while LMAs perform better in others. The random benchmarks reinforce these findings. LMAs, FRAs combined with FUAs and Bassins de Vie generally perform better than randomly generated groupings with the same number of units. Each approach therefore captures meaningful spatial relationships beyond the simple grouping of adjacent local areas.
References
[2] Couture, V., G. Duranton and M. Turner (2018), “Speed”, The Review of Economics and Statistics, Vol. 100/4, pp. 725-739, https://doi.org/10.1162/rest_a_00744.
[3] Dijkstra, L. and C. Jacobs-Crisioni (2023), Developing a definition of Functional Rural Areas in the EU, https://publications.jrc.ec.europa.eu/repository/handle/JRC135599.
[1] Martínez-Bernabeu, L., M. Coombes and J. Casado-Díaz (2019), “Functional Regions for Policy: a Statistical ‘Toolbox’ Providing Evidence for Decisions between Alternative Geographies”, Applied Spatial Analysis and Policy, Vol. 13/3, pp. 739-758, https://doi.org/10.1007/s12061-019-09326-2.
← 1. A small share of the population in FRAs also lives in local areas classified as cities, although all cities should in principle be part of a FUA.
← 2. In some countries with relatively large local areas, such as Latvia, the results may partially reflect the size of the local area units rather than the settlement structure.
← 3. Due to data availability, the analysis focuses on commuting flows within national borders and therefore does not capture cross-border flows, which can matter considerably in small countries or border regions with highly integrated labour markets.
← 4. Results should be interpreted in light of possible limitations in the underlying data. In Latvia, for example, some employees are recorded in administrative data as working at the enterprise's registered address, often in Riga, rather than at their actual place of work, because not all enterprises register their local units. This may overstate commuting flows towards Riga. To account for this issue, the Latvian FUA delineation applies, in agreement with Eurostat, a 20% commuting threshold rather than the standard 15% threshold when identifying commuting zones.
← 5. FRAs delineated for the entire country have not been included in the assessment. Nevertheless, early experimental results of FRAs delineated for the entire territory of France are available upon request.
← 6. The FUA and FRA methodologies are currently applied sequentially rather than through a fully integrated framework. The established FUA boundaries are defined first, and the FRA methodology is then applied to territories outside FUAs. FRAs therefore complement the FUA geography without modifying it. Future methodological work could explore closer integration between the two delineations. This might include examining whether some local administrative units could be assigned differently in light of both commuting intensity and their links to nearby population centres. Another avenue could be to apply the FRA methodology across the entire national territory and compare the resulting geography with the current combination of FUAs and FRAs.
← 7. A notable exception for this are the Canadian self-contain labour areas (not included in the comparison) that delineate the areas outside census metropolitan areas and census agglomerations