The Geography of Choice
Annex B. Additional figures and tables
Copy link to Annex B. Additional figures and tablesFigure A B.1. Most FUAs have no large commuting outflow to a single other functional area, but some show strong links
Copy link to Figure A B.1. Most FUAs have no large commuting outflow to a single other functional area, but some show strong linksShare of FUAs by the size of their largest commuting outflow to a single other functional area
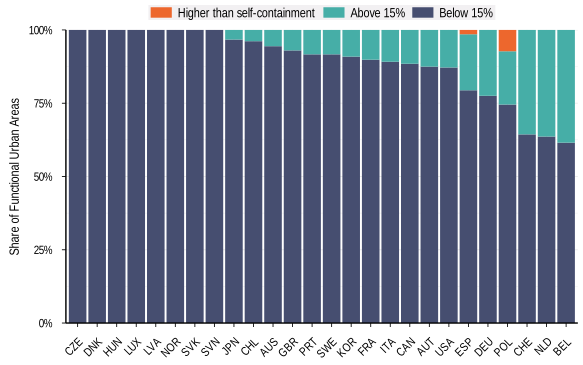
Note: The figure shows the share of FUAs by the size of their largest commuting outflow to a single other functional area. The largest commuting outflow is measured as the share of working residents living in a FUA who commute to the same other functional area. “Higher than self-containment” identifies FUAs where more working residents commute to the same functional area than work within the FUA where they live.
Source: OECD calculations based on FRA boundaries shared by the EC-JRC and data from the OECD Regions, Cities and Local Areas database http://oe.cd/geostats.
Table A B.1. FRA-FUA results for France are robust to different FRA parametrisations
Copy link to Table A B.1. FRA-FUA results for France are robust to different FRA parametrisations|
Criterion |
Measure |
50 000 people 20 + 45 minutes |
25 000 people 30 + 45 minutes |
25 000 people 30 + 60 minutes |
50 000 people 30 + 60 minutes |
|---|---|---|---|---|---|
|
Cohesion |
Number of daily systems |
337 |
329 |
269 |
286 |
|
Autonomy |
Global self-containment |
0.86 |
0.86 |
0.86 |
0.86 |
|
Autonomy |
Median self-containment |
0.75 |
0.75 |
0.77 |
0.77 |
|
Autonomy |
Minimum self-containment |
0.27 |
0.27 |
0.27 |
0.24 |
|
Balance |
1 – Gini (job ratio) |
0.95 |
0.95 |
0.95 |
0.95 |
|
Cohesion |
Global interaction index CS |
0.0039 |
0.0039 |
0.0035 |
0.0036 |
|
Homogeneity |
1 – Gini (area) |
0.64 |
0.64 |
0.62 |
0.61 |
|
Homogeneity |
1 – Gini (working population) |
0.31 |
0.32 |
0.37 |
0.36 |
Note: The four specifications vary by the parameters used in the construction of the Functional Rural Areas. The two time-parameters refer to time thresholds below which the FRA algorithm combines FRAs / above which it never combines FRAs. The population parameter describes the minimum population size, which the algorithm only violates if it would imply driving times above the higher time parameter. Only the FRAs change between the different versions, the jointly evaluated FUAs remain the same. Higher values indicate better performance for all measures.
Source: OECD calculations based on FRA boundaries shared by the EC-JRC and data from the OECD Regions, Cities and Local Areas database http://oe.cd/geostats.
Table A B.2. Number of FRAs and FUAs used for the analysis in subsection 3.1; and in subsection 3.2 where commuting data are available
Copy link to Table A B.2. Number of FRAs and FUAs used for the analysis in subsection 3.1; and in subsection 3.2 where commuting data are available|
Country |
Number of FRAs |
Number of FUAs |
|---|---|---|
|
AUS |
180 |
18 |
|
AUT |
52 |
8 |
|
BEL |
29 |
13 |
|
BGR |
53 |
13 |
|
CAN |
437 |
26 |
|
CHE |
37 |
14 |
|
CHL |
89 |
26 |
|
COL |
260 |
53 |
|
CZE |
71 |
12 |
|
DEU |
327 |
89 |
|
DNK |
37 |
4 |
|
ESP |
219 |
68 |
|
EST |
11 |
3 |
|
FIN |
67 |
7 |
|
FRA |
356 |
69 |
|
GBR |
84 |
86 |
|
GRC |
112 |
15 |
|
HRV |
39 |
5 |
|
HUN |
71 |
12 |
|
IRL |
36 |
5 |
|
ISL |
9 |
1 |
|
ITA |
310 |
83 |
|
JPN |
213 |
61 |
|
KOR |
64 |
22 |
|
LTU |
20 |
6 |
|
LUX |
2 |
1 |
|
LVA |
12 |
3 |
|
MEX |
601 |
92 |
|
NLD |
29 |
33 |
|
NOR |
106 |
4 |
|
POL |
233 |
55 |
|
PRT |
69 |
12 |
|
ROU |
124 |
32 |
|
SVK |
45 |
7 |
|
SVN |
15 |
2 |
|
SWE |
92 |
12 |
|
USA |
1259 |
211 |
Note: Number of FRAs and FUAs used for the analysis in subsection 3.1; and in subsection 3.2 where commuting data are available.
Source: OECD calculations based on FRA boundaries shared by the EC-JRC and data from the OECD Regions, Cities and Local Areas database http://oe.cd/geostats.