Switzerland has a stable, resilient, and high-performing economy. Agriculture represents less than 1% of GDP but is regarded as essential for food security and for the provision of valued public goods. This chapter first examines the agro-food sector’s structure, performance, and challenges. It explores the evolution of land use and production, characteristics of the ownership of farms, farm income and workforce specificities. It also presents the broader agro-food value chain, examining its structure, employment, market concentration, international trade, and participation in global value chains. The chapter then reviews demand side issues, through an assessment of domestic dietary patterns and consumption trends. The chapter concludes with an overview of the policy setting underpinning the agro-food sector, with particular attention to the role of direct democracy and the federal allocation of responsibilities.
Policies for the Future of Farming and Food in Switzerland

Abstract
Although agriculture contributes less than 1% to GDP, it is regarded as essential for food security and for providing valued public goods. Agricultural land has nevertheless declined since the 1980s, reflecting increasing pressure from urbanisation. Switzerland’s topography creates pronounced temperature differences and multiple microclimates. The most fertile agricultural soils are concentrated in valley areas, but farming activities take place across the country.
Despite structural change, marked by a halving of the number of farms since the 1990s, Swiss farms remain mostly family-run and clustered around the average size (22 ha). Production is dominated by livestock, particularly dairy. Organic farming has expanded significantly, driven by supportive policies and strong consumer demand; however, its growth has slowed down in recent years.
Direct payments are a key source of farm household income. Only 7% of Swiss farm households rely exclusively on farming, with mountain and hill farms depending more on government support and off-farm income.
Women account for only 7% of farm managers, despite much higher participation in family farm employment, agricultural training, and research. While there have been recent advances, persistent structural, cultural, and financial barriers continue to limit equality in the sector.
Ageing is a growing concern, with nearly one-quarter of farm managers aged 60 or over. As the eligibility for direct payments is capped at 65 years, a significant wave of farm transfers can be anticipated in the coming years, making it crucial to bridge the gap between low numbers of new entrants and the growing number of agricultural apprentices.
The broader agro-food value chain is a significant part of the national economy, generating 10% of employment. Market power is concentrated among a small number of actors upstream and downstream.
Switzerland is a net agro-food importer. Its exports are dominated by high value-added processed products, reflecting a strong presence in niche international markets. North America has become an increasingly important export destination. Swiss agriculture and food sectors have become more deeply integrated into global value chains over recent decades.
Swiss consumers have high purchasing power, show strong preferences for food produced domestically, and tend to favour products perceived as environmentally responsible.
The last national nutrition survey was conducted over a decade ago. Overall food availability has remained stable, but consumption patterns have shifted within food groups. Dietary habits also vary across linguistic regions. Diet quality remains a concern, with high intake of salt, sugar and saturated fats, and insufficient consumption of fruits, vegetables and nuts.
Federalism and direct democracy strongly shape the Swiss policy framework and decision-making processes. While agricultural policy design is relatively centralised, many policy areas related to food systems are decentralised or governed through shared competences.
Switzerland shows a high performance in many dimensions of economic and social development compared to other OECD countries, including GDP per capita, labour market indicators, and population well-being outcomes (OECD, 2020[1]; OECD, 2024[2]). With a land area of 41 290 km2 and a population of almost 9 million, it is relatively densely populated in comparison with other OECD Members. Switzerland brings together four distinct regions and four official languages within its small land area, organised as a federal state composed of 26 cantons.1
Around 70% of Switzerland’s territory is covered by mountains: the Alps run the width of the country covering 60% of its surface; to the West, the Jura covers around 10%. The remaining 30% of the territory is occupied by the Central Plateau, which houses around two-thirds of the country’s population and contains the most fertile agricultural soils. Differences in elevation and topography create important temperature variations and several microclimates, with the highest average temperatures found in the Ticino canton and the Plateau, and average temperatures decreasing as elevation increases in the mountainous areas. Switzerland is a water-rich country, with around 1 500 lakes and 61 000 kilometres of rivers and streams.
The Swiss economy has proven resilient through recent crisis events, including the COVID-19 pandemic and the turmoil following Russia’s war of aggression against Ukraine, with economic activity and income holding up well and inflation rising less than in most economies. This resilience is underpinned by a well-diversified and highly open economy, lower reliance on fossil fuels and robust macroeconomic policies, even if some uncertainty and challenges remain, including population ageing, slowing productivity growth, and a global shift towards increasing protectionism (OECD, 2024[2]).
1.1.1. The role of agriculture in the economy
Switzerland is a predominantly urbanised country
The national classification of rural regions is done at the commune level (the third or local level of government, see also Section 1.3 below). Communes are split into three categories (urban, peri-urban or rural) and then classified into a typology with nine categories based on density, size and accessibility (OECD, 2022[3]). Also relevant is the concept of “agglomerations”, or clusters of municipalities with an urban character and more than 20 000 inhabitants, generally consisting of a core city and its surrounding communes.2 With agglomeration areas defined, rural often means “not urban” or “not agglomeration”. As a result, several typologies of rural areas exist, including mixed rural/urban areas, rural areas close to cities, and remote rural areas (OECD, 2020[4]). According to the national definitions, in 2022 almost three‑quarters of the population lived in an agglomeration, and municipalities classified as rural were home to 14% of the population and 9% of jobs (Federal Statistical Office, 2024[5]). A trend of urbanisation has been ongoing for over a century, with the urban population steadily increasing − except during the 1980s, which saw a period of urban exodus (Federal Statistical Office, 2024[6]).
At the cantonal level and according to the Eurostat typology,3 only two Swiss cantons (Jura and Graubünden) are classified as predominantly rural, and only the latter is considered a remote rural region. Of the remaining cantons, 16 are classified as intermediate (areas where between 50% and 80% of the population live in urban clusters) and 8 as predominantly urban. Predominantly rural areas cover 19% of Switzerland’s territory, house 3% of its population and generate 3% of the economy’s gross value added (Figure 1.1), against averages of 45%, 21% and 15% respectively in the European Union (EU).
Distribution of territory, population and gross value added by urban-rural typology, 2023

Source: Eurostat (2025), Labour market statistics by other typologies [URT_D3AREA, URT_PJANAGGR3, URT_10R_3GVA, URT_LFE3EMP], consulted in May 2025.
Agriculture has a minor and declining role in the economy
The Swiss economy is service-driven. In 2022, services value added represented 74.5% of GDP (OECD, 2024[2]). The services sector employs almost 80% of the workforce. Services employment has consistently increased since the beginning of statistical records, surpassing primary sector employment in the early 20th century and overtaking industry as the main source of jobs by the mid-1970s (Figure 1.2). Human health and social work; wholesale and retail trade; and professional, scientific and technical activities are the largest services employers. In 2024, 4% of the workforce was employed in accommodation and food service activities, a share that has remained stable for the past two decades (Federal Statistical Office, 2025[7]).
Agriculture has a minor role in the Swiss economy. In 2022, agriculture, forestry and fishing value added was only 0.6% of GDP, the second lowest in the OECD after Luxembourg (OECD, 2024[8]). The sector’s employment share has been below 10% since the late 1960s, and in 2024 was only 2%. While the decline of agriculture is not unique to Switzerland, the sector’s relative importance in the Swiss economy is significantly below the OECD average and among the lowest in a group of peer countries4 (Figure 1.3).
Percentage of persons employed by economic sector, 1860-2024

Note: Primary sector refers to agriculture, forestry and fishing; secondary sector to industry and tertiary to services.
Source: Federal Statistical Office (2025), Federal Population Census (until 1960), Employment Statistics (since 1961), © FSO 2025.
Evolution of the share of agriculture in GDP and employment in selected countries, 2000-2024*

Note: * or the most recent year available.
Source: World Bank (2025), World Development Indicators; OECD (2025), [DSD_ALFS@DF_SUMTAB] Annual labour force survey, summary tables.
Despite its small size and declining economic importance, agriculture is perceived as essential for maintaining food security and providing positive externalities that are highly valued by the Swiss society (see Section 2.1.1). This may explain why agricultural policies are a relatively important part of the Swiss political landscape and are mostly managed at the federal level (see Section 1.3 below).
Despite a steady decrease over time, agriculture remains the main land use category
Agricultural land covers 38% of Switzerland’s land area,5 making it the largest land use category. A further 33% of land is covered by forests. As of 2022, the agricultural area was approximately 1.5 million hectares (ha), most of which were permanent meadows and pastures (including Alpine pastures).6 Arable land covered 0.4 million ha, or 27% of the agricultural area (Figure 1.4, panel a). Almost all arable land is on the Central Plateau and in the Jura. Meadows and pastures for livestock farming are mostly concentrated in Alpine regions, with some presence of orchards, vineyards and horticulture in the western central Alps (such as extensive viticulture in the lower Valais canton) (Federal Statistical Office, 2021[9]).
Land use and evolution of agricultural land

Source: FAOSTAT (2025), [Land use indicators], https://www.fao.org/faostat/en/#data/RL, accessed May 2025.
The Agricultural Act, which serves as the overarching law of the sector, calls for the consideration of difficult production and living conditions, particularly in mountainous and hilly areas. The Agricultural Zones Ordinance (SR 912.1 of 1998) divides the agricultural land into three areas: mountain, valley, and Alpine summering area (Sömmerungsgebiet). The mountain area is in turn subdivided into four agricultural production zones (Mountain Zones I to IV), and the valley area into two: Hill Zone and Valley Zone (Figure 1.5). This division takes into account criteria such as climatic conditions, transport situation, and the proportion of slopes. The Federal Office for Agriculture (FOAG) determines the boundaries in consultation with the respective cantons. These zones are the basis for the application of various agricultural policy measures, including differentiated direct payments (see also Section 2.2).
Boundaries of agricultural zones

Source: © Federal Office of Topography (swisstopo) and FOAG, https://map.geo.admin.ch/.
The agricultural area has decreased, but there is more diversification in crop farming
Agricultural land has steadily decreased over recent decades, particularly due to the pressure of growing settlement areas in a context of intensifying population growth. The Federal Statistical Office estimates that an area of agricultural land (including Alpine pastures) about twice the size of Lake Geneva was lost between 1985 and 2018. Over half of this land became settlement areas, particularly residential areas, while 30% was converted into new forests and woodland and 18% became unproductive land. The decline particularly affected the southern flank of the Alps and the western central Alps, which lost respectively 20% and 14% of their agricultural land (Federal Statistical Office, 2021[9]).
The total Utilised Agricultural Area (UAA) excluding Alpine summer pastures declined by 3% from 2000 to 2024. The surface of arable land dropped by 6%, with almost all major crops (most cereals, potatoes, and sugar beets) experiencing a reduction and fodder beets practically disappearing (Federal Statistical Office, 2025[10]). On the other hand, land for the cultivation of other crops expanded considerably in the same period. This includes the surface dedicated to oilseeds (particularly rapeseed, sunflower and soybeans) and legumes, as well as field vegetables and silage corn (used for animal feed) (Swiss Farmers' Union, 2024[11]), which points to some diversification of crop production.
Natural grasslands and pastures continue to dominate the agricultural landscape, even if their surface experienced a slight reduction. The decrease in the area of natural grasslands has been partly compensated by a 6% increase in the surface of artificial (cultivated) grasslands.
Composition and evolution of agricultural land, excluding summer pastures
1. Artificial grasslands are often associated with agricultural use and sown with legume-grass mixtures.
2. Litter meadows (Streueland or prairies de litière) are typically not fertilised and mowed once in the autumn, with the mowed material used as bedding for livestock. For examples of the types of grasslands in Switzerland see: https://www.eagff.ch/fr/connaitre-les-plantes-des-prairies/types-de-prairies/introduction-contexte.
Source: Federal Statistical Office (2025), Agricultural Structure Survey (STRU), https://www.bfs.admin.ch/bfs/fr/home/services/pour-medias.assetdetail.35270947.html
The utilised agricultural area is complemented by over 500 000 ha of alpine summer pastures (Federal Office for Agriculture, 2025[12]). Summer farming (Sömmerung or estivage) is an agricultural practice where ruminants are moved to alpine pastures during the summer months (FOAG, 2025[13]). It has been practiced for millennia, and in 2023 the Swiss alpine pasture season was inscribed on the Representative List of the Intangible Cultural Heritage of Humanity (UNESCO, 2025[14]). The number of animals moved to summer grazing has remained relatively stable over the long term (Federal Office for Agriculture, 2025[12]), with approximately 25% of livestock kept in alpine pastures on a seasonal basis to take advantage of the additional forage (Mack, Walter and Flury, 2013[15]).
Summer farming has external value for society beyond animal feed: it provides food associated with higher animal welfare, offers ecosystem services such as biodiversity conservation, creates recreational areas, and protects cultural heritage by attracting tourism and supporting rural populations (Meyer et al., 2025[16]). Despite this, the number of summer farms decreased from 7 472 to 6 566 between 2003 and 2023 (Federal Office for Agriculture, 2025[12]), with the practice threatened by climate change-induced water scarcity, land-use changes, the presence of wolves, and a limited availability of skilled labour (Meyer et al., 2024[17]).
1.1.2. Characteristics of Swiss farms and structural change in the agricultural sector
Most Swiss farms are family-run...
Most agricultural holdings in Switzerland are family farms. Even if it has no official definition, this type of holding is deeply engrained in Swiss tradition and long considered a cornerstone of the country’s agriculture (Federal Office for Agriculture, 2022[18]) (Swiss Farmers' Union, 2013[19]). In terms of legal forms, 90% of all farms recorded in the Agricultural Policy Information System (AGIS)7 in 2018 were owned by a natural person (a decrease from 94% in 2000), and a further 9% were simple partnerships (einfache Gesellschaft) (Zorn, 2020[20]) without legal personality or formal registration requirements. Legal entities remain rare in the Swiss agricultural landscape.
More recent data uses family employment as a key indicator. According to the 2024 Farm Structure Survey, family members accounted for 74% of all agricultural employees in 2024,8 down from 81% in 2000 (Federal Statistical Office, 2025[10]).
...but the share of non-family workers, including foreign nationals, is increasing
In line with the sector’s declining share in total employment, the number of persons employed in agriculture dropped from 203 793 in 2000 to 147 876 in 2024. However, the number of non-family employees remained relatively stable, resulting in an increase from 19% to 26% in their share of total employment. Foreign labour has also grown in significance: by 2024, foreign nationals accounted for 13% of the sector’s workforce, up from 7% in 2000 (Figure 1.6). Forty-four per cent of all farm employees (both family and hired workers) were employed full-time in 2024, a slight decrease from 47% in 2000.
Composition of the agricultural workforce, 2000-24

Note: Family employees include the farm manager and his/her immediate family working on the farm.
Source: Federal Statistical Office (2025), Farm Structure Survey 2024, accessed May 2025.
Agriculture has experienced significant structural change over time
The process of structural transformation in Swiss agriculture is illustrated by a steadily declining number of holdings. While in 1990 there were 92 815 farms, by 2024 their number had decreased to 47 075, or by 49% (Federal Statistical Office, 2025[10]). In the same period, the average (mean) farm size almost doubled, from 11.5 ha to 22.1 ha. This is above the average farm size in the European Union, which was 17.1 ha in 2020 (Eurostat, 2024[21]).
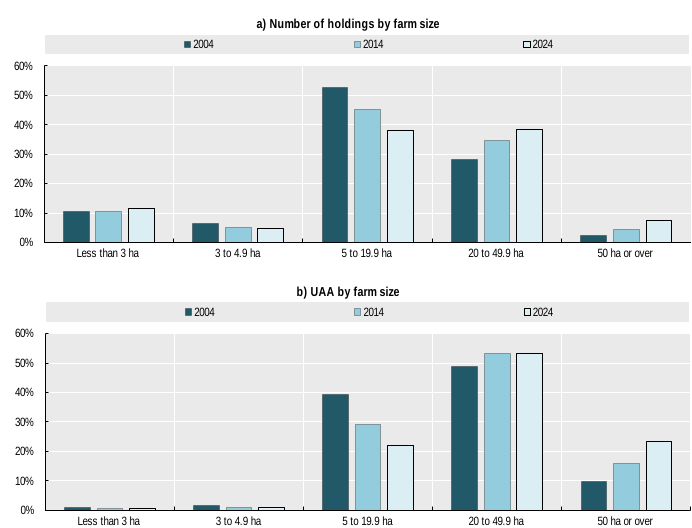
Most Swiss farms are distributed around the average of the size distribution. In 2024, farms between 5 ha and 49.9 ha made up 76% of holdings and held 75% of the utilised agricultural area (UAA) (Figure 1.7). Their absolute number decreased from around 64 000 units in 1990 to 35 970 in 2024. In particular, the group of farms with over 5 but less than 20 ha reduced its share in the total number of holdings and the UAA.
Farms with above-average size have gained significance over time, especially units of more than 50 ha. This is the only category that has consistently grown in number, from 675 holdings in 1990 to 3 459 in 2024. In 2024, larger farms represented 7% of all holdings and held almost one-quarter of the UAA, up from 2% and 10% respectively in 2004.
Distribution of Switzerland’s farm holdings and UAA by farm size (ha), 2004, 2014 and 2024
Note: The area excludes Alpine summer pastures.
Source: Federal Statistical Office (2025), Farm Structure Survey 2024, accessed June 2025.
Animals and animal products make up almost 60% of the agricultural output
The average value of the agricultural goods output (expressed in CHF at current prices) increased between 2004-06 and 2021-23, albeit with fluctuations throughout the period. Analysis of a longer time period reveals a declining trend of production value with respect to the late 1980s and 1990s (Eurostat, 2025[22]). Animal products made up 59% of the 2021-23 agricultural output (Table 1.2). In particular, milk represents around 27% of output, a share that has remained relatively stable over the last two decades. As a group, vegetables and horticultural products (including plants and flowers) had the largest crop share in the value of agricultural production (14%), followed by forage plants and fruits. The average agricultural services output reached CHF 771 million in 2021-23 and has increased continually over time.
Changes in the value and composition of agricultural output
Note: Production values at current prices.
Source: Eurostat (2025), Economic accounts for agriculture - values at current prices [aact_eaa01], accessed June 2025.
Cattle farms remain dominant despite shrinking farm numbers
The number of farms keeping animals has decreased over the last decades, in line with the overall trend. However, in some cases the stock of animals has not declined proportionally, pointing to a consolidation and an increase in the size of farms that hold animals (Federal Office for Agriculture, 2025[23]). This trend is observed in cattle, sheep, and pig farming, and is particularly pronounced for poultry farms, which decreased from over 21 000 to around 15 000 in 2024 while the poultry population almost doubled (Figure 1.8). Goat farming is another activity in which the number of animals has increased since 2000 despite a decline in the number of holdings.
Cattle farming remains the most important animal farming activity, accounting for over two-thirds of all Swiss farms in 2022-24, slightly down from 72% in 2000-02. Even though holdings with cattle declined by over one-third, the total number of cattle heads has remained relatively stable, and in 2022-24 stood at around 1.5 million. Dairy cows represented 34% of the cattle population at the end of 2025, while mother and beef cows made up 10%, and the remaining 56% were male animals and females not yet calved. Between 2010 and 2025, dairy cows declined by 13%, the second group grew by 34%, and the third fell by 4% (Identitas AG, 2026[24]). This evolution points to a shift from dairy to meat production.
Evolution of animal numbers, 2000-2024 (Index 2000 = 100)

Source: Federal Statistical Office (2025), Farm Structure Survey 2024, accessed January 2026.
Forty-nine per cent of holdings with cattle were in the mountain zones, and 16% in the hills. The share of farms situated in mountain areas was highest for goat (61%) and sheep farms (53%). In contrast, pig and poultry farming had a greater concentration in the valleys, accounting for 47% and 43% of holdings respectively. Across most major livestock activities, around 20% of holdings were organic; the exception was pig farming, with only 10% of organic farms. Organic farms are more frequently found in the mountain zones. In particular, over 60% of organic holdings with cattle, sheep, and goats were in the mountains.
In contrast to overall farming trends, organic agriculture has expanded
Switzerland is a pioneer in organic agriculture, with research and practices dating back to the first half of the 20th century. Key developments include the 1973 establishment of the private Research Institute of Organic Agriculture (known for its German acronym FiBL) − a leading institute in the field − and the start of the involvement of the federal agricultural research centre Agroscope and the federal government in the 1980s (Alföldi et al., 2006[25]).
Government support to organic agriculture through specific direct payments for farmers began in 1993. Between 1999 and 2023, the payment for organic production increased both in monetary terms, from approximately CHF 12 million to CHF 72 million, and from 1% to 3% of the federal spending on direct payments (see also Section 2.2.2 outlining the system of direct payments). Along with favourable government policy, demand for organic foods and a strong consumer preference for locally produced foods have been important drivers of the organic sector expansion, with retail sales growing eightfold between 2000 and 2023 (see also Section 1.2.3 and Box 1.5).
Contrary to overall farming trends, the organic sector has expanded. In 2000-24, the organic area (including land in transition) increased by 131% from 82 748 to 190 947 ha, and the organic share in total farmland increased from 8% to 18%. As of 2023, Switzerland was ninth in the world in terms of the organic area share (FiBL and IFOAM, 2025[26]). Two-thirds of the organic UAA are in the mountain and hill region. Grasslands make up 80%, with the remainder distributed amongst arable land (16%), permanent crops (2%) and other activities (3%). The canton of Graubünden has the largest organic area (37 197 ha or 19% of the total), even if it has only 5% of the country’s total UAA.
In 2024, there were 7 889 organic farms, an overall increase of 61% since 2000. Almost 6 600 (71%) had cattle. The distribution by size and share of the UAA is roughly similar to that of all farms, with holdings between 5 and less than 50 ha making up 77% of all organic farms and accounting for 84% of the organic UAA. The average organic farm had 24.2 ha, slightly higher than the general average of 22. Very small organic farms (of less than 5 ha) are less common, making up 8% of organic holdings (against 16% for all holdings).
Employment in organic agriculture almost doubled, from 14 227 in 2000 to 27 696 in 2024. Organic farms also have slightly higher shares of female employees (40% against 37% for all farms in 2024), non-family employment (32% against 26%) and foreign workers (16% versus 13% for all farms).
Despite its recent growth, the organic sector is not exempt from the structural changes affecting Swiss farming: while it successfully recovered from a contraction between 2007 and 2010, growth in the number of holdings and the organic area has recently slowed down (Federal Statistical Office, 2025[10]). In 2024, the number of organic farms slightly decreased for the first time since 2010, and the area remained roughly unchanged from the previous year. However, the total masks significant regional differences: declines in the number of farms in Valais and St. Gallen stand in contrast to increases in Geneva, Zürich and Neuchâtel (Federal Statistical Office, 2025[27]).
1.1.3. Farm and farm household income
Direct payments are an important income source for farm households
In general, agricultural labour income is lower than that of employees in the secondary and tertiary sectors, amounting to 88%, 61%, and 56% of the reference wage in the plains, hills, and mountain regions, respectively (Federal Office for Agriculture, 2025[12]). While farm household incomes vary among regions and farming activities, a common feature across Switzerland is a heavy reliance on government support in the form of direct payments.9 Approximately one-third of the household income comes from off-farm sources, including wages from employment outside of the farm (Renner and Schmid, 2024[28]). Direct payments are included in the revenue of farms and, therefore, considered an integral part of the farm household budget.
Total farm household income, measured by the Swiss Farm Accountancy Data Network (FADN) through a yearly survey, increased from CHF 88 347 to CHF 112 214 over 2015-23.10 However, if direct payments are subtracted, farm income is negative in all years but 2021 (Figure 1.9), which evidences the reliance on these payments and the difficulties for farms to achieve profitability without policy support.
Evolution of farm household income in CHF, 2015-23

Note: Based on a representative sample of farms participating in the Swiss Farm Accountancy Data Network (FADN) survey, Income Situation sample (Renner et al., 2019[29]).
Source: Data provided by Agroscope for the ongoing OECD project “Measuring income to respond to social issues in agriculture”.
Farmers in mountain and hill regions are particularly dependent on direct payments
Overall results mask significant heterogeneity amongst regions and farming activities. Farms in the valley region have the highest total household income – on average CHF 133 822 in 2023 – while the income of mountain farms was 30% lower, at CHF 92 057. Mountain and hill farms also rely more on off-farm income sources, which provide 36% of the total household income (against 30% for valley farms). Mountain farms (and to a lesser extent hill farms) also rely strongly on government support: farm income without direct payments was negative for both farm categories. Only valley farms achieved positive income without government support (Figure 1.10). In general, direct payments represented 97% of mountain farms’ household income in 2023, against 55% in the case of valley farms.
Average farm household income in CHF, 2023

Note: Based on a representative sample of farms participating in the Swiss Farm Accountancy Data Network (FADN) survey, Income Situation sample (Renner et al., 2019[29]).
Source: Data provided by Agroscope for the ongoing OECD project “Measuring income to respond to social issues in agriculture”.
Crop farms in general have the highest income; non-arable crops also show the lowest reliance on direct payments
The income of farm households also varies depending on their activities. In 2023, farms specialising in arable crops had the highest average household income (CHF 144 862, or 29% higher than the national average), closely followed by special crop farms with CHF 136 904.11 Pig and poultry farms, as well as farms that combine crop and dairy activities, also reported higher-than-average income. At the other end of the spectrum, farms specialising on horses, sheep or goats, and those with other cattle (different from dairy or suckler cows) reported the lowest household income, around CHF 92 000.
Special crop farms also rely less on direct payments, which make up 35% of their household income. Pig and poultry farms show the second-lowest reliance on government support (41%). Farms specialising on suckler cows, on the other hand, were the most dependent on direct payments for their household income.
Wage earnings from off-farm employment are an important income supplement
Only 7% of Swiss farm households rely solely on farming; the remaining 93% supplement the household's budget with income from non-farming activities. Between 2015 and 2023, off-farm income represented on average 32% of the total farm household income (Renner and Schmid, 2024[28]).
Wage earnings from employment outside the farm generate around 70% of all off-farm income. Farm operators and their spouses contribute roughly equally to the off-farm income through salaried employment, although the share of spouses’ wage income increased from 34% in 2015-17 to 37% in 2021‑23 (Renner and Schmid, 2024[28]). This is due to an increasing number of spouses taking up employment outside the farm, a significant rise in the average education level of farm operators’ partners throughout the years, and the fact that, on average, partners work more days per year in salaried employment. Other sources of off-farm income include pensions, state transfers (such as family and child allowances), as well as income from own non-farm businesses.
1.1.4. General landscape of the agro-food sector
The Swiss agri-food value chain is a significant part of the national economy, generating 10% of total employment and over 3.2% of gross value added in 2022 (Federal Statistical Office, 2024[30]). Agricultural output remains specialised in animal products, while processing is shaped by the use of Swiss agricultural inputs to serve the internal market and a competitive export-oriented segment-largely driven by a few multinational groups relying on imported (e.g. coffee, cocoa) or non-agricultural raw materials (e.g. mineral water). Food services account for the majority of jobs. The Swiss agricultural and food market is characterised by high market concentration and asymmetries both upstream and downstream the value chain (Federal Council, 2022[31]).
General structure of the food supply chain in Switzerland with selected statistics, 2022

Note: Gross value added is expressed in CHF million at current prices.
Source: Based on (Federal Statistical Office, 2024[30]).
A few co-operatives hold most market power upstream and downstream the food supply chain
In 2022 food wholesale accounted for around 3 200 establishments and 35 800 jobs with co‑operative Fenaco12 as market leader. Fenaco controls about half of the sales of Swiss potatoes and cereals, 65% of oilseeds, one-third of fruit and vegetables and a quarter of pork. It contributes to one-third of Switzerland’s compulsory food reserves (see Section 2.6.2) and is an important player upstream and mid-stream through its subsidiaries UFA (animal feed) and Anicom (livestock) (Agrarinfo, 2024[32]).
In the retail sector, Migros and Coop hold around 70% of the market (Federal Council, 2022[31]). Both are legally considered co-operatives, but they operate as business-oriented retailers. Both groups have stakes in processing companies and maintain their own wholesale and logistics systems. In Switzerland, private-labelled products13 have a share of over 50% (both in terms of volume and value) in most food and non-alcoholic beverages categories (NielsenIQ and PLMA, 2025[33]). In the last 15 years, hard discounters Aldi and Lidl have slowly gained market shares without significantly challenging the two leaders Coop and Migros.
The food industry contributes the most to value added while food services account for forty per cent of jobs in the value chain
Food and tobacco industries contributed CHF 13 billion to Switzerland’s gross value added, above food services (CHF 7 billion) and agriculture and fisheries (CHF 5 billion) (Federal Statistical Office, 2024[30]). Switzerland is home to a significant number of multinational agrifood companies that are recognised as global leaders in their respective domains. Nestlé, headquartered in Vevey, is the world’s largest food and beverage company, with operations spanning all levels of global value chains. Syngenta AG, based in Basel, is a major global manufacturer of seeds and crop protection products, although most of its production takes place outside Switzerland (Gentile et al., 2019[34]).
A dual structure characterises food and beverage industries in Switzerland. Export-oriented processors that rely on imported raw materials (coffee, chocolate) and mineral water are the most competitive and report high turnover. Among the ten food and beverage processors with the highest turnover, only one relies mainly on Swiss agricultural raw materials. Industries that rely more heavily on Swiss agricultural products tend to serve mostly the domestic market (except for cheese). Within these industries, the meat and dairy sectors are core branches. Animal products represented 42%14 of households’ food expenditure in 2022 (Federal Statistical Office, 2024[35]). International competitiveness of the food industry is hindered by trade policies that raise the prices of imported inputs (OECD, 2015[36]) (see also Sections 1.1.6 and 2.5).
Restaurants, canteens and other food services employed 183 400 people in 2022. Restaurants and cafés lead meal and drink consumption in Switzerland, but their share has decreased while fast food and takeout have grown (GastroSuisse, 2025[37]). In 2018, there were 4.2 quick-service restaurant outlets per 1 000 inhabitants, above the European mean of 1.8 (Van Dam et al., 2021[38]). Retail trade has maintained a stable market share, while canteens and cafeterias have declined, and smaller channels such as bars, vending machines, and anti-waste initiatives account for only marginal shares. Cross-border food shopping is a common food practice among Swiss consumers, as prices are high and foreign markets easy to access (see Section 2.7).
Direct marketing and online purchases are gaining importance
While direct sale to consumers represents a small fraction of farmers’ income, the number of farmers who engage in direct marketing doubled in 2010-20 and now covers around one-fourth of farmers (Agristat, 2025[39]). This trend has been steady and visible across Swiss regions (Figure 1.12). Direct marketing can strengthen farmers’ position in the value chain, diversify their income and foster local development.15 According to a survey by Fédération romande des consommateurs (FRC), production costs account for 65-85% of the sale price in short supply chains for apples, carrots and potatoes (FRC, 2024[40]). Price differences compared to retailers vary significantly by product type, variety and season.
Share of farms with direct marketing.

Note: Numbers in bars refer to number of farms.
Source: (Agristat, 2025[39]).
Online food purchases are a growing trend in Switzerland. In the past decade, online shopping has gained in popularity, although it still only accounts for a modest share of 15% of total retail sales (Swiss Federal Authorities, 2023[41]). Greater convenience and price advantage are the most important reasons for shopping online. Nearly 60% of respondents to a 2023 survey indicated buying food and beverages online (Switzerland Innovation, 2024[42]). In 2023, the average online food spending of the Swiss population was CHF 1 284, compared to EUR 626 in Italy. When adjusted using OECD purchasing power parities for food and non-alcoholic beverages,16 the difference narrows to 20%.
Dairy is the main agro-food sector, largely driven by cheese production
Dairy is the most important branch of the Swiss agro-food sector and holds strong cultural significance. Milk production is widespread and accounts for 27% of the country’s agricultural output (TSM et al., 2024[43]). Dairy processing represents 19% of food manufacturing GDP (Leinert, Brand and Duma, 2016[44]) and Swiss households allocate 16% of their food budget to dairy products (Federal Statistical Office, 2024[35]). Dairy cows produce over 99% of national milk output, while small but locally significant volumes of goat’s milk (0.7%) and sheep’s milk (0.2%) are also produced and often used in specialty cheeses (TSM et al., 2024[43]). Figure 1.13 illustrates the main structure of the dairy value chain in Switzerland, focusing on cow’s milk.
In 2023, Switzerland produced 3.74 million tonnes (Mt) of cow milk. Of this, 3.3 Mt were marketed, while about 11% remained on farms, mainly for calf feeding (TSM et al., 2024[43]). About one-third of marketed deliveries originated in mountain regions, where farms are characterised by smaller herds, lower yields, and a stronger reliance on alpine pastures. The remaining two-thirds came from valley and hill regions, where milk production tends to be more intensive. Roughly 31% of marketed milk was produced without silage, a requirement for many PDO/IGP cheeses.

Note: Apparent consumption is an estimate of domestic use of dairy products, calculated as domestic production + imports – exports ± stock changes, divided by population. Volumes are expressed in whole milk equivalents. *Market share of retail includes 1.5% of direct sales.
Source: Based on (TSM et al., 2024[43]).
Producer organisations and co‑operatives are the main first buyers of milk. Around one-third of production is sold directly to cheese co‑operatives, with the remainder purchased by milk-trading co‑operatives (e.g. Mooh, ZMP) or vertically integrated co-operatives (e.g. VBMC/APLC with Cremo or ELSA with Migros) (PSL, 2025[45]) (PSL, 2024[46]). The sector organisation Interprofession du Lait (IP Lait) sets reference prices, co-ordinates supply management, and mediates between producers and processors (IP Lait, 2017[47]).
Artisanal cheesemakers include village dairies, alpine dairies and PDO/IGP such as Gruyère AOP or Emmental AOP. Industrial dairies (e.g. Emmi, Cremo, Hochdorf) process milk into a wide range of products, from drinking milk and butter to powders, yogurts, and non-PDO cheeses. Processing output is mainly cheese (45%), butter (15%), drinking milk (10%) and milk powder (10%) (TSM et al., 2024[43]). The sector maintains a positive trade balance, with cheese accounting for 75% of exports and 45% of imports.
Most dairy products are sold through retail (70%) and food services (30%). Direct sales by farmers and small cheesemakers remain modest (1.5%) but have shown a steady growth. Switzerland is self-sufficient in milk, as the caloric energy content of domestically produced milk represents 113% of total consumption (Agristat, 2025[48]). Usable energy refers to the caloric energy content of milk that is available for human consumption after accounting for processing and losses. Over recent decades, consumption has slightly decreased and consumer habits shifted: milk consumption has steadily declined, while cheese, yogurt and other dairy products have remained stable or increased (TSM et al., 2024[43]) (Federal Statistical Office, 2013[49]). Annual apparent consumption of dairy products is high when compared to peer countries (Figure 1.14).
Per capita consumption of processed and fresh dairy products in milk solids

Note: Milk solids are calculated by adding the amount of fat and non-fat solids for each product. “Others" include processed dairy products such as skim milk powder and whole milk powder.
Source: (OECD/FAO, 2025[50]).
1.1.5. Inclusiveness of the sector
Women represent 38% of family farm labour but only 7% of farm managers
Women play a vital role in Swiss agriculture, making up a significant share of the sector’s workforce and contributing meaningfully to agricultural education and research. For example, in 2023, 60% of agricultural and veterinary researchers in the higher education sector were women (Federal Statistical Office, 2025[51]). However, female farm managers remain underrepresented. In 2023, women accounted for 37% of the total agricultural workforce,17 but only 7% of farm managers were women, well below the proportions observed in the EU-27 (32%), Austria (35%) or Norway (17%) in 2020 (Eurostat, 2024[52]). This figure refers to the percentage of women that are the sole managers of the farm and does not take into account those that co-own or co-manage a farm. The national average masks notable regional differences: in 2023, the cantons of Ticino, Valais and Geneva all had over 15% of female farm managers, while the canton of Nidwalden had the lowest share (3.8%) (Swiss Farmers' Union, 2025[53]).
The percentage of female-run farms has grown over time: in 2000 only 3% of farms were led by women; by 2017 this share had doubled to 6%, further increasing to 7% by 2023. Moreover, even in a context of country-wide decrease in the number of holdings, the absolute number of farms managed by women is increasing, although it remains low, at 3 479 in 2023 (Federal Office for Agriculture, 2025[12]).
Farms run by women tend to be smaller than average. Seventy-eight per cent of female-run farms had a size of less than 20 ha, below the national average. Furthermore, only the two smallest size categories had a higher-than average share of female managers in 2023, even if the share of female managers increased between 2000 and 2023 for all size categories, including larger holdings (Figure 1.15).

Source: Data from the Federal Statistical Office, obtained from (Federal Office for Agriculture, 2025[12]) and (Federal Office for Agriculture, 2018[54]).
The largest number of women work part-time as family employees
In 2023, there were 54 732 women working in agriculture. Seventy-six per cent of the female workforce (including managers, family and non-family labour) worked part-time in the farm, a share that has remained almost unchanged since 2000. Both the number and the percentage of non-family female employees have increased since 2000.
There is a clear distinction between men and women in agriculture in terms of representation, roles, and challenges. The FOAG monitors the situation of women and female farm managers and publishes studies in a 10-year interval since 2002. The most recent report, published in 2022 and based on an online survey of 778 women and four group discussions, revealed that women still see themselves mostly in traditional roles, even if this is gradually changing. Only 9% of the women surveyed considered themselves sole farm managers, although this proportion both has increased over time (from 5% in 2012) and is significantly higher (26%) amongst women of 35 years and younger. Most women (68%) reported managing farms jointly with their partner (Moser and Saner, 2022[55]).
Several factors, including farm mechanisation, increasing off-farm employment, and increased access to education and training, are driving changes in women’s self-image and roles. Women now make up 22% of young trainees in agriculture (Federal Office for Agriculture, 2025[12]). Additionally, 19% of graduates from the EFZ (Federal Certificate of Competence) farmer apprenticeship programme in 2020 were female (Giner, Hobeika and Fischetti, 2022[56]). Nevertheless, traditional roles continue to influence educational and professional pathways, and structural, cultural, and financial barriers towards the equality between women and men remain (Box 1.1). Section 2.3.4. discusses recent policy efforts to improve the situation of women.
The agricultural landscape in Switzerland is largely dominated by men. Legal and financial insecurities remain pressing issues for women in agriculture. A high share of women work in the sector without formal recognition as co-owners (Contzen, 2022[57]). As a result, they are often excluded from inheritance, social insurance, and pension benefits, and remain invisible in official statistics and policymaking (Contzen and Forney, 2016[58]).
The underrepresentation of women in leadership roles within agriculture is linked to the traditional customs of Swiss farming families. Contzen and Forney (2016[58]) note the long-lasting prevalence of an unequal and gendered division of labour that they consider structurally rooted in Swiss family farming, which influences women’s legal status, income, and social security. In Switzerland, farms are typically passed down from father to son following a patrilineal tradition, which makes it more difficult for women to take on roles as farm managers (Giner, Hobeika and Fischetti, 2022[56]).
Gender-specific curricula in formal training could also contribute to women’s dependency on their partners. For instance, the “Farmer's Wife/Farm Household Manager” course emphasises household management over technical or leadership skills, reinforcing conventional roles for women on farms (Giner, Hobeika and Fischetti, 2022[56]). This programme is expected to change following an ongoing revision of higher vocational education. The anticipated changes include a new course name and a stronger emphasis on technical content.
The lack of social security coverage of women in agriculture remains a key challenge. Even if the situation has improved over time, in 2022, 4% of women had no personal social security or pension plan, only 57% had an individual pension plan, and only 44% had an occupational pension plan (FOAG, 2022[59]). This may be explained by the fact that, under social security law, family members working in agriculture are treated as self-employed persons, for whom taking out insurance beyond the mandatory basic coverage is voluntary. This is specific to agriculture and differs from other sectors, where family employees are entitled to all the social benefits of salaried workers (Contzen and Burren, 2020[60]) (Binder, 2023[61]).
Another concern is the situation of women in the event of a divorce. In 89% of divorces in farm families, the man is registered as the sole owner of the farm (Contzen and Burren, 2020[60]). Additionally, women are poorly socially protected and at risk of losing or not receiving adequate compensation in case of divorce. Non-remunerated working hours and other non-recorded contributions for the family are difficult to track and contribute to over twice as many contentious divorces in farm families compared to the rest of society (Contzen and Burren, 2020[60]). Recent policy reforms aim to improve social insurance coverage for farmers’ spouses and partners and to provide greater security to spouses working on farms in the event of a divorce (see Section 2.3.4).
Farm managers are getting older...
The age distribution of farmers has changed substantially over the past two decades. In 2000, 71% of managers were under 55 years old.18 This share has declined to 58% in 2024 (Figure 1.16). Almost one-quarter of farm managers are now aged 60 or over. When all people working in agriculture are considered, 40% were 55 years or older in 2023, slightly above the OECD average and similar to Germany (FAOSTAT, 2025[62]).
Like in other countries, population ageing is a general concern in Switzerland. This structural shift is well anticipated and has been highlighted in OECD analysis and recommendations (Lewis and Ollivaud, 2020[63]; OECD, 2024[2]). However, the problem is particularly acute in the primary sector: at 47.9 years, the average age of the working population is the highest of all economic sectors, and nearly six years higher than the general average (Federal Statistical Office, 2025[64]). In addition, self-employed people (a category that includes family farm workers and most farm managers) are on average seven years older than employees (Federal Statistical Office, 2025[64]). This poses sector-specific challenges.
Looking specifically at farm managers returns an even higher average age (50.1 years in 2020). An analysis of demographic developments between 2004 and 2020 shows that farm managers were on average 60.5 years old when handing over their farm, with the handover age increasing by almost three years over the period (Zorn, 2025[65]). In Switzerland, farm managers lose the eligibility to receive direct payments after the age of 65, which is also the statutory retirement age. This creates an economic incentive for handing over the farm to a younger successor. In light of the average age of current farm managers, a high number of farm transfers can be foreseen over the next years, with an estimated 7 000 farm managers reaching the age limit of 65 between 2026-30 (Zorn, 2025[65]).
Transferring a farm at retirement age does not necessarily end a farmer’s involvement in agriculture. In Switzerland, many farmers continue working on the farm after 65 and often remain closely involved in its operations, even when direct payment entitlements have passed to a younger relative. Even if the farm is leased outside of the family, the retired farmers may still stay in the farm and help the tenants (Contzen et al., 2016[66]). Such arrangements rely on intergenerational collaboration, and on family and agricultural solidarity networks (Bruttin, 2026[67]).
At the same time, retiring can be challenging, as the individual’s identity is often strongly tied to farming. The farm transfer process can be demanding for both the retiring and succeeding generations (Häberli and Contzen, 2021[68]). For example, interviews highlighted intergenerational tensions related to role adjustments, as well as feelings of loneliness or vulnerability among retired farmers (Bruttin, 2026[67]). Yet, some older farmers also report relief at no longer being responsible for administrative tasks and appreciate the gradual transition, which avoids abrupt changes and allows them to feel needed and able to pass on knowledge to the younger generation (Contzen et al., 2016[66]). Section 2.3.4 discusses some efforts to facilitate and support farm transfer.
...while new entrants are fewer but better prepared for a food systems transformation
In line with the overall decrease in the number of farms, there has been a decline in the number and share of young farmers over the last two decades. In 2024, 10% of farm managers were younger than 35 years,19 against 14% in 2000 (Federal Statistical Office, 2025[69]). However, more recent data point out to a stabilisation of this share, even if the analysis remains limited by the fact that data exists only for those farm managers for whom age information is available. The ratio of farmers younger than 35 to farmers older than 55 has slightly decreased over the last two decades (Figure 1.16).
Evolution of the age structure of farm managers and the ratio of young farmers

Note: Only includes farm managers for which age data is available.
Source: Federal Statistical Office (2025). Agricultural Structure Survey (STRU).
Newcomers can enter agriculture through different paths. They can either be relatives taking over a family farm, or new farmers that have some work experience in agriculture or are entirely new to the sector (Campi et al., 2024[70]), and they can either take over an existing farm or start a new one. The Swiss regulatory landscape tends to favour transfers within the family (see Section 2.3.2).
For the succession of existing farms, Zorn (2025[65]) found that the average age of farm managers taking over was 36.7 years. Earlier research on the determinants of succession in Swiss agriculture found that farm succession is influenced by economic, social and cultural factors, with the probability of a farm being taken over increasing with the farm size and number of sons, and with farms in mountainous regions more likely to be taken over than those in valley and hilly regions (Rossier and Wyss, 2006[71]).
New entrants (those appearing in the farm register for the first time) had a relatively higher average age (42.1 years). In 2020, they made up only 0.5% of all farms; moreover, between 2004 and 2020 the number of new entrants decreased at a faster rate than the total number of farms (Zorn, 2025[65]).
Mountain areas tend to have younger managers taking over existing farms and a higher rate of new entrants. This can be surprising given the difficult production conditions in the mountains, and could be explained by a greater relevance of family traditions, emotional ties to animal husbandry, special funding programmes for mountain regions, and fewer non-agricultural employment opportunities (Zorn, 2025[65]).
These demographic trends illustrate the structural change taking place in Swiss agriculture over the past decades and offer insights into developments ahead. While the overall number of farms is declining, the number of new farms is doing so at a faster rate. The current age structure of the sector and the regulations on maximum age for accessing direct payments allow to foresee more farm exits over the coming years, which creates a challenge for the continuation of agriculture.
The decreasing rate of new entrants is contrasted by a long-term positive trend in the number of apprentices in agriculture (Federal Office for Agriculture, 2025[12]). This indicates that the sector remains attractive to young people and calls for looking into factors that could be potential barriers for new entrants. The involvement of young farmers could also contribute to the sustainable transformation of the sector, as they have higher participation in animal welfare and most environmental programmes (Zorn, 2025[65]). For example, (Mack, Ritzel and Jan, 2020[72]) found that farms managed by young farmers with higher education levels tend to have higher proportions of result-oriented ecological focus areas.20 In general, new entrants into agriculture can be key players in transforming food systems: they are younger, have higher levels of education and entrepreneurial skills, and are more likely to adopt new technologies, which can enhance agricultural productivity and competitiveness (Campi et al., 2024[70]).
1.1.6. Trade and participation in global value chains
Switzerland is a net agro-food importer; its exports are dominated by processed products
Switzerland is a net importer of agricultural and food products, which account for only a small share of its total trade in goods: around 3% of export value and 5% of import value in 2024 (United Nations, 2025[73]).21 The value of the agro-food trade deficit grew from USD 2.8 billion in 2000 to USD 5.6 billion in 2024, although its relative size declined from about 40% of agro-food trade in the 1990s and early 2000s to 19% in 2024. While export growth generally outpaced import growth before 2015, the past decade has seen a reversal of this trend, with import growth exceeding that of exports in most years. Processed products for final consumption constitute almost 90% of agro-food exports and 48% of imports (Figure 1.17).

Note: The agro-food definition does not include fish and fish products. Agro-food codes in H0: 01, 02, 04 to 24 (excluding 1504, 1603, 1604 and 1605), 3301, 3501 to 3505, 4101 to 4103, 4301, 5001 to 5003, 5101 to 5103, 5201 to 5203, 5301, 5302, 290543/44, 380910, 382360.
Source: Calculations based on UN Comtrade (database), http://comtrade.un.org/ [accessed July 2025].
Trade patterns reflect a specialisation in agro-food processing
Switzerland’s agro-food exports are concentrated on a few product groups, with the top ten subheadings making up over three-quarters of 2024 exports. At the top is roasted coffee (both caffeinated and decaffeinated), with over one-third of exports. Non-alcoholic beverages, chocolate, cheese, and food preparations (such as sugar-free chewing gum and candies)22 are also among the top exports. While imports are more diversified − the top ten subheadings make up only 30% of imports – the presence of subheadings from the exported product categories evidence Switzerland’s specialisation in high value-added processed products. This is particularly the case in the coffee and chocolate sectors, where raw materials such as unroasted coffee and cocoa beans are imported, processed and exported.
Top 10 agro-food subheadings exported and imported in 2024
Note: The HS descriptions have been simplified and are provided only as a reference.
Source: Calculations based on UN (2025), UN Comtrade (database), http://comtrade.un.org/ [accessed July 2025].
Given this increasing specialisation, inward processing – the temporary import of goods for processing and subsequent re-export – is particularly relevant for Switzerland. In 2023, agro-food imports for inward processing amounted to CHF 244 million and included sugar, boneless beef, vegetable fats and oils, whey, butter and other milk fats, and milk powder. Re-exports reached CHF 2.4 billion, or 23% of all agro-food exports, and included soft drinks, food preparations, chocolate, and dried beef. Outward processing (the temporary export of goods for processing and subsequent re-import) is less significant but has nonetheless increased over time. In 2023, only CHF 32 million (0.3% of agro-food exports) were handled as outward processing, while re-imports amounted to CHF 71 million or 0.5% of agricultural imports (Federal Office for Agriculture, 2025[74]).
Switzerland’s specialisation reflects a competitive advantage in high value-added products that are often well-positioned in niche international markets (Fiankor et al., 2025[75]). Previous OECD work examined the competitiveness of the Swiss food and beverage industry. The analysis found that, while the overall industry had a relatively strong position against main competitors in the European Union, performance varied widely across sub-sectors, with very strong performers such as the cocoa and chocolate and the beverage industries driving the positive results, while meat and dairy processing (which mainly rely on domestic inputs) had a much weaker position and faced relatively high costs.
Switzerland has positioned itself as a global leader in coffee processing. Coffee exports, which were negligible at the beginning of the 2000s, started growing in the second half of the decade, making Switzerland the top world exporter of roasted coffee by 2009. As of 2024, the country accounted for one-quarter of the world’s roasted coffee exports (Box 1.2).
The composition of agro-food exports over the last two decades illustrates these changing dynamics (Figure 1.18): coffee increased its share from less than 5% to over one-third of exports, while the relative size of other sectors such as dairy and food preparations decreased (even if their export value increased). The share of cocoa and chocolate in total exports has remained relatively stable, while exports of non-alcoholic beverages shrunk both in value and share after 2014 following a significant expansion.
Composition of agro-food exports, 2004, 2014 and 2024

Note: Export sectors defined at the HS chapter level: dairy (04), coffee (09), cocoa and chocolate (18), cereals and food preparations (19 and 21), beverages (22).
Source: Calculations based on UN Comtrade (database), http://comtrade.un.org/ [accessed July 2025].
More recently, uncertainties in global markets and in the trade policy environment challenge the perspectives of the Swiss export industry. In August 2025, the United States (the second most important agro-food export market) imposed additional tariffs of 39% on all imports from Switzerland.23 As other US trading partners faced lower tariffs, this put Swiss exporters at a competitive disadvantage (State Secretariat for Economic Affairs, 2025[76]). However, these measures were revised following a joint statement issued in November 2025. Under this agreement, the US reduced the tariff surcharge to 15% in exchange for Switzerland’s commitment to reduce tariffs on certain US agricultural products and establish duty-free bilateral TRQs for beef, bison meat, and poultry meat. The authorities consider that these tariff reductions are consistent with the objectives of Swiss agricultural policy.
The Swiss franc has also appreciated significantly over the last 15 years, and this trend accelerated in the first half of 2025. Research on a previous appreciation episode found a relatively small impact on Swiss agro-food exports, suggesting that exporters were able to avoid the effects of price competition by focussing on quality to differentiate their products (Kohler and Ferjani, 2018[77]). However, the current context of currency appreciation combined with increased tariffs by a key trading partner may have a stronger impact.
The import composition, on the other hand, has remained relatively stable. The products that stand out as having increased their shares in agro-food imports between 2004 and 2024 include coffee (from 4% to 9%), cocoa (from 3% to 7%), and cereal preparations (from 4% to 7%) (United Nations, 2025[73]).
Coffee is one of the most widely traded commodities. It is primarily grown in tropical developing countries, and the early production stages (cultivation, harvesting, post-harvesting) are labour-intensive, while subsequent processing stages are capital-intensive. Most producers export raw (green) coffee beans. However, over the past decades, world exports of processed coffee have increased far more rapidly than green coffee exports (577% vs. 66% between 1991-94 and 2015-18), with non-producers playing an increasingly important role in global coffee trade (International Coffee Organization, 2020[78]).
Switzerland’s strategic location, business-friendly environment and strong innovation system have helped it become a key player in the global coffee market. Major trading and processing companies are headquartered in Switzerland, including Nestlé, which roasts and processes all its coffee domestically.
Swiss roasted coffee exports begin rising around 2007 and have increased eightfold in value since. Between 2000 and 2024, Switzerland’s share in global exports grew from 2% to 25% (Figure 1.19).

Note: HS codes 0901.21 and 0901.22.
Source: Calculations based on UN Comtrade (database), http://comtrade.un.org/ [accessed July 2025].
Switzerland differs from other major roasted coffee exporters in the diversification of its green coffee sources. While Italy and Germany – the second and third-largest exporters in 2022-24 – each sourced around 55% of their green coffee imports from just two suppliers (Brazil and Viet Nam), Switzerland’s imports are less concentrated (Figure 1.20, panel A), creating opportunities for coffee suppliers of different sizes and profiles (CBI, 2022[79]). The United States is the most important destination market for roasted coffee exports (Figure 1.20, panel B).

Note: HS codes 0901.11 and 0901.12 (green coffee) and 0901.21 and 0901.22 (roasted coffee).
Source: Calculations based on UN Comtrade (database), http://comtrade.un.org/ [accessed July 2025].
While tariffs and non-tariff barriers on processed coffee remain an obstacle for producing countries to access consumer markets in developed countries, integration into the global coffee value chain presents opportunities to improve the living standards of producers and workers and address negative environmental impacts. In particular, Voluntary Sustainability Standards − widely adopted in the sector and promoted by leading companies – have played a role in promoting sustainable practices and better working conditions in the sector (International Coffee Organization, 2020[78]).
The Swiss federal government supports private-sector efforts. For example, the Swiss Sustainable Coffee Platform (SSCP), launched in 2024, brings together traders, roasters and retailers, as well as non-profit organisations and academia, to foster peer learning and collaboration on sustainability challenges. The government also earmarked CHF 8 million of public funds to co-finance development co-operation projects in producing countries (Federal Department of Foreign Affairs, 2025[80]).
Export markets have become more diversified over time
Half of Switzerland’s 2024 agro-food exports went to the European Union, with Germany remaining the traditional primary destination for Swiss products (Figure 1.21). However, there has been a notable diversification of export markets over the last two decades, with the share of the EU declining from 70% in 2004 (and Germany’s from 23% to 17%). In particular, the North American market has gained importance: exports to the United States and Canada grew by over 700% between 2004 and 2024. The United States emerged as the second-largest destination market for Swiss exports, accounting for 16% in 2024. While exports to the United States are now at a comparable level to those to Germany, the export profile to each market is distinct: exports to the US are heavily concentrated in coffee (56% in 2022-24), while those to Germany are more diversified, with cheese and pet food among the leading categories.
Main export destinations for agricultural and food products, 2024

Source: Calculations based on UN (2025), UN Comtrade (database), http://comtrade.un.org/ [accessed July 2025].
The relative importance of the European Union is greater on the import side: three-fourths of agro-food imports come from EU Member States, with neighbours Germany, Italy and France accounting for 44% in 2024. Brazil is the most important non-EU import supplier, followed by the United States and Colombia (Figure 1.22).
Main import sources for agricultural and food products, 2024

Source: Calculations based on UN (2025), UN Comtrade (database), http://comtrade.un.org/ [accessed July 2025].
Integration of the agro-food sector into global value chains has deepened
The production of food increasingly takes place across different countries and uses inputs sourced from all over the world. Globally, there has been a significant expansion of agro-food trade related to global value chains (GVCs)24 over the past decades. Indicators of backward and forward participation25 in GVCs for agriculture and food production show that Switzerland has not been an exception to this trend.
Backward linkages, measured by the share of imported intermediate goods and services embodied in Switzerland’s agro-food exports to the world, increased in 2022 with respect to 2000, particularly for agriculture. At 30% and 33% in 2022, the foreign content of agricultural and food exports was above the OECD average and the shares shown by most peer countries (Figure 1.23).
Foreign value added as a percentage of sector’s total gross exports, 2000 and 2022

Notes: “Agriculture” includes forestry, “Food & bev” refers to the food, beverages and tobacco manufacturing sector. The share for the OECD is a simple average of the shares of all members.
Source: OECD (2025), Trade in Value Added (TiVA) - Principal Indicators, shares [database], oe.cd/tiva (consulted September 2025).
The share of Swiss agro-food value added meeting the final demand of foreign consumers also increased between 2000 and 2022, for both agriculture and the food and beverage industry. This provides evidence of a deeper forward participation in GVCs. In 2022, 25% of agricultural and 29% of food value were driven by foreign final demand, against 14% and 20% respectively in 2000. At the same time, this indicator is below the OECD average (Figure 1.24).
Domestic value added in foreign final demand, as a percentage of sector’s value added, 2000 and 2022

Note: “Agriculture” includes forestry, “Food & bev” refers to the food, beverages and tobacco manufacturing sector. The share for the OECD is a simple average of the shares of all members.
Source: OECD (2025), Trade in Value Added (TiVA) - Principal Indicators, shares [database], oe.cd/tiva (consulted September 2025).
Services make a higher-than-average contribution to the value of agro-food exports
Services are a major contributor to the Swiss economy, including the agriculture and food sectors. In 2022, domestic and foreign services contributed 40% to the value of agricultural exports and 45% to food exports, above the OECD average and the shares shown by all peers (Figure 1.25). The services content of exports also increased with respect to 2000, highlighting the trend of “servicification” of global value chains.26 While most value comes from domestic services, the foreign service content also experienced an increase, from 10% to 18% for agriculture and from 13% to 19% for food and beverages.
Services value added content as a percentage of sector’s gross exports, 2000 and 2022

Note: “Agriculture” includes forestry, “Food & bev” refers to the food, beverages and tobacco manufacturing sector. The share for the OECD is a simple average of the shares of all members.
Source: OECD (2025), Trade in Value Added (TiVA) - Principal Indicators, shares [database], oe.cd/tiva (consulted September 2025).
Foreign industries contributed almost 40% of the value of domestic food demand
In the context of GVCs, the value of final demand goods and services consumed within a country is an accumulation of value generated by different industries across many countries. For Switzerland, 47% of the value added in domestic demand for food, beverages and tobacco comes from foreign sources. The most important sources of value added are the domestic and foreign services industries, which together contributed almost half of value added. The distribution between domestic and foreign value-added sources is roughly in line with the OECD average (Figure 1.26).
Origin of value added in domestic demand for food, beverages and tobacco, 2022
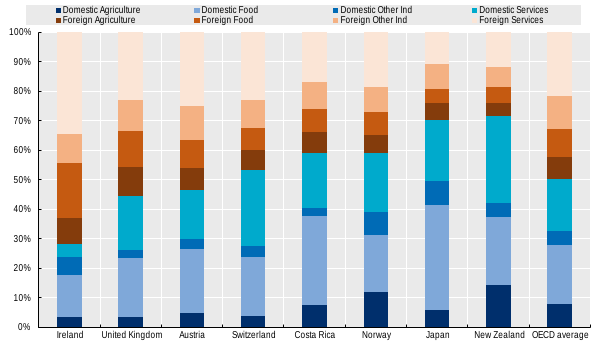
Note: The OECD average is a simple average of the values of its members. Countries are sorted according to the share of foreign value.
Source: OECD (2025), Trade in Value Added (TiVA) - Origin of value added in final demand [database], oe.cd/tiva, consulted September 2025.
1.2.1. Data sources on food consumption and diets
Multiple sources inform on Swiss diets, yet the last national nutrition survey took place over a decade ago
Various complementary sources provide information on food consumption in Switzerland. Food balance sheets are published annually by Agristat in co-operation with the Federal Statistical Office and monitor food availability for domestic consumption. Reports on household expenditures are also published annually and provide insights into trends in food expenditures and its distribution across food groups. The Swiss Food Composition Database, operated by the Federal Food Safety and Veterinary Office (FSVO), offers data on the nutrient composition of foods available in Switzerland (FSVO, 2025[81]). The Swiss Health Survey is a cross-sectional survey conducted every five years and provides nationally representative information on the health status and behaviour of the Swiss population, including basic dietary habits.
Dietary surveys and purchase-based analyses can provide relevant insights on dietary habits in Switzerland. In 2014-2015, the first national nutrition survey (menuCH) was conducted, providing representative information used by government and researchers to study the dietary behaviour of the Swiss adult population (Box 1.3). As in other OECD countries, funding remains a major constraint for regularly updating these surveys (Giner and Brooks, 2019[82]). More recently (2022 and 2024) the University of St. Gallen developed the Swiss Nutrition Atlas, a pilot initiative which uses household purchase data to estimate actual dietary intake (Eggenschwiler, Linzmajer and Bally, 2025[83]). A national nutrition survey for children and adolescents (menuCH Kids) was conducted between 2023 and 2024, and constitutes a unique and comprehensive dataset on the nutrition and lifestyle of children in Switzerland (Vincentini J., 2025[84]).
The 2014-2015 national nutrition survey (menuCH) provided representative data on the consumption and dietary behaviour of the Swiss adult population. It was a nationwide cross-sectional survey covering a stratified random sample of 2 057 adults aged 18 to 75 years. Trained dietitians assessed food consumption via two non-consecutive 24-hour dietary recalls. Recorded foods and beverages were classified into six groups and 31 subgroups relevant for assessing compliance with the Swiss food-based dietary guidelines (FBDG). Usual daily intake distributions were modelled and weighted for sampling design, non-response, weekdays and season.
Anonymised individual data from menuCH is available upon request to external researchers for non-commercial purposes. As of September 2024, around 50 academic papers have used this data.
1.2.2. Household food expenditures
Swiss consumers devote over 40% of their food budget to animal-based products
In 2022, Swiss households dedicated 13% (CHF 629) of their monthly consumption expenditure to food and non-alcoholic beverages (Federal Statistical Office, 2024[35]). Using the Harmonised Index of Consumer Prices (HICP), the share is 10%, which is similar to Austria (10%) but lower than Germany (11%) and France (12%) (Eurostat, 2025[87]). The relative weight of food and beverages expenditure in total consumption has changed little in the past decade, with only slight increases in 2020 and 2021 as the out-of-home consumption decreased during the COVID-19 pandemic. Over one-fifth of households’ food expenditures was spent on meat, followed by dairy products and bread and cereals (16% each) (Figure 1.27).

Source: FSO (2025), Household Budget Survey.
1.2.3. Trends in food consumption and dietary preferences
Food availability has remained stable, but its composition has shifted
Per capita food availability in Switzerland is stable, but the distribution between and within categories has shifted in recent years. Food supply in Switzerland has been around 3 400 kcal per person per day during the last decade (FAOSTAT, 2024[88]) (Agristat, 2025[48]). According to Switzerland’s official food balance, apparent consumption (in kg per head) was the highest for dairy products (37%) followed by fruits and vegetables. Milk consumption has decreased in favour of cheese (see Section 1.1.4 above). Meat consumption has decreased, with pork still dominant but losing share to poultry, which has risen by 20% in the past decade (Figure 1.28).
Indexed meat consumption per capita, by meat type

Note: Based on yearly apparent meat consumption.
Source: Agristat (2025[48]), Swiss agriculture graphics - 7. Food balance, https://www.sbv-usp.ch/en/services/agristat-swiss-agriculture-in-figures/swiss-agriculture-graphics.
Switzerland’s main linguistic regions have distinct dietary habits
The 2014 national nutrition survey (menuCH) found that Swiss adult diets were too high in salt, sugar and saturated fats, and too low on fruits, vegetables and nuts (FDHA, 2025[89]). This is in line with thee 2024 Swiss Nutrition Atlas, which, based on household purchase data, reported that fats accounted for 46% of daily energy intake (above the recommended 35-40%), followed by carbohydrates (39%), and sugars (17%) (Eggenschwiler, Linzmajer and Bally, 2025[83]). Adherence to national Swiss food-based dietary guidelines (FBDG) is low across the country (Chatelan et al., 2017[85]). Significant differences in food consumption in the three main linguistic regions were observed in 18 of the 31 food sub-groups. Differences were most notable for beverages, protein-based products and added fats (Figure 1.29). Irrespective of regional dietary patterns, consumers across the country show a clear and widespread preference for Swiss‑produced foods (Box 1.4).
Weighted mean daily intake of selected food sub-groups, by linguistic region

Source: Chatelan et al. (2017[85]), Major Differences in Diet across Three Linguistic Regions of Switzerland: Results from the First National Nutrition Survey menuCH, https://doi.org/10.3390/nu9111163.
Swiss products and services enjoy a strong international reputation, often associated with exclusivity, tradition and high quality. The Swiss brand thus generates a competitive advantage that allows products linked with Switzerland to be positioned in a higher price segment, but at the same time can attract “free riders” who misuse the brand (Swiss Federal Institute of Intellectual Property, n.d.[90]). Research suggests that the value added by “Swissness” can account for up to 20% of a product’s sales price (and up to 50% for certain luxury goods), generating an estimated CHF 5.8 billion in additional annual revenue (Swiss Federal Institute of Intellectual Property, 2017[91]).
Domestically, consumers manifest a strong preference for Swiss-produced foods. A 2023 FOAG survey of 1 061 respondents from the German- and French-speaking regions found that 90% prefer to buy Swiss agro-food products whenever possible. Domestic preference is strongest for eggs, milk and dairy, meat, and potatoes. Consumers cited short transport distances, support for Swiss farmers, and high quality as key motives. However, price is becoming an increasingly influential decision criterion against domestic origin or organic production (Federal Office for Agriculture, 2023[92]).
The “Swissness” legislation, in force since January 2017, strengthens the protection of the “Made in Switzerland” designation and the Swiss cross domestically and with a view to law enforcement abroad, to safeguard their value and combat wrongful use. The specific regulation for foodstuffs (HasLV) states that at least 80% of raw materials must originate in Switzerland, and essential processing must occur domestically (FOAG, 2025[93]). Milk and dairy products must be fully sourced and processed in Switzerland. Exceptions apply for raw materials not produced or not sufficiently available domestically. Misuse of the Swiss cross or the federal coat of arms may trigger a warning from the Swiss Federal Institute of Intellectual Property (IPI) and, if uncorrected, legal measures (Swiss Federal Institute of Intellectual Property, 2017[91]).
In addition to the Swiss geographical indication, products may obtain region-linked protection under the Appellation d’Origine Protégée (AOP) or Indication Géographique Protégée (IGP) schemes. However, these designations are not always recognised across borders: for instance, while “Emmental” is AOP-protected in Switzerland, the European Union treats it as a generic term (Official Journal of the European Union, n.d.[94]).
As of early 2026, the FOAG register listed 42 AOP and IGP products, including cheeses, meat products, baked goods, spirits, and other specialities. These designations intend to protect traditional know-how, discourage production outsourcing, and preserve cultural heritage. One study focusing on Gruyère AOP and Emmentaler AOP found that product and quality differentiation had a stabilising effect on milk producer prices, suggesting potential as a risk management tool (Wang et al., 2024[95]).
In practice, the largest retailers (Coop and Migros) show limited interest in promoting AOP/IGP labels (FOAG; AGRIDEA; Swiss PDO-PGI Association, 2017[96]). Instead, they prioritise their own labels such as Aus der Region. Für die Region. or Miini Region, which use broad definitions of “region” not always tied to local boundaries (Diener, 2024[97]).
Note: In Switzerland, AOP and IGP designations apply to agricultural products other than wine. AOP guarantees that all production stages and raw materials come from a specific region, while the IGP designation requires that at least one stage of production take place in a defined geographical area.
Swiss consumers tend to take environmental considerations into account when purchasing food
Awareness about the links between food and the environment appear to be growing among Swiss households. Switzerland offers high living standards, and its population is well-educated, active and healthier than in most OECD countries (OECD, 2023[98]). Results from the 2022 round of the OECD Survey on Environmental Policies and Individual Behaviour Change (EPIC) placed most Swiss households in the Environmentally minded category (Figure 1.30). These households are concerned relatively more about the environment and tend to purchase products perceived as environmentally responsible. Over one-fourth of Swiss households followed a flexitarian diet (reduced meat and fish consumption) in 2024, up from 18% in 2022 (Figure 1.31) (Eggenschwiler et al., 2025[99]). The share of vegetarian households slightly increased, while the vegan and pesco-vegetarian both decreased. Demand for organic products among Swiss consumers is high and increasing (Box 1.5).
Share of each household group across the nine countries covered by the 2022 round of the EPIC survey

Note: Using latent class analysis to analyse reported purchasing habits, households were categorised into three main profiles: (i) Price sensitive: Food purchasing decisions among this group are primarily driven by affordability, followed by taste and freshness;(ii) Frequent meat purchasers: this group reports consuming meat most frequently and are less likely to purchase products perceived as environmentally responsible; (iii) Environmentally minded: These households are concerned relatively more about the environment and tend to purchase products perceived as environmentally responsible.
Source: Hassett et al. (2025[100]), based on 2022 OECD Survey on Environmental Policies and Individual Behaviour Change (EPIC).
Dietary habits in Swiss households

Source: Eggenschwiler et al. (2025[99]), Report on Planetary Health Diet in Switzerland (automatic translation).
Organic agriculture in Switzerland dates back to the early 20th century, rooted in movements reacting to urbanisation and industrialisation, such as Lebensreform, which promoted a return to nature, healthy eating, and raised concerns about the use of synthetic fertilisers and pesticides in food production (Rindlisbacher, 2020[101]), and the Farmers' Homeland Movement (Bauernheimatbewegung), which began promoting organic farming in the 1950s to support farm survival amid advancing industrialisation (Rahmann and March, 2022[102]; Moser, 2004[103]).
These deep roots help explain Switzerland’s strong demand for organic food. In 2023, the country had the highest per capita organic consumption in the world (EUR 468) and the second-highest organic share in retail sales (11.6%) (FiBL and IFOAM, 2025[26]). Per capita consumption rose by over 550% with respect to 2000, driven by a substantial rise in organic retail sales over the same period (724%). In 2023, organic retail sales in the Swiss market surpassed EUR 4 billion for the first time (FiBL, 2025[104]; FiBL and IFOAM, 2025[26]).
Götze et al. (2016[105]) identified three product characteristics influencing organic purchases in Switzerland. First, the “naturalness” dimension: many Swiss consumers strive towards a healthy lifestyle and therefore prioritise unprocessed organic food. The second consideration is financial: even if incomes in Switzerland are high, consumers remain influenced by product prices, with products with a price premium exceeding 30% less likely to be purchased. Third, “Swissness”, or preference for domestically produced over imported food.
According to Bio Suisse − an umbrella organisation of over 7 300 organic producers and processors − the top organic products in 2024 were eggs (with a market share of 29.4%), bread (27.8%), and vegetables (26.2%) (Bio Suisse, 2025[106]). Bio Suisse certifies products in line with its standards, which adhere to stricter requirements than the EU Bio label (Bio Suisse, 2025[107]).
The Biobarometer, a biennial survey conducted by FiBL since 2016, tracks consumer behaviour and factors influencing daily purchasing decisions. In 2024, 55% of respondents consumed organic products frequently (daily or several times per week), up from 47% in 2020. Top motivations for purchasing organic products included personal health and environmental concerns: avoiding pesticide residues, antibiotics, and synthetic fertilisers, and supporting animal welfare and environmentally friendly production were the top reasons, each supported by at least 95% of respondents. Price remains the main barrier to purchasing organic products, with 73% of respondents agreeing with the statement “organic food is too expensive for me” (FOAG/FiBL, 2025[108]).
Women, urban residents, and individuals with higher income or education are more likely to consume organic food. No significant differences were found between German- and French-speaking regions (Stolz, 2025[109]).
Federalism and direct democracy underpin Switzerland’s policy and decision-making
Switzerland is a Confederation of 26 cantons. Cantons have broad autonomy, with their own constitutions, parliaments and laws; they are sovereign except to the extent that this is limited by the Federal Constitution (for example, federal law overrides conflicting cantonal law). The third level of government is made up by over 2 100 communes, which exercise the powers delegated to them by the other two levels.
In general, the allocation and performance of state tasks must follow the principle of subsidiarity: nothing that can be done at a lower political level should be done at a higher level. Only few policy areas (such as foreign policy, monetary policy, national security, and customs) fall exclusively under the competences of the Confederation. All tasks not assigned to the Confederation remain with the cantons, although the Constitution provides for shared competences between both levels, for example in tertiary education (Swiss Confederation, n.d.[110]).
According to the Federal Constitution, cantons determine which responsibilities they perform within the scope of their competences, with the Confederation only assuming responsibilities that exceed the powers of the cantons or that require uniform regulation (federal legislation). The cantons are responsible for implementing federal law. They may collaborate with the Confederation to achieve specific objectives through programs supported by federal funding.
An important reform over 2004-08 resulted in changes to relevant constitutional provisions and laws to re-assign responsibilities between the federal and cantonal levels for numerous tasks, including some related to food systems. The main changes were:
Seven tasks were centralised, including national agricultural advisory services and animal breeding.
Ten tasks were allocated to cantons, including cantonal agricultural advisory services.
Seventeen tasks were reorganised as vertical co-operation (shared between federal and cantonal levels with programme agreements), including nature and wildlife protection, flood and water protection, and hunting oversight.
Nine tasks were assigned as horizontal co-operation (amongst cantons with fiscal burden sharing), including cantonal higher education institutions, waste management and wastewater treatment (Mueller and Vatter, 2017[111]).
After 2008, Switzerland further clarified federal and cantonal roles in specific policy areas and developed a new framework for inter-cantonal collaboration in order to avoid fragmentation and unproductive competition (OECD, 2019[112]). In this context, co-operation among the cantons and between the cantons and the Confederation is indispensable for overcoming problems of fragmentation and providing public services effectively (Kim and Blöchliger, 2015[113]). Co-ordination also becomes essential for effectively addressing policies for the Swiss food system in a comprehensive manner.
There is a high level of fiscal decentralisation. In 2023, subnational tax revenue (including cantonal and local) made up 41% of total tax revenue, the second highest in the OECD after Canada; and subnational spending accounted for 58% of total government expenditure, third in the OECD after Canada and Denmark (OECD, 2025[114]). All three levels may levy taxes, with federal taxes including the direct tax on income or profits, the withholding tax on capital revenue, as well as the value-added tax (VAT) and special taxes on tobacco and beer. Cantons enjoy significant tax autonomy and may levy any kind of tax, except in areas where this right is reserved for the Confederation. Communes may only levy taxes to the extent authorised by the canton.
Direct democracy is a unique feature of the Swiss political system. The electorate decides on political issues approximately four times a year, through popular initiatives to amend the Constitution (which can be presented if they have the signature of 100 000 voters), and optional referendums to demand that new legislation passed by Parliament is submitted to a national vote (which require 50 000 signatures within 100 days of the publication of the new law). All constitutional amendments approved by Parliament must also be subject to popular vote (mandatory referendum). Mandatory and optional referendums are also held at the cantonal and communal levels. The Swiss legislative process is thus geared towards achieving a broad consensus among the key stakeholders (OECD, 2025[115]).
The Federal Council, a seven-member body, collectively acts as the head of state and government. Each member heads a federal department. The legislative power lies with the Federal Assembly, which elects the Federal Council. The Federal Assembly consists of two chambers: the National Council (with 200 members, representing the people) and the Council of States (with 46 members, representing the cantons). The judiciary is independent and includes the Federal Supreme Court, which ensures the uniform application of federal law and protects constitutional rights.
The Federal Administration is organised into seven departments, each headed by one of the federal councillors: the Federal Department of Foreign Affairs (FDFA); the Federal Department of Home Affairs (FDHA); the Federal Department of Justice and Police (FDJP); the Federal Department of Defence, Civil Protection and Sport (DDPS); the Federal Department of Finance (FDF); the Federal Department of Economic Affairs, Education and Research (EAER); the Federal Department of the Environment, Transport, Energy and Communications (DETEC). Each federal department oversees several administrative units (e.g. federal offices, state secretariats, commissions or agencies).
Swiss citizens have a high level of trust in their government. In 2023, the percentage of Swiss people that reported high or moderately high trust in the federal, regional (canton) and local governments were respectively 62%, 60% and 63%, the highest in the OECD at all three levels (OECD, 2024[116]).
Primary agriculture plays a limited role in Switzerland’s service‑based economy, but it is regarded as essential for ensuring food security and providing public goods valued by society, including landscape management and cultural heritage. Agriculture remains the largest land‑use category, even though farmland has contracted under pressure from growing settlement areas in this highly urbanised country.
Despite a trend of long‑term structural change ‒ with fewer but larger farms and greater reliance on hired labour ‒ Swiss farms remain predominantly family-run and clustered around the middle of the size distribution. This family farming model does not mean that Swiss farms are small: their average size slightly exceeds the EU average. Livestock, particularly dairy and cattle, is the most important agricultural activity. Contrary to broader trends, organic farming expanded over the past two decades, driven by supportive policies and the world’s highest per capita consumer demand, although recent data point to a slowdown. Farm household incomes rely heavily on government support and off‑farm employment, even if there are regional and sectoral differences: crop farms and farms in valley zones generally achieve higher incomes and depend less on direct payments than cattle farms in hill and mountain areas.
Women represent a significant share of agricultural workers, trainees, and researchers. Yet, they remain underrepresented among farm managers, which reflects the persistence of structural and cultural barriers. An ageing farm manager population, with a large cohort approaching statutory retirement age, points to a high volume of forthcoming farm transfers. In light of declining numbers of young farmers and new entrants, this indicates growing challenges for farm succession and generational renewal.
Downstream activities – such as processing and food services – have more weight in the Swiss economy than primary agriculture. The agro-food value chain is characterised by a dual structure: a highly competitive, export-oriented food processing industry stands alongside more domestically focused segments that rely on domestic inputs and are less competitive. Trade patterns reflect increasing specialisation in high value-added processed products, which benefit from the international recognition of the Swiss brand. Consistent with this, participation in global value chains has deepened over the past two decades. The domestic agro-food market is highly concentrated, with a small number of large, often vertically integrated players. Despite this, direct marketing by farmers has expanded, although it still represents a small share of farm income.
Swiss consumers are generally well educated and enjoy high purchasing power. They tend to purchase products perceived as environmentally responsible and show a strong preference for domestically produced foods. While most agree about the importance of environmental protection and animal welfare, consumption patterns differ across linguistic regions. Despite good performance on many health indicators, concerns about unhealthy diets in Switzerland are increasing, as rates of overweight and obesity have risen over the past two decades.
Switzerland’s policy framework and decision-making processes are shaped by federalism and direct democracy. The allocation of public tasks follows the principle of subsidiarity, whereby tasks are assigned to the lowest effective level of government. In the agro-food sector, while the design of agricultural policy is relatively centralised, other areas such as farm advisory services, environmental protection, nutrition, education, and waste management are decentralised or governed through shared competences. Direct democracy, with frequent popular votes including on constitutional matters, makes co‑ordination and consensus‑building central to policymaking.
References
[32] Agrarinfo (2024), Fenaco-LANDI, le pouvoir «de la terre à la table», https://www.agrarinfo.ch/societe/economie/pouvoir/fenaco-landi-le-pouvoir-de-la-terre-a-la-table/ (accessed on 22 August 2025).
[39] Agristat (2025), “Swiss agriculture graphics - 1. Structures - Direct marketing”, https://www.sbv-usp.ch/en/services/agristat-swiss-agriculture-in-figures/swiss-agriculture-graphics (accessed on 24 August 2025).
[48] Agristat (2025), “Swiss agriculture graphics - 7. Food balance”, https://www.sbv-usp.ch/en/services/agristat-swiss-agriculture-in-figures/swiss-agriculture-graphics (accessed on 1 September 2025).
[25] Alföldi, T. et al. (2006), Country Report on Organic Farming Research in Switzerland, https://www.researchgate.net/publication/28682618_Country_Report_on_Organic_Farming_Research_in_Switzerland (accessed on 2 July 2025).
[61] Binder, S. (2023), Der Schweizer Bauer: Andere Regeln für Familienmitglieder, https://www.schweizerbauer.ch/politik-wirtschaft/betriebsfuehrung/andere-regeln-fuer-familienmitglieder/ (accessed on 17 October 2025).
[106] Bio Suisse (2025), Bio-Landwirtschaft und Bio-Markt, https://org.biosuisse.ch/konsumenten/de/unser-verband/bio-suisse-portraet/bio-in-zahlen.html.
[107] Bio Suisse (2025), Fragen zu Label und Kontrolle, https://www.bio-suisse.ch/de/unsere-haltung/haeufige-fragen/labels-und-kontrolle.html?to=bio-suisse-und-eu-bio%253A-was-sind-die-unterschiede%253F.
[67] Bruttin, L. (2026), Retraite agricole: entre transmission et invisibilité, https://www.reiso.org/articles/themes/genre/15133-retraite-agricole-entre-transmission-et-invisibilite#_ftn3.
[70] Campi, M. et al. (2024), “The evolving profile of new entrants in agriculture and the role of digital technologies”, OECD Food, Agriculture and Fisheries Papers, No. 209, OECD Publishing, Paris, https://doi.org/10.1787/d15ea067-en.
[79] CBI (2022), The Swiss market potential for coffee, https://www.cbi.eu/market-information/coffee/switzerland/market-potential (accessed on 23 July 2025).
[85] Chatelan, A. et al. (2017), “Major Differences in Diet across Three Linguistic Regions of Switzerland: Results from the First National Nutrition Survey menuCH”, Nutrients, Vol. 9/11, p. 1163, https://doi.org/10.3390/nu9111163.
[57] Contzen, S. (2022), Die Rolle der Frauen in der Landwirtschaft, Berner Fachhochschule Monatsthema, https://www.bfh.ch/dam/jcr:6d12dabf-d4cd-4881-8b8e-793929ac250b/sandra-contzen-montagna-5-2022.pdf.
[60] Contzen, S. and C. Burren (2020), Ehescheidung in der Landwirtschaft, https://www.bfh.ch/dam/jcr:2d7d7ec8-a280-45ab-b88e-7ad482037c21/D_SH0220_Scheidung_200.pdf.
[58] Contzen, S. and J. Forney (2016), “Family farming and gendered division of labour on the move: a typology of farming-family configurations”, Agriculture and Human Values, Vol. 34/1, pp. 27-40, https://doi.org/10.1007/s10460-016-9687-2.
[66] Contzen, S. et al. (2016), “Retirement as a Discrete Life‐Stage of Farming Men and Women’s Biography?”, Sociologia Ruralis, Vol. 57/S1, pp. 730-751, https://doi.org/10.1111/soru.12154.
[97] Diener, M. (2024), Coop und Migros: Das dicke Geschäft mit regionalen Produkten – infosperber, https://www.infosperber.ch/wirtschaft/coop-und-migros-das-dicke-geschaeft-mit-regionalen-produkten/ (accessed on 2 February 2026).
[83] Eggenschwiler, M., M. Linzmajer and L. Bally (2025), “Der Schweizer Ernährungsatlas 2024(automatic translation)”, https://www.ernaehrungsatlas.ch/en/downloads (accessed on 1 September 2025).
[99] Eggenschwiler, M. et al. (2025), Report on Planetary Health Diet in Switzerland (automatic translation), Institut für Handelsmanagement, Universität St.Gallen.
[22] Eurostat (2025), Economic accounts for agriculture - values at current prices [AACT_EAA01], https://ec.europa.eu/eurostat/databrowser/product/view/aact_eaa01?lang=en (accessed on June 2025).
[87] Eurostat (2025), Household final consumption expenditure by purpose (COICOP 2018) - Data for 2022, https://ec.europa.eu/eurostat/databrowser/view/nama_10_cp18/default/table?lang=en (accessed on 2 September 2025).
[52] Eurostat (2024), Farm indicators by age and sex of the manager, economic size of the farm, utilised agricultural area and NUTS 2 region [ef_m_farmang], https://doi.org/10.2908/EF_M_FARMANG.
[21] Eurostat (2024), Farm indicators by legal status of the holding, utilised agricultural area, type and economic size of the farm and NUTS 2 region, https://doi.org/10.2908/EF_M_FARMLEG (accessed on 24 June 2025).
[62] FAOSTAT (2025), Employment Indicators: Agriculture and agrifood systems [database], https://www.fao.org/faostat/en/#data/OEA (accessed on October 2025).
[88] FAOSTAT (2024), Food Balances (2010-), https://www.fao.org/faostat/en/#data/FBS/metadata (accessed on 2 September 2025).
[89] FDHA (2025), Swiss Nutrition Strategy 2025-2032, https://www.blv.admin.ch/blv/en/home/das-blv/strategien/schweizer-ernaehrungsstrategie.html (accessed on 1 September 2025).
[31] Federal Council (2022), Orientation future de la politique agricole: Rapport du Conseil fédéral en réponse aux postulats 0.3931 de la CER-E et 21.3015 de la CER-N, https://www.newsd.admin.ch/newsd/message/attachments/72188.pdf (accessed on 6 March 2025).
[80] Federal Department of Foreign Affairs (2025), Swiss Sustainable Coffee Platform, https://www.eda.admin.ch/deza/en/home/projekte/projekte.html/content/dezaprojects/SECO/en/2024/UR01315/phase1.
[12] Federal Office for Agriculture (2025), Rapport Agricole 2024, http://2024.agrarbericht.ch.
[23] Federal Office for Agriculture (2025), Rapport Agricole 2025, https://www.agrarbericht.ch/fr.
[74] Federal Office for Agriculture (2025), Statistics and analyses, https://www.blw.admin.ch/en/statistics-and-analyses (accessed on 2 September 2025).
[92] Federal Office for Agriculture (2023), Bedeutung der Herkunft von Landwirtschaftsprodukten 2023 - Eine Befragung im Auftrag des Bundesamtes für Landwirtschaft, https://www.newsd.admin.ch/newsd/message/attachments/78794.pdf (accessed on 2 February 2026).
[18] Federal Office for Agriculture (2022), Rapport Agricole 2022 - Exploitation, https://2022.agrarbericht.ch/fr/exploitation/structures/exploitation (accessed on 15 May 2025).
[54] Federal Office for Agriculture (2018), Rapport Agricole 2018 - Exploitations, https://2018.agrarbericht.ch/fr.
[86] Federal Office for Food Safety and Veterinary Affairs (2024), menuCH – the first national food survey, https://www.blv.admin.ch/blv/fr/home/lebensmittel-und-ernaehrung/ernaehrung/menuCH.html (accessed on 1 September 2025).
[69] Federal Statistical Office (2025), Anteil der Bewirtschafter/innen nach Altersklassen - In %, https://www.bfs.admin.ch/bfs/en/home/statistics/catalogues-databases.assetdetail.34788399.html (accessed on 7 July 2025).
[27] Federal Statistical Office (2025), Bio verliert 2024 an Schwung - Landwirtschaftliche Strukturerhebung 2024 | Press release, https://www.bfs.admin.ch/asset/en/34788423 (accessed on 18 September 2025).
[64] Federal Statistical Office (2025), Durchschnittsalter der Erwerbsbevölkerung nach verschiedenen Kriterien, https://www.bfs.admin.ch/bfs/de/home/statistiken/arbeit-erwerb/erwerbstaetigkeit-arbeitszeit/alter-generationen-pensionierung-gesundheit/durchschnittsalter-erwerbsbevoelkerung.html.
[10] Federal Statistical Office (2025), Farm Structure Survey 2024, https://www.bfs.admin.ch/bfs/de/home/statistiken/land-forstwirtschaft.gnpdetail.2025-0411.html.
[51] Federal Statistical Office (2025), Frauen und Wissenschaft, https://www.bfs.admin.ch/bfs/de/home/statistiken/bildung-wissenschaft/technologie/indikatorsystem/w-t-input/spez-f-e-analysen/frauen-wissenschaft.html (accessed on 3 September 2025).
[7] Federal Statistical Office (2025), Share of employed persons by economic sector, https://www.bfs.admin.ch/bfs/en/home/statistics/work-income/employment-working-hours/labour-force-characteristics/economic-sector.html.
[5] Federal Statistical Office (2024), Definition of agglomerations and typology of municipalities 2020 - GNP Diffusion, https://www.bfs.admin.ch/bfs/en/home/news/whats-new.gnpdetail.2024-0523.html (accessed on 14 May 2025).
[35] Federal Statistical Office (2024), Dépenses détaillées de l’ensemble des ménages selon l’année, https://www.bfs.admin.ch/bfs/en/home/statistics/economic-social-situation-population/income-consumption-wealth/household-budget/household-expenditure.assetdetail.32667039.html (accessed on 22 August 2025).
[6] Federal Statistical Office (2024), La Suisse devient plus urbaine: l’évolution de la population au fil du temps (press release), https://www.bfs.admin.ch/bfs/de/home/statistiken/kataloge-datenbanken.assetdetail.31005129.html (accessed on 14 May 2025).
[30] Federal Statistical Office (2024), Pocket Statistics 2024 - The food supply chain, https://www.swissstats.bfs.admin.ch/collection/ch.admin.bfs.swissstat.en.issue240723402400/article/issue240723402400-02 (accessed on 22 August 2025).
[9] Federal Statistical Office (2021), Die Bodennutzung in der Schweiz – 3 Landwirtschaftsflächen, https://www.swissstats.bfs.admin.ch/collection/ch.admin.bfs.swissstat.de.issue21020021801/article/issue21020021801-05 (accessed on 15 May 2025).
[49] Federal Statistical Office (2013), “From grass to milk - Milk production in Switzerland”, https://www.bfs.admin.ch/asset/en/348974 (accessed on 24 August 2025).
[117] Fenaco (2025), About us, https://www.fenaco.com/en/about-us (accessed on 30 July 25).
[75] Fiankor, D. et al. (2025), “The Effect of Swiss Free Trade Agreements on Agricultural Trade”, Kyklos, https://doi.org/10.1111/kykl.12472.
[104] FiBL (2025), FiBL survey based on national data sources, data from certifiers, Eurostat, http://statistics.fibl.org.
[26] FiBL and IFOAM (2025), “The World of Organic Agriculture, statistics and emerging trends”, https://orgprints.org/id/eprint/54617/1/1797-organic-world-2025.pdf.
[93] FOAG (2025), Swissness bei Lebensmitteln, https://www.blw.admin.ch/de/swissness-bei-lebensmitteln (accessed on 27 March 2026).
[59] FOAG (2022), Agrarbericht 2022: Frauen in der Landwirtschaft 2022, https://2022.agrarbericht.ch/de/mensch/bauernfamilie/frauen-in-der-landwirtschaft.
[108] FOAG/FiBL (2025), Bio-Konsum 2024: Stabilisierung auf hohem Niveau, https://www.agrarmarktdaten.ch/blog/bio-konsum-2024-stabilisierung.
[96] FOAG; AGRIDEA; Swiss PDO-PGI Association (2017), Die Schweizer AOP-IGP-Rückblick auf 20 Jahre Erfahrungen, https://www.aop-igp.ch/fileadmin/Dokumente/Wirkungsstudie/Wirksamkeitsstudie_D.pdf.
[13] FOAG, F. (2025), Direktzahlungen für Sömmerungsbetriebe, https://www.blw.admin.ch/de/direktzahlungen-soemmerung.
[40] FRC (2024), Les circuits courts, vraiment intéressants ?, Fédération romande des consommateurs (FRC), https://www.frc.ch/les-circuits-courts-vraiment-interessants%E2%80%8A (accessed on 29 September 2025).
[81] FSVO (2025), The Swiss Food Composition Database, https://naehrwertdaten.ch/en/ (accessed on 2 September 2025).
[37] GastroSuisse (2025), Statistiques tirées du Reflet économique de la branche, https://gastrosuisse.ch/fr/branche/chiffres-et-tendances/reflet-economique-de-la-branche-hotellerie-restauration/statistiques?_gl=1*145x2ew*_up*MQ..*_ga*MTM5MjIwNTg0Mi4xNzU1ODU3MDc5*_ga_9PRSL5CETC*czE3NTU4NTcwNzckbzEkZzAkdDE3NTU4NTcwNzckajYwJGwwJGgw (accessed on 22 August 2025).
[34] Gentile, E. et al. (2019), Fertilizers and pesticides: Price differences between Switzerland and neighbouring countries, Report mandated by the Swiss State Secretariat of Economic Affairs, https://www.seco.admin.ch/seco/en/home/Publikationen_Dienstleistungen/Publikationen_und_Formulare/Strukturwandel_Wachstum/Branchenanalysen/fertilizers-and-pesticides-price-differences-between-switzerland.html (accessed on 14 September 2025).
[82] Giner, C. and J. Brooks (2019), “Policies for encouraging healthier food choices”, OECD Food, Agriculture and Fisheries Papers, No. 137, OECD Publishing, Paris, https://doi.org/10.1787/11a42b51-en.
[56] Giner, C., M. Hobeika and C. Fischetti (2022), “Gender and food systems: Overcoming evidence gaps”, OECD Food, Agriculture and Fisheries Papers, No. 184, OECD Publishing, Paris, https://doi.org/10.1787/355ba4ee-en.
[105] Götze, F. et al. (2016), “Explaining market shares of organic food: evidence from Swiss household data”, British Food Journal, Vol. 118/4, pp. 931-945, https://doi.org/10.1108/bfj-09-2015-0318.
[68] Häberli, I. and S. Contzen (2021), Die Hofnachfolge ganzheitlich und frühzeitig angehen, Bern Universty of Applied Sciences, https://doi.org/10.34776/afs12-57.
[100] Hassett, K. et al. (2025), “Household food choices: New empirical evidence and policy implications for sustainable behaviour”, OECD Environment Working Papers, Vol. 255, https://www.oecd.org/content/dam/oecd/en/publications/reports/2025/01/household-food-choices_25171ee8/97c4041a-en.pdf (accessed on 4 June 2025).
[24] Identitas AG (2026), Plattform Tierstatistik - Entwicklung nach Nutzungsarten, https://tierstatistik.identitas.ch/de/cattle-usage.html (accessed on 27 March 2026).
[78] International Coffee Organization (2020), The Value of Coffee: Sustainability, Inclusiveness, and Resilience of the Coffee Global Value Chain, https://www.icocoffee.org/wp-content/uploads/2022/11/CDR2020.pdf.
[47] IP Lait (2017), “Statuts”, https://www.ip-lait.ch/fr/portrait/statuts-reglements/organisation-ip-lait/ (accessed on 25 August 2025).
[113] Kim, J. and H. Blöchliger (eds.) (2015), Institutions of Intergovernmental Fiscal Relations: Challenges Ahead, OECD Fiscal Federalism Studies, OECD Publishing, Paris, https://doi.org/10.1787/9789264246966-en.
[77] Kohler, A. and A. Ferjani (2018), “Exchange rate effects: A case study of the export performance of the Swiss agriculture and food sector”, The World Economy, Vol. 41/2, pp. 494-518, https://doi.org/10.1111/twec.12611.
[44] Leinert, L., F. Brand and F. Duma (2016), “Food Sector Study : Figures, Structure, Forces of Change, and Development Potential of the Swiss Food Industry”, https://doi.org/10.21256/zhaw-1188.
[63] Lewis, C. and P. Ollivaud (2020), “Policies for Switzerland’s ageing society”, OECD Economics Department Working Papers, No. 1600, OECD Publishing, Paris, https://doi.org/10.1787/3f8a12c6-en.
[72] Mack, G., C. Ritzel and P. Jan (2020), “Determinants for the Implementation of Action-, Result- and Multi-Actor-Oriented Agri-Environment Schemes in Switzerland”, Ecological Economics, Vol. 176, p. 106715, https://doi.org/10.1016/j.ecolecon.2020.106715.
[15] Mack, G., T. Walter and C. Flury (2013), “Seasonal alpine grazing trends in Switzerland: Economic importance and impact on biotic communities”, Environmental Science & Policy, Vol. 32, pp. 48-57, https://doi.org/10.1016/j.envsci.2013.01.019.
[16] Meyer, M. et al. (2025), “Resilience of Swiss summer farms: An interdisciplinary analysis of key challenges and adaptations”, Agricultural Systems, Vol. 227, p. 104365, https://doi.org/10.1016/j.agsy.2025.104365.
[17] Meyer, M. et al. (2024), “Understanding the Heterogeneity of Swiss Alpine Summer Farms for Tailored Agricultural Policies: A Typology”, Mountain Research and Development, Vol. 44/1, https://doi.org/10.1659/mrd.2023.00041.
[119] Miroudot, S. and C. Cadestin (2017), “Services In Global Value Chains: From Inputs to Value-Creating Activities”, OECD Trade Policy Papers, No. 197, OECD Publishing, Paris, https://doi.org/10.1787/465f0d8b-en.
[103] Moser, P. (2004), Bauernheimatbewegung, https://hls-dhs-dss.ch/de/articles/017390/2004-04-27/ (accessed on 18 September 2025).
[55] Moser, R. and K. Saner (2022), Frauen in der Landwirtschaft: Bericht zur Studie 2022, AGRIDEA, https://2022.agrarbericht.ch/download/pictures/2e/6u4ub1kbfr5796vn5xg3wup3s9w32a/agridea_schlussbericht_frauenstudie_22_def_d.pdf.
[111] Mueller, S. and A. Vatter (2017), “Federalism and Decentralisation in Switzerland”, in Federal Power-Sharing in Europe, Nomos Verlagsgesellschaft mbH & Co. KG, https://doi.org/10.5771/9783845283425-39.
[33] NielsenIQ and PLMA (2025), PLMA’s International Private Label Yearbook, https://yearbook.plmainternational.com/countries/switzerland (accessed on 22 August 2025).
[114] OECD (2025), OECD Fiscal Decentralisation Database, https://www.oecd.org/en/data/datasets/oecd-fiscal-decentralisation-database.html.
[115] OECD (2025), OECD Regulatory Policy Outlook 2025, OECD Publishing, Paris, https://doi.org/10.1787/56b60e39-en.
[2] OECD (2024), OECD Economic Surveys: Switzerland 2024, OECD Publishing, Paris, https://doi.org/10.1787/070d119b-en.
[116] OECD (2024), OECD Survey on Drivers of Trust in Public Institutions – 2024 Results: Building Trust in a Complex Policy Environment, OECD Publishing, Paris, https://doi.org/10.1787/9a20554b-en.
[8] OECD (2024), Value added by activity (indicator), http://data-explorer.oecd.org/s/1sr (accessed on 13 May 2025).
[98] OECD (2023), OECD Health at a Glance 2023 Country Note - Switzerland, https://www.oecd.org/en/publications/health-at-a-glance-2023_4b49102f-en/switzerland_858c8be8-en.html (accessed on 3 September 2025).
[3] OECD (2022), Enhancing Innovation in Rural Regions of Switzerland, OECD Rural Studies, OECD Publishing, Paris, https://doi.org/10.1787/307886ff-en.
[1] OECD (2020), How’s Life? 2020: Measuring Well-being, OECD Publishing, Paris, https://doi.org/10.1787/9870c393-en.
[4] OECD (2020), Rural Well-being: Geography of Opportunities - Switzerland Country Note, OECD Rural Studies, OECD Publishing, Paris, https://doi.org/10.1787/d25cef80-en.
[112] OECD (2019), Making Decentralisation Work: A Handbook for Policy-Makers, OECD Multi-level Governance Studies, OECD Publishing, Paris, https://doi.org/10.1787/g2g9faa7-en.
[36] OECD (2015), OECD Review of Agricultural Policies: Switzerland 2015, OECD Review of Agricultural Policies, OECD Publishing, Paris, https://doi.org/10.1787/9789264168039-en.
[118] OECD (n.d.), PPP detailed results, 2020, https://data-explorer.oecd.org/s/32b (accessed on 17 October 2025).
[50] OECD/FAO (2025), OECD-FAO Agricultural Outlook 2025-2034, OECD Publishing, Paris/FAO, Rome, https://doi.org/10.1787/601276cd-en.
[94] Official Journal of the European Union (n.d.), Commission Implementing Decision (EU) 2025/107 of 23 January 2025 refusing protection in the Union of the Appellation of Origin ‘Emmentaler’ registered in the International Register of Appellations of Origin and Geographical Indications of the Geneva Act, https://eur-lex.europa.eu/legal-content/EN/TXT/HTML/?uri=OJ:L_202500107 (accessed on 2 February 2026).
[45] PSL (2025), Rapport annuel 2024, Fédération des Producteurs Suisses de Lait (PSL), https://www.swissmilk.ch/fr/producteurs-de-lait/portrait/le-lait-est-notre-force/rapport-annuel/ (accessed on 24 August 2025).
[46] PSL (2024), “Swiss Dairy Economy in figures 2022/23”, https://api.swissmilk.ch/wp-content/uploads/2019/06/Milchwirtschaft2023_En.pdf (accessed on 24 August 2025).
[102] Rahmann, G. and S. March (2022), Grundlagen der ökologischen Landwirtschaft, https://www.thuenen.de/de/themenfelder/oekologischer-landbau/grundlagen-der-oekologischen-landwirtschaft (accessed on 18 September 2025).
[29] Renner, S. et al. (2019), Survey system of the Swiss Farm Accountancy Data Network with two samples: Income Situation sample and Farm Management Sample. Agroscope Science, 68, 2019, https://www.agroscope.admin.ch/agroscope/de/home/publikationen/suchen/_jcr_content/par/externalcontent.external.exturl.html/aHR0cHM6Ly9pcmEuYWdyb3Njb3BlLmNoL2VuLVVTL0FqYXgvUH/VibGlrYXRpb24_ZWluemVscHVibGlrYXRpb25JZD00MzM4MiZw/YXJlbnRVcmw9JTJGZGUtQ0glMkZQd.
[28] Renner, S. and D. Schmid (2024), Einkommensentwicklung in der Landwirtschaft 2015−2023., https://ira.agroscope.ch/de-CH/publication/58130 (accessed on 17 October 2025).
[101] Rindlisbacher, S. (2020), The Swiss Lebensreform Movement: Instructions for a “better life”, Bernisches Historisches Museum.
[71] Rossier, R. and B. Wyss (2006), “Determinanten der Hofnachfolge”, Agrarforschung, Vol. 14/4, pp. 144-149, https://www.agrarforschungschweiz.ch/2006/04/determinanten-der-hofnachfolge/.
[76] State Secretariat for Economic Affairs (2025), Economic forecast: US tariffs weigh on Swiss industry, uncertainty remains elevated (press release), https://www.seco.admin.ch/dam/seco/en/dokumente/Wirtschaft/Wirtschaftslage/Konjunkturprognosen/2025_3_prognose_konjunktur_schweiz.pdf.download.pdf/2025_3_economic_forecast_switzerland.pdf (accessed on 19 October 2025).
[109] Stolz, H. (2025), Biobarometer 2024 – Repräsentativbefragung zum Thema Biokonsum und Nachhaltigkeit in der Schweiz, https://orgprints.org/id/eprint/55989/1/Biobarometer_2024_Foliensammlung_Repraesentativbefragung.pdf.
[110] Swiss Confederation (n.d.), Swiss Federalism, https://www.ch.ch/en/political-system/operation-and-organisation-of-switzerland/federalism/#cantonal-activities (accessed on 24 October 2025).
[53] Swiss Farmers’ Union (2025), Agristat - Betriebsleiterinnen, https://www.sbv-usp.ch/de/services/agristat-statistik-der-schweizer-landwirtschaft/grafiken#prettyPhoto[gal18169]-16 (accessed on 3 July 2025).
[11] Swiss Farmers’ Union (2024), Statistische Erhebungen und Schätzungen über Landwirtschaft und Ernährung (SES) - Pflanzenbau (Statistical surveys and estimates on agriculture and nutrition - Crop production), https://www.sbv-usp.ch/de/services/agristat-statistik-der-schweizer-landwirtschaft/statistische-erhebungen-und-schaetzungen-ses (accessed on 25 June 2025).
[19] Swiss Farmers’ Union (2013), “Situationsbericht 2013 « Erfolgsmodell: der bäuerliche Familienbetrieb »”, https://www.sbv-usp.ch/fileadmin/sbvuspch/04_Medien/Publikationen/Situationsberichte/Situationsbericht_2013.pdf (accessed on 15 May 2025).
[41] Swiss Federal Authorities (2023), Retail, About Switzerland, https://www.aboutswitzerland.eda.admin.ch/en/retail (accessed on 14 September 2025).
[91] Swiss Federal Institute of Intellectual Property (2017), The new Swissness legislation – Background, objectives and effects, https://www.ige.ch/fileadmin/user_upload/recht/national/e/swissness/Swissness_Background_and_Objectives.pdf (accessed on 2 February 2026).
[90] Swiss Federal Institute of Intellectual Property (n.d.), The “Swissness” legislation, https://www.ige.ch/en/law-and-policy/national-ip-law/indications-of-source/swiss-indications-of-source (accessed on 27 March 2026).
[42] Switzerland Innovation (2024), The numbers of the food and retail sector in Switzerland.
[43] TSM et al. (eds.) (2024), Statistique laitière de la Suisse 2023, https://www.sbv-usp.ch/fileadmin/user_upload/MISTA2023_def_online.pdf (accessed on 24 August 2025).
[14] UNESCO (2025), Alpine Pasture Season.
[73] United Nations (2025), UN-Comtrade [Database], https://comtradeplus.un.org/.
[38] Van Dam, I. et al. (2021), “A detailed mapping of the food industry in the European single market: similarities and differences in market structure across countries and sectors”, International Journal of Behavioral Nutrition and Physical Activity, Vol. 18/1, https://doi.org/10.1186/s12966-021-01117-8.
[84] Vincentini J., B. (2025), Swiss national nutrition survey in children and adolescents – report, FSVO, https://www.blv.admin.ch/blv/fr/home/lebensmittel-und-ernaehrung/ernaehrung/menuch-kids.html (accessed on 10 March 2026).
[95] Wang, Y. et al. (2024), “Product differentiation, quality, and milk price stability: The case of the Swiss cheese market”, Applied Economic Perspectives and Policy, Vol. 47/1, pp. 416-435, https://doi.org/10.1002/aepp.13467.
[65] Zorn, A. (2025), “The structure of ageing in Swiss agriculture”, Journal of Rural Studies, Vol. 115, p. 103574, https://doi.org/10.1016/j.jrurstud.2025.103574.
[20] Zorn, A. (2020), “Kennzahlen des Strukturwandels der Schweizer Landwirtschaft auf Basis einzelbetrieblicher Daten”, Agroscope Science 88, https://doi.org/10.34776/as88g.
← 1. Aargau (AG), Appenzell Ausserrhoden (AR), Appenzell Innerrhoden (AI), Basel-Country (BL), Basel-City (BS), Bern (BE), Fribourg (FR), Geneva (GE), Glarus (GL), Graubünden (GR), Jura (JU), Lucerne (LU), Neuchâtel (NE), Nidwalden (NW), Obwalden (OW), Schaffhausen (SH), Schwyz (SZ), Solothurn (SO), St. Gallen (SG), Thurgau (TG), Ticino (TI), Uri (UR), Valais (VS), Vaud (VD), Zug (ZG), Zurich (ZH).
← 2. As defined by the Federal Statistical Office. This definition has commonalities with the OECD definition of functional urban areas (FUAs). A FUA is composed of a city plus its surrounding, less densely populated spatial units that make up the city’s labour market and commuting zone (see https://www.oecd.org/en/data/datasets/oecd-definition-of-cities-and-functional-urban-areas.html).
← 3. The Eurostat urban-rural typology is applied to NUTS 3 regions (in the case of Switzerland, the 26 cantons). “Predominantly rural” regions are those where at least 50% of the population live in rural grid cells, or 1 km² cells with a population density of less than 300 inhabitants per km² and/or fewer than 5 000 inhabitants. See https://ec.europa.eu/eurostat/web/rural-development/methodology
← 4. The choice of illustrative peer countries for Switzerland includes a mix of OECD Members from different geographical regions.
← 5. Excluding inland waters.
← 6. This figure differs from the Utilised Agricultural Area (UAA) reported by the Federal Statistical Office. The UAA definition used in national agriculture statistics excludes Alpine summer pastures (Sömmerungsflächen).
← 7. The Agricultural Policy Information System (AGIS or SIPA) is the Swiss farm register and information system, used to control direct payments, among other functions.
← 8. The category “family employees” includes the farm manager and his/her immediate family, i.e. father, mother, brothers, sisters and children aged 15 and over who work on the farm.
← 9. See Section 2.2 for a description of the Swiss agricultural policy and the system of direct payments.
← 10. The Swiss FADN is managed by Agroscope, the Centre of Excellence for Agricultural Research, and aims to better understand the well-being and livelihood of farmers. It was renewed in 2015 to make it more representative of all farms in Switzerland and reduce over- or underrepresentation (Renner et al., 2019[29]).
← 11. “Special crops” include vegetables, fruits, and wine, among others.
← 12. Fenaco is owned by 137 agricultural co-operatives trading under the name LANDI, which have around 40 000 members. More than 23 000 members are active Swiss farmers. It operates on the upstream agricultural chain by procuring input and machinery for farmers, and on the middle of the chain by purchasing agricultural products from its members to process and distribute them (Fenaco, 2025[117]).
← 13. Private-labelled products are those sold under a retailer’s own brand name (e.g. Coop or Migros brands), rather than under the manufacturer’s brand.
← 14. Not counting expenditure on restaurants or animal products used in other food categories.
← 15. Farm stores often combine products made on farm with those from other farms and local processors; sellers in farmers’ markets frequently do the same.
← 16. Using OECD PPPs for food (1.53 for Switzerland; 0.91 for Italy) and non-alcoholic beverages (1.26 and 0.68, respectively), weighted by their shares in Swiss household expenditure (91.8% and 8.2%) (OECD, n.d.[118]).
← 17. The Farm Structure Survey (STRU), conducted by the Federal Statistical Office in co-operation with FOAG and the cantonal agricultural offices, collects data disaggregated by sex for farm managers and other farm workers. The survey covers all farms and is co-ordinated with the implementation of agricultural policy measures (direct payments).
← 18. Age data exists only for farms managed by a natural person (sole proprietorship), which on average represent approximately 87% of farms (Zorn, 2025[65]).
← 19. Switzerland has no legal definition of “young farmer”, but 35 is the age threshold up to which farmers can benefit from start-up support (Starthilfe).
← 20. Ecological Focus Areas (EFAs) are areas of agricultural land specifically designated for preserving and promoting biodiversity. See also Chapter 3.
← 21. This section examines key trends based on an analysis of Switzerland’s international trade statistics. Switzerland’s trade policy is discussed in Section 2.5. Policies in this area are shaped by Switzerland’s membership in the European Free Trade Association (EFTA), its participation in the multilateral trading system and trade agreements with numerous partners, including the European Union.
← 22. The subheading 210690 (Food preparations, n.e.s.) covers a wide range of products. An analysis of Swiss 8‑digit‑level trade data shows that sugar‑free chewing gums and candies (2106.9040) are the largest export item, followed by various nonspecified preparations not containing fat (2106.9099). The latter is also the most imported tariff line within this subheading.
← 23. The landscape in this area has evolved rapidly, and this chapter only reflects developments until December 2025. A few agro-food tariff headings in the product categories of food preparations (2106) and beer (2203) were initially subject to a tariff of 50%.
← 24. This refers to the trade of agricultural and food products that cross at least two international borders (i.e. that are re-exported) before being absorbed in final demand.
← 25. Trade in value-added (TiVA) indicators provide insights into countries’ participation in GVCs via intermediate imports embodied in exports (backward linkages) and domestic value added in partners’ exports and final demand (forward linkages). TiVA data considers the value that each country adds in the production of goods and services that are traded and consumed worldwide, capturing international flows of value added that are not shown by traditional trade statistics.
← 26. This phenomenon describes the trend of manufacturing sectors increasingly relying on services, whether as inputs, as activities within firms or as output sold bundled with goods. It relates to GVCs, as services are often deployed through international production networks (Miroudot and Cadestin, 2017[119]).