A simulation model was built to assess the impacts of environmental tax reform in the residential buildings sector on three outcomes: revenues, emissions and distributional effects. The analysis evaluates three scenarios, the introduction of the EU ETS2, an excise tax reform, and an air pollution tax, against a baseline over time.
The ETS2 reduces CO₂ emissions but does not lead to significant air pollution emission reductions from firewood heating under current assumptions. From 2028 onwards, the ETS2 provides a carbon price signal for residential energy use, leading to CO₂ emission reductions, but has no direct impact on PM₂.₅ emissions. Given the high costs of these emissions, a separate instrument would be justified.
An excise tax reform extends the tax base to include currently exempt fuels, such as coal, LPG, natural gas and biomass, and aligns rates more closely with the energy content of the energy source. By improving price certainty and aligning incentives across energy sources, the reform supports CO₂ reductions beyond the ETS2, while delivering additional PM₂.₅ abatement under current assumptions.
Scenarios that exempt firewood from taxation (as in the ETS2 scenario) or apply relatively limited rate increases (as under the excise tax reform scenario) create risks of distortionary substitution effects. Depending on the modelling specification, it encourages a shift towards more polluting fuels, potentially worsening local air quality.
An air pollution tax could deliver additional PM₂.₅ reductions and limit distortions, but risks significantly raising the burden for consumers in the short run and for the administration to implement. Applying the tax across energy products mitigates substitution effects and contributes to PM₂.₅ abatement. Under current assumptions, such a tax is not sufficient for Romania to meet its National Emission Ceiling for PM₂.₅ emissions. Substantial complementary policies remain necessary. Nationwide air-pollution taxes may be administratively less complex than location-specific taxes, but will not reflect location-specific external costs and entail significant distributional impacts.
Understanding distributional impacts can help design targeted support and other complementary policies. Under current assumptions, price increases from tax reforms in residential buildings disproportionately affect lower-income groups and rural households in Romania, underscoring the need for accompanying, well-targeted compensation measures and complementary policies that support these households in accessing low-emission alternatives.
Environmental Tax Policy Review of Romania

A simulation model allows to assess the impact of environmental tax reform scenarios in Romania’s residential building sector on tax revenues, emissions, and distributional outcomes over time. This section develops a simulation tool to study tax policy scenarios and their potential impacts on government revenues, environmental and distributional outcomes. The section outlines the structure of the model, including its design features and underlying assumptions, as well as the main modelling results to support a transparent and robust analysis of fiscal, environmental, and distributional outcomes of different tax reform scenarios in Romania. The section concludes with key findings and recommendations to inform policy development and implementation. While these recommendations focus on the findings from the policy scenarios, broader recommendations on other policies are provided in Chapter 2.
This Romanian case study offers valuable insights into a modelling approach of fiscal policy scenarios with minimum data inputs. It presents how a simple simulation tool can be useful to test policy scenarios in the field of environmental taxation, drawing on available data inputs and existing estimates.
The model aims to assess how tax reform in the residential building sector may influence energy use, emissions, and fiscal revenues in a partial equilibrium setting. It captures behavioural changes in energy use related to tax reform and their implications for public revenue and environmental outcomes, i.e. CO2 and PM2.5 emissions. Further, the model allows to determine the distributional impact of reform across households. Figure 3.1 presents an overview of the model, including its main inputs, the relevant taxes, and relevant estimation steps.

Note: The methodology is based on Stretton (2020[1]). Price elasticities refer to short-term elasticities for the residential building sector as estimated in the meta-analysis by Labandeira et al. (2017[2]). CO2 emission factors are based on the IPCC Emission Factor Database, while PM2.5 emission factors are based on EEA (2023[3]). All energy prices are 2024 prices and based on the IEA End-Use Energy Prices for Residential sector for Romania, except for coal (IEA, 2025[4]) and firewood (UNECE/ FAO, 2024[5]). From 2025 onwards, prices include the introduced VAT reform and changes in excise tax rates.
The scope of the model is defined by its geographic coverage, the time horizon, and the types of buildings it covers:
The geographic coverage of the model is Romania.
The time horizon of the model is 2030. The base year is set to 2024.
The building types that are covered are residential buildings. This excludes public buildings or buildings with a commercial purpose.
The model distinguishes six energy sources (LPG, natural gas, heating oil, solid biomass, coal, and electricity) and focuses on energy use by households.
The model follows a scenario-based approach and should be interpreted as a "what-if" analysis. Rather than providing predictions, the analysis explores potential future developments under clearly defined assumptions. Scenario analysis is a valuable tool for informing policymakers about possible opportunities, trade-offs, and risks in the context of uncertainty. It highlights outcomes that could emerge under alternative policy pathways or behavioural responses.
The main component of the analytical framework is a business-as-usual scenario, corresponding to a With Existing Measures (WEM) pathway. This scenario integrates current national and EU policies and measures currently in place. The WEM scenario also includes projections of technology cost within the projected energy use (Figure 3.2). The intuition behind the exercise is to assess the impact of a proposed tax reform respective to the business-as-usual scenario. Past trends of energy use are based on the National Energy and Climate Plan (NECP, 2024[6]). In the absence of specific projections for energy use within the building sector, projections are based on linear projection based on average annual energy use growth rate over the period of 2020 and 2022.
Historical data 2020-2023 and projections from 2024 onwards, in ktoe

Note: The projections for 2024 to 2030 are based on linear projections based on average annual energy use growth rate over the period of 2020 and 2022. From 2025 onwards, the baseline includes prices changes through the VAT reform and respective behavioural responses.
Source: Author’s elaboration based on Romania’s National Energy and Climate Plan 2021-2030 (NECP, 2024[6]).
To estimate the fiscal implications of the tax reform, the analysis adopts an isoelastic model, following the methodology of Stretton (2020[1]). Under this specification, the energy use in the reform scenario is a function of the relative price change, governed by a constant, own-price elasticity of demand. For additional details on the modelling, see Annex D.
The model captures the behavioural response of consumer with respect to price changes through price elasticities. Short-term elasticities predominantly reflect adjustments in fuel demand conditional on existing fuel technologies and the prevailing energy efficiency of housing stock. In contrast, medium- and long-term elasticities incorporate households' broader behavioural and technological responses, such as investments in clean energy heating and energy efficiency upgrades, including housing retrofits. Due to the lack of price elasticities for Romania, the main analysis is based on the short-term elasticities as estimated in the meta-analysis by Labandeira et al. (2017[2]) (see Annex C).
Increasing the price of energy through taxation will not only affect the consumption of the taxed energy source but can also lead to substitution towards other energy sources. This effect is included as robustness check by applying cross-price elasticities of demand, which measures how the demand for one good responds to changes in the price of another (for example, the change in electricity demand when the price of natural gas changes). While own-price elasticities are typically negative, reflecting that energy use decreases when the price of that fuel increases, cross-price elasticities are generally positive, as the consumption of one fuel tends to rise when the price of a competing or substitute fuel increases (Filippini, 2011[7]). Existing estimates on historical data suggest relatively modest cross-price effects ranging from 0.01 to 0.22, depending on the respective energy source.1 There is so far no comprehensive cross-price elasticity study covering all energy sources (electricity, coal, biomass, LPG, heating fuel, natural gas), specifically for Central and Eastern European countries.
The distributional impact analysis applies the total energy price change to households’ energy expenditures. It draws on the 2015 Household Budget Survey, the last survey vintage with comprehensive information on household energy spending in Romania. For transparency, the analysis is conducted without behavioural responses. As such, results represent upper-bound estimates, as they do not account for potential adjustments to higher prices, including reductions in energy use, improvements in energy efficiency, or energy source switching. For simplicity, price changes are applied to 2015 prices, which avoids taking additional assumptions on price developments. However, this assumes that the ratio between income and energy prices remained constant since 2015.
While the model provides insights into the mechanisms through which environmental tax reforms influence energy use, emissions, and fiscal outcomes, it remains a stylised analytical tool and should be interpreted accordingly. The model is static in nature and does not capture the full range of behavioural, technological, and market dynamics that evolve over time. Notably, it abstracts from endogenous technological change, including improvements in energy efficiency or shifts in the cost and performance of clean energy technologies. It also assumes constant energy prices across scenarios, omitting potential feedback effects or market responses to changing demand patterns. Cross-price elasticities, which would allow for switching across energy sources in response to relative price changes, are not explicitly modelled. Furthermore, the model does not incorporate the dynamics of the housing stock, such as new construction activity. As such, while the model is suitable for revealing first-order effects and policy trade-offs in the short term, it does not represent a full general equilibrium framework or long-term predictions.
The assessment of potential reform options is conducted through a scenario analysis. These scenarios are informed by the review of the Romanian tax framework (Chapter 1 Section 4, Chapter 2 Section 2 and 5), considering data and modelling constraints. The scenarios build up on each other, as policies tend to be implemented as policy mixes. They include (i) the introduction of the EU ETS2; (ii) an excise tax reform on energy products; and (iii) an air pollution tax. Table 3.1 gives an overview of the policy scenarios. Other instruments like tax incentives, subsidies, or regulations could be implemented alongside these pricing instruments and boost their effectiveness but are not modelled given data and modelling constraints. Despite their central role for building decarbonisation, policies targeting retrofitting are not modelled given the absence of housing stock data in Romania.
Source: Author’s elaboration.
3.2.1. Policy Scenario 1: Introduction of the EU ETS2
The first policy scenario models the introduction of the EU ETS2 in 2028. The ETS2 is currently announced to become fully operational from 2028 onwards and apply to all fuels used in the residential sector (excluding electricity and firewood). Future ETS carbon prices are inherently uncertain and will ultimately be determined by the EU carbon market.2 The simulation assumes a carbon price of EUR 48 per tonne of CO2, corresponding to the price assumed at the start of the ETS2 in the European Commission impact assessment (European Commission, 2021[8]).
Few studies on ETS2 price projections exist, and projections vary widely across studies by underlying modelling assumptions, such as the inclusion of complementary policy measures, and ETS2 allowance supply and market behaviour. Studies project ETS2 prices that range between EUR 71 and EUR 360 per tonne of CO2 depending on assumptions on the baseline and technology development, and whether the carbon price is the only new instrument used to reach the target or if complementary policies are included (Rickels, Rischer and Schenuit, 2023[9]; Abrell et al., 2024[10]; Görlach et al., 2022[11]; Günther et al., 2025[12]). For example, when strong complementary policies are in place, lower carbon prices may be sufficient to deliver the additional emission reductions needed to meet the 2030 target. By contrast, under weak complementary policies, the ETS2 price would have to rise significantly higher to achieve the same outcome.
3.2.2. Policy Scenario 2: EU ETS2 + Excise tax reform
The second policy scenario models the introduction of the EU ETS2 in combination with an excise tax reform that extends the tax base to include currently exempt fuels, such as coal, LPG, natural gas and biomass. The excise tax reform scenario aims to align excise taxes more closely with the energy content of the energy products, as currently done in Denmark, Sweden and Finland (although these countries apply higher rates and an additional CO2 component). This scenario is based on the tax rates proposed in the ETD reform proposal by the European Commission and extends the tax base across all energy products (European Commission, 2021[13]).3,4 Table 3.2 provides an overview of the current rates compared to the proposed reform.
Note: (*) The ETD proposal includes a tax for fuel wood, wood in chips or particles, sawdust, wood waste and scrap, and wood charcoal, but only if these are intended for use as heating fuel in installations with a total rated thermal input equal to or exceeding 5 MW. Hence this would not cover solid biomass use for household stoves. However, the scenario applies biomass and the respective price to households. Romanian excise tax rates refer to applicable rates as of November 2025.
3.2.3. Policy Scenario 3: EU ETS2 + Excise tax reform + Air pollution tax
The third policy scenario models an air pollution tax in addition to the EU ETS2 and the excise tax reform. The air pollution tax applies a tax rate of EUR 0.4 per kg of PM2.5 emission, applying the same price as the PM charge in Poland. The Poland PM charge applies to industrial combustion sources (>5MW) and not buildings. It serves as lower bound starting point for the air pollution tax scenario, which foresees a gradual increase to reach EUR 1 per kg of PM₂,₅ in 2030. A gradual increase of the price signal gives households time to adapt.
The rate assumed for the air pollution tax does not reflect the external costs related to air pollution or the rate necessary to reach the air pollution target in the NEC, due to the significant burden for consumers in the short run. Aligning the rate of an air pollution tax with the external cost of air pollution could be based on the number of attributable deaths, value of statistical life and total yearly PM2.5 emissions (Chapter 2 Section 4.1). Simple calculations would result in an average Romanian damage cost of EUR 728.02 per kg of PM2.5 (see Annex E). This would result in a significant burden on the users of firewood and coal stoves. Assuming the introduction of complementary policy instruments that also contribute to reducing air pollution, such as subsidies for energy efficient or low-emission heating or a location-specific ban on solid fuel use for heating, can justify a lower rate of the air pollution tax while still reaching the target to some extent.
Because external costs from air pollution vary across locations, air pollution taxes would vary regionally as well. As chapter 2. section 4.1. highlights, the external costs from air pollution depend on population density and other location-specific factors. To reflect these varying external costs, an option could be to introduce a municipality-specific correction factor, based on population density and an air quality coefficient, similar to the approach used in Chile’s taxes on PM, SO₂, and NOₓ on industrial plants. This could enhance efficiency by levying the tax on the municipalities, where the damage from air pollution is the highest. However, applying such a tax to households, this raises concerns about tax avoidance, for example if households purchase firewood in neighbouring municipalities with lower tax rates. Another caveat is the administrative burden that comes with fine-tuning tax rates to varying pollution levels.
Due to data limitations, the modelling exercise does not include a regional air pollution tax. While air pollution concentration data are available, there is currently no publicly accessible data on sector-specific air pollution emissions at the level of municipalities or cities in Romania.
This section presents the results of the modelling exercise, assessing the fiscal, environmental, and distributional impacts of the three policy scenarios under consideration. The analysis focuses on the evolution of energy use in the residential sector driven by changes in energy prices from tax reform according to the three policy scenarios (Figure 3.3) and resulting behavioural changes.
The model shows that energy prices increase across all policy scenarios and across fuel-types by 2030, with the exception of biomass and electricity. Under the ETS2-only scenario, biomass is not subject to a tax and there is thus no price increase. This changes when including the excise tax reform and the air pollution tax, which increases the biomass price to 4% and 11% respectively. Introducing the air pollution tax also affects the coal price, for which a significant price increase is visible due to its cumulative impact of the ETS2, the excise tax reform, and the air pollution tax. While the electricity price is unchanged under the ETS2 scenario, it slightly decreases (-1%) in the other two policy scenarios due to the reduction in excise taxes compared to the baseline.
Percentage change relative to the baseline price

Note: Scenario 1 models the introduction of the EU ETS2 assuming a carbon price of EUR 48 per tonne of CO₂. Scenario 2 introduces an excise tax reform. Scenario 3 adds an air pollution tax across all energy products. All impacts are reported relative to the baseline scenario.
Source: Author’s elaboration.
Energy use declines across fuels in response to higher energy prices across scenarios, although biomass and electricity consumption may increase due to substitution effects (Figure 3.4). Households will adjust energy use to higher prices according to estimates from the literature (Labandeira, Labeaga and López-Otero, 2017[2]). The responsiveness to prices is not uniform across fuels and depends on whether the model focuses on own energy use effects (single-price elasticities, Figure 3.4, Panel A) or also includes substitution effects (cross-price elasticities, Figure 3.4, Panel B). Including single-price elasticities leads to energy use reductions proportional to the price increase. In contrast, including cross-price elasticities takes into account possible energy switching that might increase energy use of other energy sources. Substitution effects offset part of the expected reduction in total energy use assumed in the present model (visible as differences between Panel A and B). In the ETS2 and the excise tax reform scenario, substitution effects lead to an energy use increase of biomass and electricity. The increase in biomass is reduced in the excise tax reform scenario compared to the ETS2 but not sufficiently so to avoid a net increase. The increase in biomass also increases air pollution emissions compared to the baseline (see Annex F, Figure A F.2). Similar findings for Romania are found by Maier et al. (2025[14]).
Substitution effects come with significant uncertainty and are not included in the following environmental, fiscal, and distributional simulations. In the absence of Romania-specific estimates, applying cross-price estimates from other countries is linked to significant uncertainty, i.e. would not reflecting well substitutability of different energy sources across Romania. Further, existing studies estimate substitution effects based on past data. The cost of certain energy sources and energy-efficient technologies is uncertain and likely to change over time. In the case of future low-carbon innovations, substitution effects might be more important than those based on historical data, and estimates would therefore represent lower bound effects. Lastly, given the focus of the simulation on the short run, substitution effects might be less important. In the short-run, substitution between energy sources might be limited due to investment costs.
Relative to the 2030 benchmark scenario (%)

Note: Scenario 1 models the introduction of the EU ETS2 assuming a carbon price of EUR 48 per tonne of CO₂. Scenario 2 introduces an excise tax reform. Scenario 3 adds an air pollution tax across all energy products. All impacts are reported relative to the baseline scenario.
*Results using cross-price elasticities come with significant uncertainty and are not used in the following environmental, fiscal, and distributional simulations.
Source: Author’s elaboration.
3.3.1. Environmental impact
Reducing carbon-intensive energy use will directly lower CO₂ emissions, with the scale of these reductions varying with the carbon intensity of the energy source (Figure 3.5). Scenarios that strengthen price signals for carbon-intensive energy sources, result in lower consumption (see above) and achieve larger emission reductions. Under given modelling assumption, the introduction of the ETS2 alone is projected to reduce CO2 emissions by an additional 2.5 percentage point relative to the baseline (Scenario 1). Adding an excise tax reform (Scenario 2) is projected to reduce emissions by an additional of 3.2 percentage points, while introducing an air pollution tax adds another 3.8 percentage points (Scenario 3). Despite significant emission reductions, reaching the Integrated National Energy and Climate Plan target for buildings of 19% GHG emission reductions by 2030 from 1990 levels is achieved in none of the scenarios and additional policies will be required.
As % of 2005 emissions

Note: Scenario 1 models the introduction of the EU ETS2 assuming a carbon price of EUR 48 per tonne of CO₂. Scenario 2 introduces an excise tax reform. Scenario 3 adds an air pollution tax across all energy products. All impacts are reported relative to the baseline scenario.
Source: Author’s elaboration.
A key determinant of the impact of policy scenarios on air pollution is the treatment of biomass. Effectively tackling air pollution through taxation necessitates the inclusion of biomass, and hence firewood, in the tax base. Figure 3.6 resents the impact on PM2.5 emissions across policy scenarios relative to the baseline scenario. Since the ETS2 excludes biomass, this scenario has limited impact on PM2.5 emission reductions. In contrast, introducing an excise tax reform or an air pollution tax on all energy sources achieves reductions in PM2.5 emissions.
Relative to the baseline scenario

Note: Scenario 1 models the introduction of the EU ETS2 assuming a carbon price of EUR 48 per tonne of CO₂. Scenario 2 introduces an excise tax reform. Scenario 3 adds an air pollution tax across all energy products. All impacts are reported relative to the baseline scenario.
Source: Author’s elaboration.
The analysis indicates that, under given assumptions, the tax reform scenarios could move Romania slightly closer to their PM2.5 reduction target, but substantial additional policies will still be needed to achieve it. Under the NEC Directive PM2.5 emissions should be reduced by 28% by 2030 relative to 2005 levels across all sectors. Under existing policies (baseline) the gap between the 2030 target and actual PM2.5 emissions is projected to be of 42 percentage points in 2030 (Figure 3.7). A similar gap has been estimated in the Review of the National Air Pollution Control Programme for Romania that estimates a non-compliance gap of 41 percentage points in 2030 under existing measures (Romanian Ministry of the Environment, Water Management and Forestry, 2023[15]). The analysis shows that a tax reform may reduce this gap of non-compliance, but is unlikely to close it. Although the air pollution tax scenario result in a significant reduction of PM2.5 emissions, it remains insufficient to meet the NEC targets. Additional measures such as public investment in infrastructure, subsidised loans, subsidies for energy efficient or low-emission heating or a ban on solid fuel use for heating in certain locations that complement tax reform and PM2.5 reductions in other sectors will be necessary to achieve full compliance with the target.
As % of 2005 emissions

Note: Scenario 1 models the introduction of the EU ETS2 assuming a carbon price of EUR 48 per tonne of CO₂. Scenario 2 introduces an excise tax reform. Scenario 3 adds an air pollution tax across all energy products. All impacts are reported relative to the baseline scenario.
Source: Author’s elaboration.
3.3.2. Fiscal impact
The tax reforms modelled through the different policy scenarios would generate substantial fiscal revenues over time (Figure 3.8). The ETS2 is estimated to raise revenues of around 0.1% of GDP annually (Figure 3.8, Panel A). The figure also outlines the importance of interaction effects between different taxes and tax revenues. For example, VAT is applied to the final consumer price, which already includes excise duties and any carbon taxes. As a result, introducing a carbon price on energy products through the ETS2 (or via an excise tax reform) will indirectly increase VAT revenues by raising the taxable base. An excise tax reform would provide an additional revenue of 0.02% of GDP in the first year following its introduction, while declining over time because of reduced energy use (Figure 3.8, Panel B). Adding an air pollution tax would increase revenues to 0.03% of GDP by 2030 (Figure 3.8, Panel C). In 2022 environmentally related tax revenue in Romania accounted for 1.8% of GDP (OECD, 2025[16]). Increases in fiscal revenue through the policy scenarios therefore play a non-negligible role.
Potential revenue use will depend on the type of policy reform introduced. While the revenue generated the excise tax, air pollution tax and VAT will be fully available to the general budget unless earmarked e.g. for redistribution, this does not hold for revenues generated through the ETS2. A fixed share of ETS2 revenues (63%) will finance the European Social Climate Fund to support vulnerable households. While the Social Climate Fund will redistribute funds across member states, and Romania is expected to be one of the largest beneficiaries, only 37% of the revenue will be directly available to the Romanian fiscal budget. Further, the estimated revenues should be viewed as an upper bound of potential deficit reduction. Although the revenues from the national taxes will go directly to the general budget, a portion of these proceeds could be redistributed to vulnerable households that may suffer disproportionate impacts from the tax reforms. Compensatory measures are essential and should be designed to be efficient and well-targeted (OECD, 2024[17]). One example is a targeted transfer based on specific household characteristics that lead to vulnerabilities. The distributional impact analysis (section 3.3.) is key to understand which characteristics matter.
Relative to the benchmark scenario

Note: Scenario 1 models the introduction of the EU ETS2 assuming a carbon price of EUR 48 per tonne of CO₂. Scenario 2 introduces an excise tax reform. Scenario 3 adds an air pollution tax across all energy products. All impacts are reported relative to the baseline scenario as percentage of 2024 GDP.
Source: Author’s elaboration.
A concern with environmental taxes, like carbon and air pollution taxes, is that they may not provide a stable long-term revenue source. The primary objective of these taxes are emissions reduction in that sense they ultimately erode their own tax base and revenues likely decline (OECD, 2024[18]; OECD/ITF, 2019[19]). One policy solution to this is to introduce environmental taxes gradually, so that rising tax rates can outweigh the revenue shortfall from reduced emissions in the short to medium term. For the Romanian case, given that emissions reductions are projected to be limited until 2030, this effect may be of less concern in the medium term.
3.3.3. Distributional impact
All tax reform scenarios increase energy costs and consequently reduce households’ disposable income everything else equal, with disproportionate effects on low-income households. Figure 3.9 illustrates the effect tax reform has for different income groups using modelling results for Scenario 3. It shows average net energy expenditures before and after the tax reform per income decile in Romania. Lower-income households devote a significantly larger share of their income to energy use than higher-income households, a pattern that persists following the reform. Moreover, the increase in this expenditure share is more pronounced for low-income households than for higher-income groups. As a result, lower-income households are disproportionately exposed to the effects of the tax reform, implying that, in the absence of compensatory measures, the reform would have regressive distributional impacts.
Disaggregating the effects by energy source shows that the overall regressive impact of the reform is strongly driven by households’ primary heating fuel. The largest adverse distributional effects are observed for low-income households relying on LPG, for whom the reform has a pronounced regressive impact. Firewood use is also associated with regressive outcomes, with the burden falling disproportionately on lower-income households. By contrast, households heating with natural gas experience a more progressive impact. At the same time, it should be noted that the air pollution tax is currently set at a relatively modest level. Given the pre-reform distribution of energy use, modelling a higher air pollution tax would therefore entail stronger distributional effects, particularly for households dependent on firewood and coal. This underlines the importance of complementary public investment in natural gas and district heating infrastructure to facilitate energy source switching and ease the adjustment for affected households.
2015
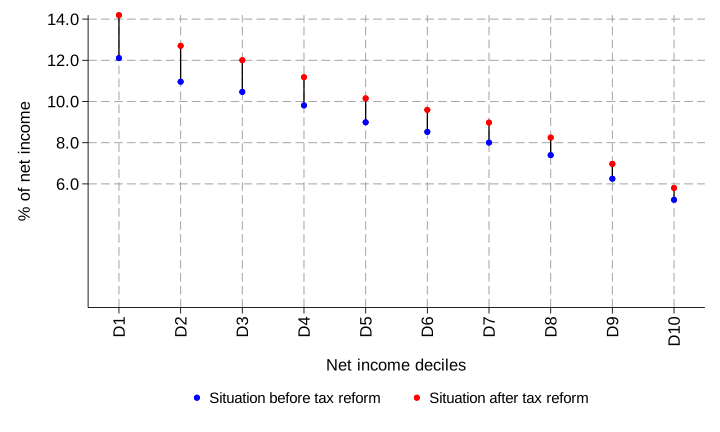
Note: The tax reform includes the ETS2 (48 EUR per tonne of CO2e), an excise tax reform of energy products, and an air pollution tax (1 EUR per kg of PM2.5).
Source: Eurostat, HBS 2015.
Beyond income levels, the vulnerability of households to energy price shocks also depends on other factors such as the location. As heating sources available to households can depend on location, it may shape how tax reform affects households. Figure 3.10 shows the differential impact of tax reform of income deciles differentiating by household location, whether they are located in cities, towns, or rural areas. In Romania, rural households tend to rely more heavily on firewood and coal for heating, a pattern observed across all income groups. By contrast, electricity and natural gas are more commonly used in cities and urban areas. As a result, the proposed tax reform, which substantially increases the price of coal and biomass, has a stronger impact on rural households than on those living in urban areas.
% of net income, 2015
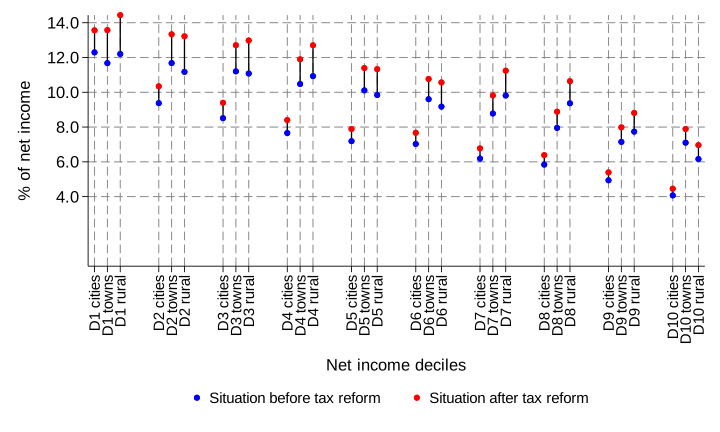
Note: The tax reform includes the ETS2 (48 EUR per tonne of CO2e), an excise tax reform of energy products, and an air pollution tax (1 EUR/ kgPM2.5).
Source: Eurostat, HBS 2015.
Overall, the modelling results highlight that some households may be disproportionately affected by energy-related tax reforms in the residential buildings sector raising the relevance of accompanying targeted support measures. Parts of the additional fiscal revenues generated could be used to finance targeted redistributive measures to mitigate adverse effects. These measures would best take the form of well-targeted income support rather than price support. Although it may be administratively more costly, it enables targeting along important dimensions, such as income, location and consumption patterns (OECD, 2022[20]). Vulnerable households may also benefit from support to manage costly upfront investments needed for switching heating sources or insulate buildings that can come e.g. via targeted subsidised loans. See Chapter 2 section 4.3. for an in-depth discussion of targeted support measures and revenue use.
Given that local conditions vary, across building typologies, energy source availability, and socio-economic characteristics, support measures may be differentiated rather than uniform. In rural, firewood-dependent areas, the priority may be the diversification of heating sources, while in areas with broader energy source access, the focus may shift toward building renovation and fuel switching.
A simulation model was built to assess the impacts of environmental tax reform in the residential building sector on three outcomes: revenues, emissions and distributional effects. The analysis evaluates three scenarios, the introduction of the EU ETS2, an excise tax reform, and an air pollution tax, against a baseline over time. While strong complementary policy measures are key to ensure effective and equitable GHG and air pollution emission reductions, the present findings are limited to the policy scenarios, while broader recommendations regarding complementary policies are provided in Chapter 2.
Tax policy offers multiple levers to reduce GHG and air pollution emissions, each with distinct trade-offs. A combination of different environmental taxes may support Romania in improving the environmental impact of its residential building stock, while understanding their distributional impact is key to design targeted support measures for vulnerable households.
Modelling results show that introducing an environmental tax reform requires attention to the following key elements:
Environmental tax reform in Romania should consider forthcoming EU-level changes, to ensure consistency, avoid overlaps, and maximise synergies between national and EU policies. The EU ETS2 will introduce a carbon price signal on energy use in the residential buildings sector in Romania, although its currently announced implementation date is not until 2028. The simulation exercise suggests that the EU ETS2, on its own, will not be sufficient to reach GHG and air pollution targets. Additional national policies can support GHG emission targets, while minimising potential negative impacts on air pollution.
An excise tax reform that extends the tax base to currently exempt fuels can provide additional price signals to households and further strengthen environmental and revenue outcomes. Romania could act before the introduction of the EU ETS2 by 2028 or a reform of the ETD. In particular, including biomass could help reduce the risk of fuel switching that worsens local air pollution. An excise tax reform would also allow Romania to provide anticipated price signals for households. However, to achieve significant CO2 emission reductions and revenue increases, substantially higher tax rates would be required.
A hypothetical air pollution tax can complement the EU ETS2 by strengthening air pollution emission reduction, but raises significant concerns about administrative feasibility and implementation capacity. The air pollution tax base should ideally cover all energy sources, including firewood, to avoid distortions and address major sources of emissions. This is particularly important for tackling Romania’s air pollution challenge, given the high reliance on firewood for heating and its significant contribution to PM2.5 emissions. The air pollution tax would complement ETS2, strengthening (by design) air pollution outcomes in particular. However, tax measures alone are unlikely to be sufficient for Romania to move closer to its national emission ceiling targets. An air pollution tax also risks imposing substantial short-term costs on consumers and raising significant concerns about administrative feasibility and implementation capacity.
The tax reform for buildings has a regressive impact on households under current assumptions. Analysing the comprehensive tax reform shows that it disproportionately affects lower income households living in rural areas. Redistributive measures can be targeted to these households to mitigate adverse impacts of the tax reform (see Chapter 2, Section 2.4.3.). However, redistributive measures have to be balanced with the revenue-raising potential of the reform, and possible limitations it may provide with regards to emission reduction incentives from the tax reform.
References
[10] Abrell, J. et al. (2024), “Optimal allocation of the EU carbon budget: A multi-model assessment”, Energy Strategy Reviews, Vol. 51, p. 101271, https://doi.org/10.1016/j.esr.2023.101271.
[3] EEA (2023), “EMEP/EEA air pollutant emission inventory guidebook 2023: Technical guidance to prepare national emission inventories”, https://www.eea.europa.eu/en/analysis/publications/emep-eea-guidebook-2023.
[22] EIA (2021), “Price Elasticity for Energy Use in Buildings in the United States”, U.S. Department of Energy, https://www.eia.gov/analysis/studies/buildings/energyuse/pdf/price_elasticities.pdf.
[8] European Commission (2021), Impact Assessment Report accompanying Directive of the European Parliament and the Council amending Directive 2003/87/EC, Decision (EU) 2015/1814 and Regulation (EU) 2015/757, https://eur-lex.europa.eu/resource.html?uri=cellar:7b89687a-eec6-11eb-a71c-01aa75ed71a1.0001.01/DOC_1&format=PDF#page=122.
[13] European Commission (2021), Proposal for a council directive restructuring the Union framework for the taxation of energy products and electricity (recast), https://eur-lex.europa.eu/legal-content/EN/TXT/HTML/?uri=CELEX:52021PC0563&from=EN.
[23] European Council (2025), Economic and Financial Affairs Council, 13 November 2025, https://www.consilium.europa.eu/en/meetings/ecofin/2025/11/13/.
[7] Filippini, M. (2011), “Short- and long-run time-of-use price elasticities in Swiss residential electricity demand”, Energy Policy, Vol. 39/10, pp. 5811-5817, https://doi.org/10.1016/j.enpol.2011.06.002.
[11] Görlach, B. et al. (2022), “A Fair and Solidarity-based EU Emissions Trading System for Buildings and Road Transport”, Kopernikus-Projekt Ariadne, Potsdam., https://www.ecologic.eu/sites/default/files/publication/2022/30003-Ariadne-Report-Fair-EU-ETS-Building-Transport-web.pdf.
[12] Günther, C. et al. (2025), “Carbon prices on the rise? Shedding light on the emerging second EU Emissions Trading System (EU ETS 2)”, Climate Policy, pp. 1-12, https://doi.org/10.1080/14693062.2025.2485196.
[4] IEA (2025), “World Energy Outlook 2025”, https://iea.blob.core.windows.net/assets/dfe5daf4-dbc1-4533-abeb-fafb1faee0f9/WorldEnergyOutlook2025.pdf.
[2] Labandeira, X., J. Labeaga and X. López-Otero (2017), “Energy demand elasticities for OECD countries: A meta-analysis”, Energy Economics, Vol. 65, pp. 233–238.
[14] Maier, S. et al. (2025), “Minimum energy taxes for climate and clean air in the EU: Environmental and distributional impacts”, Energy Economics, Vol. 152, p. 109001, https://doi.org/10.1016/j.eneco.2025.109001.
[6] NECP (2024), Integrated National Energy and Climate Plan for Romania, https://commission.europa.eu/document/download/75df0ac2-ecf9-4212-89ac-2a603bd43e36_en?filename=RO_FINAL%20UPDATED%20NECP%202021-2030%20%28English%29.pdf.
[16] OECD (2025), “Environmentally related tax revenue”, https://data-explorer.oecd.org/vis?lc=en&tm=ertr&pg=0&snb=2&df[ds]=dsDisseminateFinalDMZ&df[id]=DSD_ERTR%40DF_ERTR_ACC&df[ag]=OECD.ENV.EPI&df[vs]=1.0&dq=A.DNK....USD.&pd=2013%2C&to[TIME_PERIOD]=false.
[17] OECD (2024), OECD Employment Outlook 2024: The Net-Zero Transition and the Labour Market, OECD Publishing, Paris, https://doi.org/10.1787/ac8b3538-en.
[18] OECD (2024), “Pricing Greenhouse Gas Emissions 2024”, OECD Series on Carbon Pricing and Energy Taxation, OECD Publishing, Paris, https://doi.org/10.1787/b44c74e6-en.
[20] OECD (2022), Tax Policy Reforms 2022: OECD and Selected Partner Economies, OECD Publishing, Paris, https://doi.org/10.1787/067c593d-en.
[19] OECD/ITF (2019), Tax Revenue Implications of Decarbonising Road Transport: Scenarios for Slovenia, OECD Publishing, Paris, https://doi.org/10.1787/87b39a2f-en.
[21] Özer, E. et al. (2024), “The impact of energy prices in decarbonizing buildings’ energy use in the EU27”, Energy and Buildings, Vol. 323, p. 114814, https://doi.org/10.1016/j.enbuild.2024.114814.
[9] Rickels, W., C. Rischer and F. Schenuit (2023), “Potential efficiency gains from the introduction of an emissions trading system for the buildings and road transport sectors in the European Union”, KIEL WORKING PAPER, Vol. 2249, https://www.ifw-kiel.de/fileadmin/Dateiverwaltung/IfW-Publications/fis-import/200f22d3-1461-4366-ab70-c1a83fd7dd7f-KWP_2249.pdf.
[15] Romanian Ministry of the Environment, Water Management and Forestry (2023), National Air Pollution Control Programme, Romania, 2023, https://circabc.europa.eu/ui/group/cd69a4b9-1a68-4d6c-9c48-77c0399f225d/library/ce94309f-f9da-46e3-afa4-dbedd50c3fa0/details.
[1] Stretton, S. (2020), “A simple methodology for calculating the impact of a carbon tax”, World Bank.
[5] UNECE/ FAO (2024), “UNECE/FAO Forest Products Annual Market Review”, https://unece.org/sites/default/files/2024-11/2413966E_FPAMR24_WEB.pdf.
← 1. For EU countries, Özer et al. (2024[21]) estimate the cross-price elasticity of gas demand with respect to electricity prices is projected to range from 0.03 to 0.11, while the cross-price elasticity of electricity demand with respect to gas prices is estimated between 0.01 and 0.22 For the United States, the U.S. Energy Information Administration projects cross-price elasticities in the residential sector by 2030. The elasticity of natural gas demand with respect to electricity prices is estimated at 0.10, while that of distillate fuel with respect to electricity prices is 0.02. Conversely, the elasticity of electricity demand with respect to natural gas prices is 0.03, and that of distillate fuel with respect to natural gas prices is 0.02. The elasticity of natural gas with respect to distillate fuel is 0.01, while there is no measurable elasticity for electricity with respect to distillate fuel prices (EIA, 2021[22]).
← 2. To avoid price escalations, a Market Stability Reserve (MSR) will release additional allowances when the average price of ETS2 allowances in the auctions exceeds EUR 45 per tonne of CO2e for two consecutive months until 2030. However, the amount of EUR 45 per tonne of CO2 is not an absolute threshold. Instead, if the EUR 45 threshold is achieved and ETS2 allowances are released, the carbon price could still go higher.
← 3. Currently, the introduction of the reform remains uncertain (European Council, 2025[23]).
← 4. While the proposal includes a tax for biomass use in installations with a total rated thermal input equal to or exceeding 5 MW and thus excluding biomass from the reform, the underlying scenario applies the rate to biomass use in household stoves.