MDBs are key players. They accounted for the largest share of private finance mobilisation (71%) over 2021-2024, reflecting their scale, mandates and risk-bearing capacity (Figure 2.1). Bilateral providers played an important role, too, notably through their DFIs.
Private Finance Mobilisation Report 2026

MDBs are leading actors
Percentage of total (annual average)

Source: OECD (2026[1]), OECD Dashboard on Private Finance Mobilisation.
Among MDBs, the International Finance Corporation (IFC) played a leading role, mobilising USD 20.6 billion per year on average over 2021-2024 or 41% of all private finance mobilised by multilateral organisations. As shown in Figure 2.2, the next-largest volumes were mobilised by European Union (EU) institutions; the Multilateral Investment Guarantee Agency (MIGA); IDB Invest, the private sector arm of the Inter‑American Development Bank (IDB) Group; the African Development Bank (AfDB); and the European Bank for Reconstruction and Development (EBRD).
Other multilateral institutions, including multilateral and climate funds, also contributed meaningfully to private finance mobilisation although on a smaller scale. In particular, the Green Climate Fund (GCF) mobilised an average of USD 1.8 billion from the private sector and the Global Environment Facility (GEF) mobilised approximately USD 0.9 billion, highlighting the growing albeit still limited role of dedicated climate funds in crowding in private capital.
Guarantees were the primary leveraging mechanism used by MDBs, followed by syndicated loans and DICs (Figure 2.2). Other multilateral institutions relied on more differentiated approaches: the GCF mobilised private finance predominantly through equity shares in CIVs, whereas the GEF primarily leveraged private capital through co‑financing arrangements, reflecting differences in their mandates, risk appetite and operational models.
USD billion, annual average, constant 2023 prices

Source: OECD (2026[1]), OECD Dashboard on Private Finance Mobilisation.
Note: AsDB = Asian Development Bank, IBRD = International Bank for Reconstruction and Development, CAF = Development Bank of Latin America and the Caribbean, CEB = Council of Europe Development Bank, BSTDB = Black Sea Trade and Development Bank, CGIF = Credit Guarantee and Investment Facility, CIFs = Climate Investment Fund, IFAD = International Fund for Agricultural Development, UNCDF = United Nations Capital Development Fund.
Bilateral providers remain key actors in the mobilisation landscape
Among the bilateral providers, the United States was by far the largest provider of private finance mobilised over 2021-2024, accounting for USD 6.5 billion on average per year or 42% of the total mobilised by bilateral providers, followed by the United Kingdom, France, Germany and Japan (Figure 2.3). DICs were the principal leveraging mechanism used by bilateral providers during this period, accounting for 29% of their total mobilisation, followed by guarantees (25%).
USD billion, annual average, constant 2023 prices

Source: OECD (2026[1]), OECD Dashboard on Private Finance Mobilisation.
Bilateral DFIs are also critical players in scaling up private finance mobilisation efforts. Between 2021 and 2024, these DFIs mobilised a cumulative total of USD 42.8 billion, with annual mobilisation increasing from USD 9.2 billion in 2021 to USD 12.2 billion in 2024.
The US International Development Finance Corporation (DFC), Proparco and BII – were the top three largest DFI providers over the 2021-2024 period. The DFC was the single largest mobiliser with USD 5.41 billion mobilised per year on average, Proparco second with USD 1.71 billion and BII with USD 1.40 billion. Other DFI members mobilised substantial volumes, among them FMO (USD 0.53 billion per year on average) and DEG about USD 0.71 billion.
In terms of leveraging mechanism used, DFC relied heavily on guarantees – averaging about USD 2.44 billion per year – and direct investments. Proparco made greater use of credit lines (USD 0.94 billion), and BII focused on shares in CIVs and direct investments (about USD 0.54 billion and USD 0.83 billion, respectively), indicating its emphasis on direct equity financing. DEG’s profile highlights a more diversified mix of leveraging mechanism instruments; FMO mobilisation of private finance notably focused on syndicated loans (about USD 0.36 billion annually).
These patterns reflect the significant diversity of institutional specialisations, helping to illustrate how different mobilisation approaches can succeed, while collectively enabling DFIs to engage a broader range of private investors and market segments.
Figure 2.3 and Figure 2.4 also reflect the diverse abilities of bilateral development finance providers in terms of private finance mobilised over 2021-2024. The data show the different institutional capacities and technical knowledge that exist within bilateral development agencies, including national DFIs, to use the toolkit of mobilisation instruments. For instance, the United States, Sweden and Denmark deploy guarantees to a much greater degree than other donors that rely on other leveraging mechanisms.
USD billion, annual average, constant 2023 prices

Source: OECD (2026[1]), OECD Dashboard on Private Finance Mobilisation.
Note: DFC = US International Development Finance Corporation, BII = British International Investment, DEG = German Investment Corporation, FMO = Dutch Entrepreneurial Development Bank, Norfund = Norwegian Investment Fund for Developing Countries, IFDK = Impact Fund Denmark, OeEB = Development Bank of Austria, BIO Invest = Belgian Investment Company for Developing Countries, FinDev = Development Finance Institute Canada, SIFEM = Swiss Investment Fund for Emerging Markets; CDP = Italian Financial Institution for Development Cooperation, COFIDES = Spanish Development Finance Company, SOFID = Portuguese Development Finance Institution.
Differences in capacity across bilateral and multilateral providers highlight opportunities for greater co-ordination
The data show that bilateral and multilateral development finance providers have different capacities in mobilising private finance. Several factors in the structure of the international development finance architecture explain these differences. For instance, the activities and funding base of multilateral providers are shaped by the contributions that their shareholders, including bilateral DAC and non-DAC providers, make to the multilateral system to ensure that the architecture is able to respond to global development challenges and deliver on its mandate (OECD, 2024[2]). In addition, these multilateral institutions, including global funds and MDBs, have specific in-house technical expertise on the mechanisms and innovative approaches to private finance mobilisation across different contexts. An example is the World Bank’s IFC-MIGA Private Sector Window, which aims to unlock sustainable private sector investments through its Risk Mitigation, MIGA Guarantee, Local Currency and Blended Finance facilities (World Bank, 2017[3]). These factors positively impact the capacity of multilateral actors to mobilise private finance. Bilateral providers, by contrast, tend to operate with a different, more limited funding base and in specific sectors and contexts depending on national priorities and technical expertise. The differences underscore the need and potential for further co-operation between the multilateral and bilateral development co-operation providers to jointly meet the objectives of the mobilisation agenda.
Philanthropic foundations can support private finance mobilisation
Philanthropic foundations are another key category of actors in private finance mobilisation, leveraging their role as intermediaries, investors and grant makers to mobilise additional resources. They can employ diverse financial mechanisms to deploy their philanthropic capital towards their endowment to advance environmental, social and governance goals, including as intermediaries (OECD, 2021[4]). As grant makers and intermediaries, foundations also can support an enabling environment that facilitates responsible investing as well as organisations that connect investors from the private, philanthropic and public sectors (Schroeder et al., 2023[5]).
Evidence shows that philanthropic foundations are already engaging in multistakeholder collaboration and are well positioned to expand their efforts to unlock private capital at scale. They de-risk transactions, increasingly support underfunded priority areas that are critical for development, fund early-stage initiatives, and co-invest with DFIs and MDBs to attract private investment (Convergence, 2025[6]). Although philanthropic contributions cannot match the scale of investment provided by DAC donors and development banks, they nonetheless play a crucial role in mobilising additional resources, addressing funding gaps in priority areas and taking on higher-risk investments that larger institutional actors may avoid.
In a pivotal step, the FFD4 explicitly called on philanthropic actors to step forward not only as funders but also as strategic partners, serving as a bridge between the public and private sectors and helping to unlock sustainable investment at scale (UN, 2025[7]). This created momentum for philanthropic actors to engage in catalytic capital initiatives via public-private-philanthropic partnerships, deepen collaboration, participate in structured dialogue with bilateral and multilateral donors, and recommit to mobilising additional capital in LICs via blended finance (OECD, 2025[8]).
Current leveraging mechanisms
Over 2021-2024, DICs and guarantees were the main leveraging mechanisms, each accounting for 25% of the mobilised finance, followed by syndicated loans (20%), shares in CIVs (15%), credit lines (9%) and simple co-financing (7%).
Credit lines and simple co-financing mobilised the least among leveraging mechanisms, although they offer other opportunities in this area. Credit lines can reach and build capacity in local international finance institutions (IFIs) and support access to finance for SMEs (OECD, 2023[9]), thus allowing these local actors to mobilise domestic private capital (Horrocks et al., 2025[10]).
The data also show that several official providers have strengthened their use of leveraging mechanisms by experimenting with new approaches towards the mobilisation of private capital. These emerging mechanisms include bond issuances specifically designed to attract private capital into their balance sheets as well as extended guarantee programmes and the capitalisation of blended finance funds and facilities (including structured funds).
Focus on guarantee programmes
Guarantees have emerged as one of the most efficient financial instruments from a cost, capital efficiency and mobilisation standpoint considering their high leveraging impact. Private finance mobilised in 2021-2024 via guarantees reached USD 22.4 billion, or almost 30% of the total mobilised private finance. Guarantees have several benefits as a blended finance instrument. They do not require an immediate outflow of funds from donors and are particularly useful for optimising budgets for development while allowing guarantors to leverage their balance sheets more efficiently. In addition, their flexible nature uniquely allows them to mitigate commercial, credit and political risks, and they can bring financial additionality by changing the risk-return profile of investments and alleviating credit restrictions for underserved borrowers (Garbacz, Vilalta and Moller, 2021[11]).
Interest in using guarantees as a risk mitigation instrument to mobilise private finance has increased since 2021. New guarantee institutions like the Green Guarantee Company have been established, and new platforms have emerged to provide and set up innovative guarantee schemes. Several bilateral donors have also established joint guarantee programmes: an example is the Investment Mobilisation Collaboration Alliance, which intends to expand the use of guarantees to mobilise additional private capital (Ministry of Foreign Affairs of Denmark, 2024[12]). Another key step is the recent DAC reform on PSI, aimed at encouraging donors’ participation in and use of this tool (Box 2.2). Climate Investor II, discussed in Box 6 in Chapter 1, also illustrates how joint guarantee programmes can unlock lending to underserved market segments while mobilising additional capital.
However, despite these positive developments and increasing interest, guarantees remain underutilised, in part because of several regulatory constraints. These are particularly prominent in more sensitive and higher-risk environments such as LICs and fragile and conflict-affected contexts (Basile and Neunuebel, 2019[13]). Strict eligibility criteria also restrict their uptake, as some MDBs and DFIs cannot meet these requirements. In addition, evidence suggests that financial regulations such as Basel III and Solvency II may constrain the use of guarantees by influencing how financial institutions assess, value, and apply them, particularly in high-risk markets (Convergence, 2024[14]; OECD, 2025[15]).
These regulatory reforms aim to enhance risk management and transparency across financial institutions, for example Basel III, an international framework for banks introduced after the 2008 financial crisis to strengthen financial stability through higher capital and liquidity requirements, and Solvency II, the EU-wide framework for insurers designed to ensure financial soundness through risk-based capital, governance standards and disclosure obligations (Bank for International Settlements, 2011[85])). Under Basel lll, guarantees can be recognised as risk mitigation instruments only if strict criteria are met; some MDBs and DFIs may not qualify under these rules given factors such as lower credit ratings or specific legal structures.
In a landmark collaboration aimed at enhancing access to finance for Rwanda’s micro, small and medium-sized enterprises, the Swedish International Development Cooperation Agency (Sida) and the Impact Fund Denmark (IFDK, formerly IFU) launched complementary guarantee initiatives targeting local banks. These efforts are designed to unlock capital for underserved sectors, promote inclusive growth and support Rwanda’s green transition.
Approach
Based on a market assessment exercise with the banking sector in Rwanda, Sida and the IFDK selected three banks for potential guarantees to reduce collateral requirements and provide financial institutions with the necessary confidence to reach underserved market segments, thereby lowering the barriers that prevent banks from lending to SMEs.
In 2024, the IFDK’s Development Guarantee Facility issued its first African guarantee to BPR Bank Rwanda covering USD 5.6 million. This guarantee substitutes part of the collateral typically required by banks, which reduced lending risk and enabled BPR Bank to expand its SME loan portfolio. With up to 70% risk coverage, the facility is expected to unlock USD 8 million in additional capital, focusing on green investments and businesses led by women and youth.
Separately, Sida issued guarantees covering USD 3.5 million and USD 7 million, respectively, to I&M Bank and Bank of Kigali in 2023-2024. Both guarantees have the overarching aim to unlock lending to the SME sector and thus increase the sector’s ability to generate employment opportunities. The guarantees have specific focus on women and youth and are expected to unlock USD 5 and USD 10 million of lending. So far, the two guarantees have been successful, with a large portion of loans targeting first-time borrowers (34% of the lending on average) and focused on women (55% of the lending on average).
Sida and the IFDK benefitted from cost-sharing a risk assessment conducted by the Swedish National Debt Office to determine the expected loss and price for the guarantees. The guarantees by Sida and IFDK are further supported by the non-profit organisation Access to Finance Rwanda (AFR) that is part of the broader Financial Sector Deepening Network in Africa. AFR provides technical assistance to banks and clients to ensure effective implementation of the guarantees and impact monitoring. This partnership exemplifies the power of public-private collaboration in addressing structural barriers to finance such as high collateral requirements, which have historically excluded many viable SMEs from formal credit markets.
Outcome
Together, Sida and the IFDK’s guarantee mechanisms are not only unlocking capital but also catalysing systemic change in Rwanda’s financial landscape. By enabling banks to lend more confidently to SMEs, these initiatives are intended to support entrepreneurship, job creation and sustainable development – key pillars of Rwanda’s Vision 2050.
Moreover, the collaboration with Sida has provided the IFDK a newly established guarantee institution along with an invaluable opportunity to deepen its expertise and operational know-how in designing and implementing impactful financial solutions. Through close partnership, the IFDK has benefitted not only from Sida’s technical guidance and rich experience in risk mitigation, but also from a hands-on learning environment that has accelerated its institutional growth and capacity to serve emerging markets. This shared journey has enabled the IFDK to refine its approach, foster innovation and build a strong foundation for future interventions, ultimately enhancing its effectiveness as a catalyst for financial inclusion.
Source: Interviews with Impact Fund Denmark and Sida experts.
Focus on the capitalisation of blended finance funds and facilities
Blended finance funds are a mechanism designed to pool resources, distribute risks and address financing gaps in developing countries. These leveraging mechanisms have been shown to be well-positioned private finance mobilisation instruments both upstream in developed markets, for example when institutional investors invest in structured funds, and downstream through concrete transactions on the ground in EMDEs. While funds can be structured in different ways, for example in a flat structure where all investors share the same risk-return profile (pari passu), structured or layered funds are one that is gaining new attention. Such funds allocate risks and returns differently across different investor classes with the aim to blend development and commercial capital to mobilise additional private finance at both the fund and project level (Basile, Bellesi and Singh, 2020[16]).
Effectively structured funds incorporate layered risk mitigation mechanisms that attract diverse investors, including junior, mezzanine and senior tranches that balance risk and return preferences according to private investor risk-return preferences. Figure 2.5 illustrates the capital structure and operational flow of a typical blended finance fund. Capital is sourced from a diverse number of investors, including senior A-shares (pension funds, insurance companies); mezzanine B-shares (DFIs and mission investors); and junior C-shares (ODA donors and philanthropists), where a technical assistance facility, grants, foreign exchange (FX) facility or guarantee may also be used to further mitigate risks. Managed in-house by an MDB or DFI, or outsourced to a private fund manager, this capital is intermediated through equity loans or other instruments (senior debt, mezzanine debt, guarantees) to target investees, ensuring a dual mandate of both commercial returns and developmental impact goals.

Source: E.T. Jackson & Associates Ltd. (2016[17]), Private Capital for Sustainable Development: Concepts, Issues and Options for Engagement in Impact Investing and Innovative Finance, https://etjackson.com/wp-content/uploads/2019/05/2016_Private_Capital_for_Sustain_Development.pdf.
Note: Technical assistance facilities, which are not part of the capital stack in this figure, also play a critical role. Such assistance can be provided by donors, DFIs, MDBs and some philanthropists. While the structure depicted in this figure reflects cases where sub-commercial terms are needed in junior tranches to attract private capital, in fully commercial structures private investors may also hold the most junior equity-like positions. Similarly, ODA donors may not always be found in the junior tranche but rather in the mezzanine tranche. As such, the composition of each tranche varies depending on the risk-return profile of the investors and the availability of concessional capital.
Addressing infrastructure gaps remains a core development priority in emerging and frontier markets, particularly in sub-Saharan Africa. Mobilising private capital at scale in these contexts has proven challenging, reflecting both structural barriers and investor concerns related to long project horizons, regulatory uncertainty and high levels of perceived risk. In response, the Private Infrastructure Development Group (PIDG) established the Emerging Africa Infrastructure Fund in 2002 as a dedicated blended finance fund to unlock private investment into essential infrastructure. In 2023, the fund expanded its geographic scope to Asia and was renamed the Emerging Africa and Asia Infrastructure Fund (EAAIF).
The EAAIF is an open-ended blended finance debt fund with a simple two-tier capital structure. Donor governments – including Australia, Canada, the Netherlands, Sweden, Switzerland and the United Kingdom – help provide first-loss equity capital, which absorbs early losses and enables senior debt from private investors and DFIs (e.g. Allianz, the AfDB, the German development bank KfW, the FMO and Standard Bank) to be deployed on commercial terms. In 2024, the EAAIF received an A2 Moody’s rating, improving its attractiveness to institutional investors. Notably, over USD 175 million in retained earnings from the equity tranche has been recycled, reinforcing the fund’s financial sustainability.
The EAAIF has demonstrated the potential of structured blended finance funds to mobilise significant volumes of private investment in higher-risk environments. As of 2025, the fund has committed over USD 2.5 billion in long-term debt financing and catalysed more than USD 16.5 billion in additional investment across 115 infrastructure transactions spanning over 20 countries. Investments have supported access to basic services for an estimated 150 million people and generated over 24 000 sustained employment opportunities. The fund’s streamlined capital structure has enabled effective alignment between donor priority areas and private investor requirements, building a replicable model for deploying concessional capital efficiently while maintaining financial discipline and developmental impact.
Source: Technical consultations with PIDG experts; OECD (2025[18]), "The Emerging Africa and Asia Infrastructure Fund", https://www.oecd.org/en/publications/blended-finance-case-studies_2fb90b9a-en/the-emerging-africa-and-asia-infrastructure-fund_ec4efebd-en.html.
Recent evidence suggests that structured funds continue to face challenges in mobilising private finance from institutional investors, who hold the vast majority yet largely untapped pools of global capital. Responses to the OECD Blended Finance Funds and Facilities 2020 survey indicated commercial asset manager and private capital are only making up 6% of total capital in CIVs (Dembele et al., 2022[19]). The DFI Working Group on Blended Concessional Finance for Private Sector Projects Joint Report noted similar findings: 42% of total blended finance deployed by DFIs as of 2021 was allocated to senior debt, the least effective instrument for mobilising private capital, while only 11% was allocated to subordinated debt (AfDB, AsDB, AIIB, EBRD, 2023[20]). To more effectively unlock institutional capital at scale, donors must play a more catalytic role by assuming more subordinated positions in junior traches; deploy more risk mitigation instruments such as guarantees, foreign exchange facilities and capital recycling instruments; and support the creation of investable pipelines that meet institutional investors’ requirements for scale, liquidity and creditworthiness. Strengthening the creditworthiness of underlying assets and portfolios is particularly critical, as institutional investors are highly dependent on credit quality, predictable cash flows and credible risk profiles when allocating capital at scale, making it a critical component of whether structured funds are deemed investable. Efforts should also be made to standardise fund structures and legal documentation to help reduce transaction costs and increase replicability.
The role of PSI in leveraging private finance for development
To leverage the potential of the private sector to shift investments for sustainable development from billions to trillions, donor governments have created PSI vehicles to extend PSI in developing countries. Such PSI vehicles encompass DFIs, expert-managed vehicles and programmes managed by development agencies. PSI include loans to the private sector, equity investments, mezzanine finance instruments, guarantees and reimbursable grants. Since they invest in private sector activities, PSI are key financial instruments for building markets and supporting economic development and welfare in developing countries. These instruments also play a key role in mobilising finance for development projects.
The accounting of PSI in ODA
Prior to the ODA modernisation, most PSI deployed by bilateral DFIs and PSI vehicles other than equities had been out of scope of ODA. In 2016, the DAC adopted principles for integrating PSI in the modernised ODA measure, with provisional methods agreed in 2018. In October 2023, the DAC approved the revised methods for reporting PSI in ODA, hence incentivising support to the private sector of developing countries. The methodological package outlines approaches for ODA accounting by instrument. It also incorporates safeguards to uphold the integrity of ODA along with mechanisms for monitoring and review. A central safeguard for accounting PSI in ODA is the ODA-eligibility assessment of members’ PSI vehicles. Furthermore, additionality is a core ODA-eligibility criterion of PSI.
Additionality, a key safeguard for counting PSI in ODA
For a PSI activity to be ODA eligible, it must be additional financially or in value on top of its development additionality. PSI vehicles using public money to leverage private capital must provide clear evidence of additionality (OECD DAC, 2024[21]). This is the case, for example, for investments that help attract private financiers through de-risking mechanisms or that facilitate the purchase of shares by third parties. OECD DAC (2024[21]) statistics distinguish between three types of additionality – financial additionality, value additionality and development additionality.
A PSI activity conveys:
financial additionality in cases where private sector partners are unable to obtain financing from capital markets (local or international) for a specific activity at the necessary terms and/or scale, or where it mobilises finance from the private sector that would otherwise not have been invested
value additionality in cases where the official sector provides or mobilises, alongside its investment, non-financial value (e.g. board participation or technical assistance) to private sector partners that the capital markets would not offer and that will lead to better development outcomes
development additionality if it is intended to deliver development impact that would not have occurred without the partnership between the official and the private sector.
Financial and value additionality seek to avoid market distortions and are assessed at deal level by PSI vehicles using additionality frameworks, checklists, and country, sector and market models, among other things. Development additionality is generally assessed as part of an impact assessment. The revised reporting methods specify that information reported by DAC members on additionality in the OECD CRS is subject to special scrutiny by the Secretariat.
Source: OECD DAC (2024[21]), Handbook on Private Sectors Instruments: Guidance for Reporting Private Sector Instruments in CRS, https://one.oecd.org/document/DCD/DAC/STAT(2024)15/en/pdf.
The recent call from Publish What You Fund (2024[22]) to harmonise and improve metrics on mobilised private finance has reinforced the need to enhance the measurement and reporting on mobilisation.
In this context, the OECD DAC has implemented a workplan to enhance the current measurement and reporting on mobilisation in its statistics on development finance (OECD DAC, 2024[23]) including through more harmonised metrics on mobilisation. It is also reflecting on emerging approaches for capturing innovative instruments for mobilisation, such as portfolio mobilisation and hedging, as well as on broader baskets of mobilisation such as generation (referring to balance-sheet operations) and catalysation. Importantly, much of the conceptual development and methodological testing of these emerging approaches is being carried out in close collaboration with the MDB community through the joint MDB-OECD DAC Working Group on Mobilisation to avoid early divergences as progress is made across both systems. This collaborative process ensures that early-stage methodological proposals evolve under shared principles and conceptual frameworks across institutions.
Mobilised private finance, as currently defined under DAC statistical standards, remains the core metric and an internationally recognised benchmark grounded in clear causality principles and fair pro-rated attribution, meaning the role played by all official actors involved, including recipient countries’ governments, is considered.
It is important to highlight that the new approaches (portfolio mobilisation and generation and catalysation) remain exploratory and complementary to DAC statistics on mobilised private finance. They are not included in the core mobilisation figures presented in this report and should not be aggregated with these. They are presented to improve understanding of how public finance may support or enable private investment beyond transaction-level mobilisation.
Quantifying these concepts poses several methodological challenges and exploratory work requires continued technical testing, careful methodological development and close consultation with stakeholders to ensure that transparency, conservatism and statistical integrity remain central to the evolution of the mobilisation framework.

Note: In its current exploratory work of the broader types of mobilisation, the OECD does not consider balance-sheet operations and catalysation as covered under the definition of mobilised private finance. Should they be quantified, they would constitute new, complementary indicators that are not to be aggregated with mobilised private finance.
Source: OECD (2025[24]), "Tracking private finance mobilisation: latest trends and ways forward", https://doi.org/10.1787/8d414cdb-en.
Innovative mobilisation approaches: portfolio mobilisation and hedging
Portfolio mobilisation
Portfolio mobilisation can be defined as a separate basket of mobilisation activities covering activities through which the official provider transfers the risk to the private sector actors after the financial closure of the projects (OECD DAC, 2025[25]). This category includes specific types of interventions including investment exits, occurring through debt and equity sales, and risk transfer mechanisms such as securitisation and reinsurance of assets. For instance, in the case of sales or reinsurance of bond assets, classified as investment exits, providers transfer the credit risk from assets they hold in companies or SPVs to the private sector. In doing so, they reduce own account exposure to the extent that they increase portfolio mobilisation (British International Investment, 2024[26]).
Focus on securitisation
Securitisation is the process of turning assets – most commonly loans or bundles of loans – into tradable financial instruments such as securities. This mechanism is often used to generate liquidity or transfer risk by selling the resulting securities to private investors (Capital Adequacy Frameworks Panel, 2022[27]), which, in turn, allows the investors to manage their exposure to address regulatory constraints or adjust their own risk appetite. Through securitisation, a diversified portfolio of underlying assets is converted into securities that can be rated and traded on financial markets, in alignment with various investor risk and return profiles. Investors receive income derived from the cash flows of the original assets, while the originating entity gains access to fresh capital that can then be reinvested into new loans or projects. The use of securitisation has increased in recent years with some multilateral and a few bilateral donors leading the way and using securitisation models to both recycle capital faster and mobilise private capital (OECD, 2025[15]).
The Group of Twenty (G20) Independent Review of the Multilateral Development Banks’ Capital Adequacy Framework encouraged MDBs to use innovative structures, and several MDBs are now responding and considering or actively developing securitisation structures (Capital Adequacy Frameworks Panel, 2022[27]). Through securitisation, DFIs and MDBs can buy credit protection on a specific tranche of their loan portfolios. The resulting reduction in their risk exposure allows them to redeploy a portion of their assets into new investments, increasing their contribution to the SDGs (Eighteen East Capital and The Rockefeller Foundation, 2020[28]). In this regard, securitisation structures can play a key role in building the necessary bridge between the development finance system and capital markets. The building blocks already exist, including existing legal frameworks and financial structuring techniques that can be leveraged.
Nonetheless, the OECD is taking a cautious and evidence-based approach to measuring portfolio mobilisation activities. The OECD conducted an initial data pilot in 2025, collecting examples of such operations reported by a variety of Members, with the objective of better understanding the scale, structure and potential measurement implications of these instruments (OECD DAC, 2025[25]). Building on these initial results, the OECD is considering the possibility of tracking within the DAC framework private finance mobilisation through investment exits (debt or equity), risk transfer through securitisation, and portfolio insurance. Tracking these interventions would support the investment decisions of informed providers and improve transparency around these increasingly used portfolio-level operations. At the same time, any potential expansion of the framework would require careful implementation to ensure that portfolio-level operations remain clearly distinguished from mobilisation at the transaction level. Box 2.4 presents an illustrative example of such portfolio mobilisation operations.
Exit mobilisation context
Exit mobilisation is a key tool for DFIs to transfer investment risk to private investors and free up capital for new projects. This transfer can happen through various mechanisms: it can either be done for a single asset or for pooled assets (such as via funds) and be done across debt or equity investments. Its importance lies in two main aspects. First, exit mobilisation creates capital headroom for DFIs to reinvest. Second, it enables larger-scale mobilisation by aggregating investments into structures that appeal to institutional investors. Most private investors avoid early-stage or small-ticket emerging market deals due to risk and complexity. By exiting matured or pooled investments, DFIs lower the entry barrier for private capital and help build market confidence.
Case study example
In 2024, BII undertook a secondary sale of fund stakes to Blue Earth Capital. This was BII’s first pooled exit and involved the sale of partial stakes in three of its top-performing funds in Africa and Asia. The deal was structured as a pilot to demonstrate the viability of secondaries in emerging markets, where the ecosystem is still developing. BII retained positions in all three funds and continues to sit on their limited partner advisory committees, ensuring alignment and governance continuity.
For Blue Earth, the deal provided immediate exposure to a diversified, high-quality portfolio with known fund managers, reducing risk and increasing predictability. For BII, it unlocked capital to reinvest in new impact opportunities. More broadly, the transaction signals a shift in how DFIs can recycle capital while attracting private investment into emerging markets, helping build a functioning secondary market where very few such transactions exist today.
Source: Publish What You Fund (2024[29]), Crowding In: An Advanced Approach for Measuring and Disclosing Private Capital Mobilisation, Crowding-in-An-advanced-approach-for-measuring-and-disclosing-private-capital-mobilisation.pdf; British Internation Investment (2024[30]), "British International Investment and Blue Earth Capital complete landmark secondary transaction", https://www.bii.co.uk/en/news-insight/news/british-international-investment-and-blue-earth-capital-complete-landmark-secondary-transaction/.
Hedging
In EMDEs, foreign currency risk remains one of the most persistent structural barriers to sustainable development finance. While developing country governments, utilities and SMEs typically generate revenues in local currency, the majority of external financing continues to be denominated in hard currencies such as the US dollar or euro, creating an inherent currency mismatch that exposes borrowers to exchange rate volatility and heightens the risk of financial distress during periods of depreciation (Horrocks et al., 2025[10]). The urgency of addressing this imbalance is growing, with debt-to-gross domestic product (GDP) ratios in key emerging market sovereigns projected to rise by up to 5 percentage points between 2023 and 2030 (Bellesia and Gill, 2024[31]), which will only exacerbate the macro-financial consequences of currency shocks. Yet despite repeated calls to expand local currency solutions, including under Brazil’s G20 presidency, local currency finance has historically remained a marginal component of the development finance agenda, where the bulk of MDB and DFI funding (approximately 80-90%) continues to be provided in foreign currency, leaving borrowers disproportionately exposed to foreign currency risk.
Against this backdrop, hedging mechanisms have emerged as an important blended finance tool for addressing structural currency mismatches. Rather than shifting foreign currency risk onto EMDE borrowers least able to absorb it, hedging reallocates this risk to development finance lenders including MDBs, DFIs and private sector investors with the balance sheet capacity, diversification benefits and technical expertise to manage volatility over time. In doing so, hedging solutions make it possible to expand local currency financing while preserving the hard currency funding models international lenders continue to rely on. Specialised hedging platforms have been created as an innovative solution, offering a pragmatic pathway to expand local currency financing without destabilising domestic markets. Box 2.4 illustrates this approach through the example of the Currency Exchange Fund (TCX), which demonstrates how foreign currency risk can be absorbed, pooled and managed at scale to unlock local currency lending in frontier and emerging markets.
TCX was established in 2007 by a consortium of governments, DFIs, specialised microfinance investment vehicles and donors to centralise and professionally manage currency risk. It provides hedging instruments that convert hard currency lending into local currency obligations for borrowers. This allows international lenders to continue raising funds in hard currency while transferring foreign currency risk away from end-borrowers and to TCX, which absorbs and manages this risk on its own balance sheet.
With a capital base of approximately USD 1.8 billion and a balance sheet of about USD 5 billion, TCX focuses on currencies and maturities where commercial hedging markets are absent or ineffective, ensuring strong additionality and avoiding crowding out domestic providers. Its diversified portfolio across more than 70 countries, combined with prudent risk management, enables TCX to carry roughly USD 5 of gross currency exposure for every USD 1 of capital. The fund offers fixed-rate hedges with maturities of up to 25 years or longer where required and can hedge individual transactions of up to USD 200 million. TCX also progressively transfers portions of its foreign exchange exposure to private investors, helping to crowd in and mobilise private sector participants.
Malawi case study example
Founded in 2018, the company Yellow distributes solar home systems and digital services to rural households in Malawi through a decentralised network of more than 1 000 local agents using a pay-as-you-go model, enabling low-income customers to access energy with small, flexible payments. However, like many early-stage energy access companies, Yellow faced significant balance-sheet risks from US dollar-denominated financing while earning revenues in Malawian kwacha. A USD 2 million investment by Acumen’s Hardest-to-Reach initiative was therefore structured as local currency-indexed financing, with foreign currency risk hedged through TCX. Crucially, TCX’s partnership with the European Commission under its Pricing Facility reduced the cost of hedging by approximately 5% in Malawian kwacha, making the transaction affordable and viable. This intervention enabled Yellow to scale operations sustainably, expand inventory and reach an estimated 182 000 people with energy access, around 145 000 of whom are expected to gain electricity for the first time. Transactions such as this help demonstrate how concessional hedging mechanisms can unlock financially sustainable, locally grounded climate and energy solutions in highly vulnerable markets.
Outcome and Implications
TCX has provided hedging solutions across more than 140 frontier and emerging market currencies, enabling clients to secure over USD 10 billion in local currency financing. Its activities have supported investments across sectors including microfinance, renewable energy, housing and infrastructure and improved debt sustainability and financial resilience for borrowers. TCX also has transferred more than USD 3.5 billion in hedging transactions to private counterparties, demonstrating its role not only as a risk absorber, but also as a market enabler and catalyst for private sector participation in managing foreign currency risk in challenging markets.
Source: OECD (2025[32]), “Case Study: The Currency Exchange Fund”, https://www.oecd.org/en/publications/blended-finance-case-studies_2fb90b9a-en/the-currency-exchange-fund_321fe70e-en.html; TCX Fund (n.d.[33]), TCX - The global solution for local currency (website), https://www.tcxfund.com/; consultations with TCX staff.
Although hedging currently represents a relatively small share of providers’ reported activities, TCX is a valuable example of how hedging instruments can mobilise private finance and support the development of both onshore and offshore capital markets. However, understanding how such tools can be methodologically accounted for in terms of attribution is a complex challenge, especially when multiple actors are involved in one deal. Various approaches exist for measuring the amount of private finance mobilised from hedging – for instance, peak expected exposure estimates, expected depreciation models and capital set-aside methods – a pragmatic path forward should involve further testing through pilots and case studies, allowing providers to assess which approach best balances accuracy, credibility and reporting burden before any inclusion in DAC statistics (OECD DAC, 2026[34]).
Broader baskets of official interventions for unlocking private finance
Generation
Generation is defined as balance-sheet operations through which official institutions may attract additional capital into their budget to be used for specific development activities (OECD DAC, 2026[34]). It covers capital market and non-capital market activities (such as guarantees, bonds, equity investment, carbon credit funding, reinsurance of assets or hybrid capital) that may help enable private investment through balance-sheet operations beyond what is currently captured in DAC mobilisation statistics (OECD DAC, 2025[25]; OECD DAC, 2025[35]). Each of these activities involves private investment in official providers that ultimately improves their balance sheet and allows for greater investment mobilisation, and they represent channels through which private capital may be directed to development activities and areas that could be utilised more to increase overall capital adequacy (Publish What You Fund, 2024[22]). For example, an official provider institution can issue bonds to attract private finance in its balance sheet, which implies that it becomes a borrower and creates a liability in its balance sheet. This increases the provider’s ability to indirectly expand financing options for clients (British International Investment, 2024[26]).
Focus on bond issuance
Bond issuance may help DFIs enable private investment through balance-sheet operations. As such, this type of balance-sheet operation may well be one of the most effective means of private capital mobilisation (OECD, 2023[36]). Bond issuance offers investors the means to contribute to sustainable development and benefit from the unique know-how DFIs have developed over decades.
The growing interest in innovative capital market solutions, including GSSS bonds, reinforces the attractiveness of this model. Since their use of proceeds pursue sustainable, social or environmental goals, these instruments attract a diversified and large investor base that gains reputational advantage by demonstrating a commitment to the SDGs and climate objectives. For instance, by taking advantage of the GSSS bond market, MDBs and DFIs can raise capital effectively and engage with institutional investors that typically are attracted to sustainable bond issuances. Widening the investor base should ultimately result in increased awareness of these instruments and ultimately of GSSS bond issuances generally and in developing countries where local capital mobilisation needs to occur. Still, GSSS bonds are debt instruments at their core, and therefore it is important to consider the debt sustainability of the issuer.
The results of a recent OECD data pilots on generation, which covered balance-sheet operations in the form of equity investments, hybrid capital and bond issuances, confirmed the increasing strategic importance of these types of interventions in expanding the lending capacity of DFIs but also the methodological challenges associated with their measurement, including risks of double counting with existing mobilisation figures (OECD DAC, 2025[25]; OECD DAC, 2025[35]). Based on the data pilots and on discussions within the MDB-OECD DAC Working Group, it was decided that further work on generation should continue on an exploratory basis and clearly distinguished from the OECD DAC data collection on mobilised private finance (OECD DAC, 2026[34]).
Catalysation
Catalysation describes the indirect and downstream private investments enabled by public interventions that seek to create long-term, sustainable improvements in the investment climate of EMDEs (OECD, 2026[37]; OECD DAC, 2026[34]). The OECD working definition, which aligns with the MDB definition, treats catalytic effects as typically occurring within a general three-year window after project completion while allowing for longer horizons in nascent or frontier markets where effects take more time to materialise (OECD, 2026[37]).These types of activities typically include more systemic and upstream interventions that help build robust enabling environments, including policy reforms, as well as institutional capacity building and policy support.
Amid intensifying fiscal pressures and calls for the private sector to contribute more to development and climate finance, building robust enabling environments will be crucial. Catalytic interventions, which can range from regulatory support and policy reform to institutional capacity building and project-level support, play a critical role in building the underlying market conditions needed to attract and sustain private capital.
Catalytic interventions have long played a foundational role in shaping markets and enabling future private investment, yet they remain largely invisible in official development finance statistics, including the OECD DAC statistical framework. This data gap masks the full contribution of development finance actors, particularly in fragile and frontier contexts, and has prompted calls for clearer and more consistent identification and measurement from DAC members, MDBs and transparency advocates such as Publish What You Fund.
However, it is important to underscore that while analytical work is valuable to build a shared understanding of what private finance catalysation refers to, there is broad consensus among the OECD DAC and MDB communities that this concept must remain clearly distinct from mobilisation. Moreover, should it be quantified, catalysation must be presented as a separate indicator. This distinction is essential to maintain the statistical integrity of the core mobilisation metric and to avoid any perception that broader tracking could artificially inflate headline mobilisation figures.
The OECD emerging typology of catalytic interventions
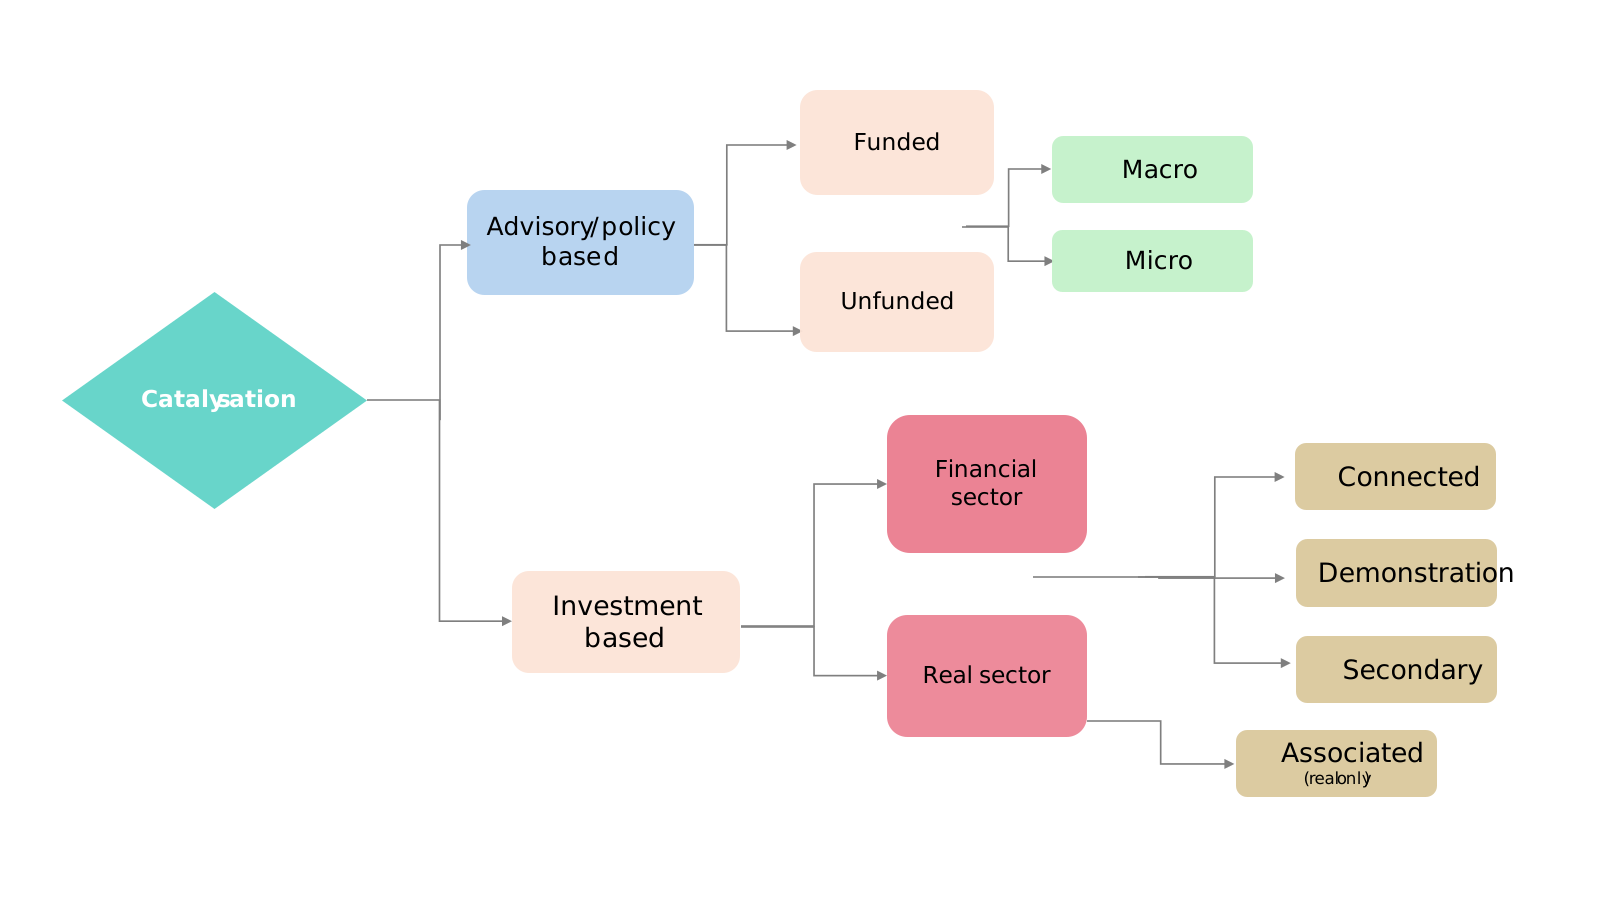
In the absence of a harmonised DAC standard for catalysation, approaches to capturing catalytic interventions will remain fragmented. To address this, the OECD has developed an emerging typology of catalytic interventions that is designed to bring conceptual clarity and enable more consistent identification, classification and tracking of systemic market-shaping efforts (OECD, 2026[37]). To improve consistency in identification and reporting, the Secretariat’s emerging typology organises catalytic interventions into policy-level and project-level categories as well as further sub‑categories that distinguish different catalytic impacts. Box 2.6 and Figure 2.7 elaborate this emerging typology.
Context and challenges
The Amazon biome faces mounting environmental degradation, biodiversity loss and climate vulnerability, while financing for sustainable development in the region remains constrained, particularly in sovereign contexts with elevated credit risk such as Argentina, Brazil and Ecuador. Limited investor appetite and institutional risk exposure have also hindered the flow of capital towards nature-positive and climate-resilient investments in the region.
Approach
To address this financing gap, Sida issued a balance sheet guarantee to the IDB, to risk-share part of IDB’s sovereign country exposure in Argentina, Brazil and Ecuador that covers up to SEK 3.86 billion (Swedish kronor) on a first-loss basis. The guarantee supports IDB’s sovereign exposure in the three target countries and is specifically tied to disbursements for projects that contribute to the protection and sustainable development of the Amazon biome. This risk-sharing mechanism is designed to strengthen IDB’s lending capacity and improve the bankability of nature-focused sovereign investments.
Outcome and implications
The Amazon Guarantee, effective from 2024 to 2046, has successfully mobilised SEK 5.14 billion in capital. The initiative is enabling targeted interventions aimed at reducing greenhouse gas emissions, enhancing the resilience of Amazonian communities and ecosystems, and supporting sustainable value chains in the region. By improving the risk-return profile of sovereign lending, the guarantee is mobilising greater flows of public and private finance towards long-term conservation and regeneration of the Amazon region. This enables increased flows of public and private funds to the protection, conservation and regeneration of the Amazon biome.
Source: Inter-American Development Bank (2024[38]), "IDB and Sweden Sign Guarantee Partnership to Boost Amazonia Forever", https://www.iadb.org/en/news/idb-and-sweden-sign-guarantee-partnership-boost-amazonia-forever; consultations with IDB and Sida experts.
Building on the typology, the OECD conducted a series of case studies in 2025 gathered from development practitioners to test the emerging typology of catalytic interventions (OECD, 2026[37]). These included typical activities undertaken with the intention to improve the enabling investment environment and scale up private finance for sustainable development, among them the IFC and Swiss State Secretariat for Economic Affairs (SECO) Crop Receipts Programme in Ukraine (Box 2.8) and the IDB Social Housing Financing Programme in Ecuador (Box 2.9). The case studies are meant to inform ongoing discussions on the relevance and feasibility of tracking the catalytic effect of public interventions in OECD DAC statistics for the purpose of further recognising and incentivising the broader upstream efforts that are essential to unlocking sustainable private investment in the most challenging markets (OECD, 2025[24]).
The typology classifies the different ways in which public interventions can enable downstream private investment. It comprises the following categories:
advisory and policy-based interventions – a category that captures catalytic effects arising from technical assistance, policy reforms, institutional strengthening and capacity-building activities. This category is further differentiated by:
funded or advisory interventions accompanied by financial support intended to implement or incentivise reforms (e.g. development policy financing, budget support, funded reform programmes)
unfunded interventions including advisory, policy dialogue or technical assistance activities not accompanied by a dedicated financial instrument/investment.
Each of these types of interventions may operate at macro level (economy- or sector-wide reforms) , or micro level (firm-, institution- or project-specific constraints).
investment-based interventions – a category that captures the catalytic effects of investment-based interventions occurring in the financial sector (e.g. using intermediaries or instruments such guarantees, credit lines, equities, etc.) or in real economy sectors (infrastructure, firms, or productive assets) and differentiated according to:
associated – complementary capital expenditures necessary for real sector project viability such as auxiliary infrastructure or connecting assets that would not be undertaken absent the initial supported investment
connected – subsequent phases, tranches or closely linked transactions that can proceed because the initial intervention establishes the financial, operational or risk conditions required for planned follow-on investments
demonstration – copycat or replication effects in which the initial supported transaction provides a verified proof of concept that reduces perceived market risks, thereby prompting comparable investments in the same market, sector or instrument class further downstream
secondary – downstream investments enabled indirectly through intermediaries, structured vehicles or layered financing arrangements channelled via funds, credit lines, risk-sharing facilities or other financial structures beyond the original transaction.
This structure strengthens the analytical logic of the harmonised taxonomy by clearly distinguishing how catalysation arises (advisory vs. investment) and where it operates across macro/micro and financial/real economy levels. It also clarifies how catalytic effects develop downstream through specific catalytic subcategories.
Source: MDB – OECD DAC Working Group.
Source: OECD (2026[37]), Ways forward to pursue exploratory work on Catalysation,
Note: The emerging typology is currently being finetuned to align with the corresponding MDB typology as part of the MDB-OECD DAC Working Group on Mobilisation.
Improving access to finance for agricultural SMEs in Ukraine has long been a structural challenge. Most small farms operate without fixed collateral and are unable to meet traditional bank lending requirements. To address this challenge, the IFC and SECO launched the Crop Receipts Project (2015-2020), an ambitious macro-level advisory and technical assistance initiative aimed at institutionalising a new financing instrument that would allow farmers to use future harvests as collateral.
The concept of crop receipts was integrated into national legislation in 2012; however, its practical implementation was limited. The intervention by the IFC and SECO aimed to unlock this potential through a blend of legal reform, institutional enhancement, and co-ordinated engagement between the public and private sectors. Legal actions included revisions to the crop receipts law, judicial clarifications and regulatory guidance. A central electronic register for crop receipts was established, enhancing transparency and mitigating enforcement risks. Concurrently, extensive public awareness campaigns and targeted training sessions were conducted for farmers, lenders, notaries and government officials to foster trust and build technical capacity regarding the new instrument.
The project was explicitly designed to be catalytic in nature. Instead of co-financing specific transactions, the intervention sought to transform the enabling environment to facilitate large-scale private lending. Initial implementation was cautious, piloted in a single region before being rolled out nationwide. This careful strategy contributed to building institutional legitimacy and addressing initial resistance from financial institutions and agribusinesses. A particularly significant factor in the adoption was the early involvement of large agribusiness firms, which helped establish credibility for the instrument in the market.
Importantly, the programme utilised a thorough ex-ante quantification framework to assess its potential impact. It initially estimated USD 520 million in loans based on crop receipts, but post-implementation monitoring showed that over USD 1.1 billion had been facilitated by the end of the project – more than double the expectations. The number of crop receipts issued (4 707), and farmers reached (4 234) also greatly surpassed targets. These outcomes highlight the significance of legal and institutional foundations for enabling systemic mobilisation of private capital in agriculture. Ukraine’s model has since drawn interest from other countries in Eastern Europe, Asia and Latin America looking to replicate its success.
Source: OECD (2025[24]), "Tracking private finance mobilisation: latest trends and ways forward", https://doi.org/10.1787/8d414cdb-en; technical consultations with IFC staff and practitioners.
Limited long-term mortgage instruments and high financing costs have constrained access to affordable housing in Ecuador. To address this gap, the IDB provided a USD 300 million investment guarantee to support a USD 400 million sovereign social bond issued by the government of Ecuador. The bond proceeds were channelled into a public trust that financed mortgage loans for low- and middle-income households, including women-led families and those in underserved regions.
The guarantee enhanced the bond’s credit quality to investment grade, enabling institutional investors to participate and lowering the cost of capital. This structure mobilised USD 100 million in private investment (the uncovered bond portion) while catalysing an estimated USD 600 million in new mortgage loans through subsequent securitisation. The financing supports approximately 4 560 new housing units, targeting households earning up to one Unified Basic Salary (USD 386 per month).
By demonstrating the viability of capital market-based mortgage finance, the programme is designed not only to mobilise private investment directly but also to catalyse a broader housing finance ecosystem involving local banks, construction firms and investors. The intervention aligns with IDB’s Development Effectiveness Framework and serves as a replicable model for how targeted credit guarantees can unlock both immediate mobilisation and downstream catalytic effects in social sectors.
Interventions such as this highlight how development finance interventions can be designed to achieve both mobilisation and catalysation objectives simultaneously and as complementary rather than sequential outcomes. This dual effect also illustrates how well-structured guarantees can bridge immediate financing gaps while enabling systemic and self-sustaining market development over time.
Source: OECD (2025[24]), "Tracking private finance mobilisation: latest trends and ways forward", https://doi.org/10.1787/8d414cdb-en; technical consultations with IDB staff and practitioners.
Recognising the potential of catalysation
Recognising catalytic interventions is central to understanding the full strategic role of development finance in shaping investable markets and scaling private capital beyond individual transactions. Their potential is increasingly acknowledged in broader international policy debates, including the billions to trillions narrative as well as discussions around the NCQG and the Baku-to-Belém Roadmap, all of which highlight the need for systemic approaches to unlocking private finance at scale. The World Bank and other institutions have also taken steps to better measure and track catalytic efforts, including through the development and introduction in 2025 of a new private capital enabled indicator within the World Bank Group (WBG) Scorecard, defined as “the value of private investments resulting from WBG programs expected to materialize within three years of a project's closure”. (World Bank Group, 2025[39]). Capturing catalysation more effectively also provides a more accurate reflection of a provider’s strategic effort and risk appetite, particularly in contexts where investments are not immediately commercially viable. Mobilising private capital in mature, relatively liquid MICs, such as Brazil or India (where regulatory frameworks and market infrastructure are already established), is far less complex than catalysing investment in fragile or frontier LDCs, where foundational market conditions must first be built. Institutions that engage in this deeper market-building work therefore make a critical, though often less visible, contribution to long-term development outcomes. Thus, the robust recognition of catalytic efforts could have wider implications for the development finance landscape. It could, for example, help in shifting incentives towards upstream market-building activities and strengthening the integration of donors into the broader mobilisation agenda. As such, more accurately capturing these catalytic interventions could help ensure that institutions allocate concessional resources where they are needed most and recognise these institutions not just for mobilisation successes but for more broader systemic impact.
At the same time, measuring and recognising catalysation introduces important methodological challenges. The indirect nature and longer time horizons of catalytic interventions complicate attribution, increase the risk of double counting where multiple actors are involved and raise questions around how to appropriately reflect the role of domestic governments in strengthening enabling environments. These challenges, alongside concerns that premature quantification could create perverse incentives or blur the distinction between measured mobilisation and broader enabling contributions, highlight the need for cautious approaches that ensure that catalytic intervention attributions are neither overstated nor overlooked, while maintaining transparency and consistency across reporting systems (OECD, 2026[37]).
References
[20] AfDB, AsDB, AIIB, EBRD (2023), DFI Working Group on Blended Concessional Finance Projects, Joint Report, March 2023 Update, International Finance Corporation, Washington, DC, https://www.ifc.org/content/dam/ifc/doc/mgrt/2023-03-dfi-bcf-joint-report.pdf.
[16] Basile, I., V. Bellesi and V. Singh (2020), “Blended finance funds and facilities - 2018 survey results, Part II: Development performance”, OECD Development Co-operation Working Papers, No. 67, OECD Publishing, Paris, https://doi.org/10.1787/7c194ce5-en.
[13] Basile, I. and C. Neunuebel (2019), “Blended finance in fragile contexts: Opportunities and risks”, OECD Development Co-operation Working Papers, No. 62, OECD Publishing, Paris, https://doi.org/10.1787/f5e557b2-en.
[31] Bellesia, R. and F. Gill (2024), “Biggest emerging sovereigns have the fastest debt growth”, S&P Global, https://www.spglobal.com/en/research-insights/special-reports/look-forward/biggest-emerging-sovereigns-have-the-fastest-debt-growth.
[30] British International Investment (2024), “British International Investment and Blue Earth Capital complete landmark secondary transaction”, https://www.bii.co.uk/en/news-insight/news/british-international-investment-and-blue-earth-capital-complete-landmark-secondary-transaction/.
[26] British International Investment (2024), Private Capital Mobilisation: Concepts and Definitions, https://assets.bii.co.uk/wp-content/uploads/2024/10/14131132/Private-Capital-Mobilisation-Concepts-and-Definitions.-ITAD-2024.pdf.
[27] Capital Adequacy Frameworks Panel (2022), Boosting MDBs’ Investing Capacity: An Independent Review of Multilateral Development Banks’ Capital Adequacy Frameworks, G20 Research Group, Toronto, https://www.g20.utoronto.ca/biblio/CAF-Review-Report.pdf.
[6] Convergence (2025), State of Blended Finance, Spring 2025, https://www.convergence.finance/resource/state-of-blended-finance-2025/view.
[14] Convergence (2024), State of Blended Finance 2024, https://www.convergence.finance/api/file/5b03d01379f57d9f255ea1852aa5c318:f8966177a0c0ff59a303bf2e9eeef0ac0220f0cd0293c3260fa36f10eef336118e69dbff3fa489f820933d4b32fc0a73ee69747663dc4449397050af3f61437373c4836b612d389ab4a928c796e5f276ae92532d2b198909e34d7.
[19] Dembele, F. et al. (2022), “Blended finance funds and facilities: 2020 survey results”, Working Paper, No. 107, OECD Publishing, Paris, https://www.oecd.org/content/dam/oecd/en/publications/reports/2022/06/blended-finance-funds-and-facilities_05511bbb/fb282f7e-en.pdf.
[17] E.T. Jackson & Associates Ltd. (2016), Evaluation Study: Private Capital for Sustainable Development - Private Capital for Sustainable Development: Concepts, Issues and Options for Engagement in Impact Investing and Innovative Finance, Ministry of Foreign Affairs of Denmark, Copenhagen, https://etjackson.com/wp-content/uploads/2019/05/2016_Private_Capital_for_Sustain_Development.pdf.
[28] Eighteen East Capital and The Rockefeller Foundation (2020), A Sustainable Development Certificates Framework: How Securitization Can Enable DFIs and MDBs to Utilize Capital Markets To Deliver On Their Sustainable Development Objectives, Convergence, Toronto, https://www.convergence.finance/resource/a-sustainable-development-certificates-framework:-how-securitization-can-enable-dfis-and-mdbs-to-utilize-capital-markets-to-deliver-on-their-sustainable-development-objectives/view.
[11] Garbacz, W., D. Vilalta and L. Moller (2021), “The role of guarantees in blended finance”, OECD Development Co-operation Working Papers, No. 97, OECD Publishing, Paris, https://doi.org/10.1787/730e1498-en.
[10] Horrocks, P. et al. (2025), “Unlocking local currency financing in emerging markets and developing economies: What role can donors, development finance institutions and multilateral development banks play?”, OECD Development Co-operation Working Papers, No. 117, OECD Publishing, Paris, https://doi.org/10.1787/bc84fde7-en.
[38] Inter-American Development Bank (2024), “IDB and Sweden Sign Guarantee Partnership to Boost Amazonia Forever”, https://www.iadb.org/en/news/idb-and-sweden-sign-guarantee-partnership-boost-amazonia-forever.
[12] Ministry of Foreign Affairs of Denmark (2024), Market Assessment for Supporting Green Value Chains in Africa, https://um.dk/en/about-us/procurement/contracts/contracts-with-an-estimated-value-up-to-dkk-1064177/contract-opportunities/archive/green-value-chains-in-africa.
[5] Netto, M. and S. Suchodolski (eds.) (2023), Public Development Banks and Philanthropies: No Longer Strangers, Brazilian Center for International Relations (CEBRI), Rio de Janeiro, https://financeincommon.org/sites/default/files/2023-08/Whitepaper_PDBs_ago23_varios.pdf.
[1] OECD (2026), OECD Data Explorer CRS – Private: Mobilised private finance for development, http://data-explorer.oecd.org/s/n2.
[37] OECD (2026), Ways forward to pursue exploratory work on Catalysation, https://one.oecd.org/document/DCD/DAC/STAT(2026)7/en/pdf?sessionId=1771928621722.
[15] OECD (2025), OECD DAC Blended Finance Guidance 2025, Best Practices in Development Co-operation, OECD Publishing, Paris, https://doi.org/10.1787/e4a13d2c-en.
[8] OECD (2025), Statement on Philanthropy’s Strategic Support to the FFD4 Agenda and Beyond, https://www.oecd.org/en/about/news/announcements/2025/06/philanthropys-strategic-support-to-ffd4.html.
[32] OECD (2025), “The Currency Exchange Fund”, Blended Finance Case Studies, OECD Publishing, Paris, https://www.oecd.org/en/publications/blended-finance-case-studies_2fb90b9a-en/the-currency-exchange-fund_321fe70e-en.html.
[18] OECD (2025), “The Emerging Africa and Asia Infrastructure Fund”, Blended Finance Case Studies, OECD Publishing, Paris, https://www.oecd.org/en/publications/blended-finance-case-studies_2fb90b9a-en/the-emerging-africa-and-asia-infrastructure-fund_ec4efebd-en.html.
[24] OECD (2025), Tracking private finance mobilisation: Latest trends and ways forward, OECD Publishing, Paris, https://doi.org/10.1787/8d414cdb-en.
[2] OECD (2024), Multilateral Development Finance 2024, OECD Publishing, Paris, https://doi.org/10.1787/8f1e2b9b-en.
[9] OECD (2023), “Private finance mobilised by official development finance interventions”, OECD Development Perspectives, No. 29, OECD Publishing, Paris, https://doi.org/10.1787/c5fb4a6c-en.
[36] OECD (2023), The Funding Models of Bilateral Development Finance Institutions: A Comparative Analysis of Proparco, FMO and British International Investments, OECD Publishing, Paris, https://www.oecd.org/content/dam/oecd/en/publications/reports/2023/09/the-funding-models-of-bilateral-development-finance-institutions_85c6143b/2ee6960c-en.pdf.
[4] OECD (2021), Private Philanthropy for Development – Second Edition: Data for Action, The Development Dimension, OECD Publishing, Paris, https://doi.org/10.1787/cdf37f1e-en.
[34] OECD DAC (2026), Advancing the WP-STAT Workplan on Mobilisation: package proposal to refine and enhance the current methodology for measuring mobilisation, https://one.oecd.org/document/DCD/DAC/STAT(2026)6/en/pdf.
[35] OECD DAC (2025), Exploring new indicators: Generation, https://one-communities.oecd.org/community/mdb_oecddac/_layouts/15/WopiFrame.aspx?sourcedoc=%7BBD08548D-DC12-4599-BFF4-6A574CCD8344%7D&file=Exploring%20new%20indicators%20Generation.pdf&action=default.
[25] OECD DAC (2025), “DCD/DAC/STAT(2025)22”, in Finetuning and enhancing the measurement and reporting on mobilisation in DAC statistics, OECD Publishing, Paris, https://one.oecd.org/document/DCD/DAC/STAT(2025)22/en/pdf?sessionId=1750067470107.
[21] OECD DAC (2024), “DCD/DAC/STAT(2024)15”, in Handbook on Private Sectors Instruments: Guidance for Reporting Private Sector Instruments in CRS, https://one.oecd.org/document/DCD/DAC/STAT(2024)15/en/pdf.
[23] OECD DAC (2024), WP-STAT workplan to improve the measurement and reporting of mobilised private, https://one.oecd.org/document/DCD/DAC/STAT(2024)33/en/pdf.
[29] Publish What You Fund (2024), Crowding In: An Advanced Approach for Measuring and Disclosing Private Capital Mobilisation, https://www.publishwhatyoufund.org/app/uploads/dlm_uploads/2024/04/Crowding-in-An-advanced-approach-for-measuring-and-disclosing-private-capital-mobilisation.pdf.
[22] Publish What You Fund (2024), What Works: How to Measure and Disclose Private Capital Mobilisation to Increase Private Investment and Close the SDG Financing Gap, https://www.publishwhatyoufund.org/app/uploads/dlm_uploads/2024/10/What-Works.pdf.
[33] TCX Fund (n.d.), TCX - The global solution for local currency (website), https://www.tcxfund.com/.
[7] UN (2025), Sevilla Commitment: Outcome Document adopted at the Fourth International Conference on Financing for Development, United Nations (UN) Department of Economic and Social Affairs, New York, https://financing.desa.un.org/sites/default/files/2025-11/FFD4%20Outcome%20Booklet%20v5_EN_Digital%205.5x8.5.pdf.
[3] World Bank (2017), Operationalizing the IDA18 IFC-MIGA Private Sector Window, https://documents1.worldbank.org/curated/en/928011520447801610/pdf/123995-BR-PUBLIC-IDA-R2017-0347-1.pdf.
[39] World Bank Group (2025), Data: Total private capital enabled, https://scorecard.worldbank.org/en/data/result-details/CSC_RES_PRIV_CAP_ENAB?orgCode=ALL&refareatype=REGION&refareacode=ACW&age=_T&disability=_T&sex=_T.