This chapter provides an overview of Catalonia’s education system. It situates the system within its broader economic and social context, outlining demographic change, migration patterns and socio-economic disparities that shape educational demand and outcomes. The chapter describes the structure and organisation of the system, as well as trends in participation, attainment, learning outcomes and student well-being. It also examines the composition and distribution of the student population, including linguistic diversity and educational support needs, and reviews the role of digitalisation in education. The chapter provides the contextual foundation for the rest of the report, which offers targeted recommendations on equity and inclusion, teachers and school leadership, evaluation and assessment, and governance and funding.
Improving Learning Outcomes in Catalonia, Spain

Abstract
Overview of the school system in Catalonia
The education system of the Autonomous Community of Catalonia in Spain combines high levels of participation across all stages, sustained improvements in attainment and enabling conditions for digitalisation, providing a solid foundation for broad access and system engagement. At the same time, the system faces emerging challenges. Student performance has declined in key areas, equity gaps remain wide across socio-economic and migrant groups, and increasing system complexity is placing pressure on governance and implementation. These trends suggest increasing tensions between access, quality and equity objectives, and highlight the importance of strengthening the system's capacity to support strong and inclusive learning outcomes for all students.
This chapter sets out the overall context of Catalonia’s education system. It analyses:
Economic and social context. Catalonia has a resilient economy and relatively strong labour-market outcomes. However, persistent broader socio-economic inequalities create a dual challenge: aligning education with evolving demographic trends and labour-market demands while strengthening targeted support, inclusion and territorial responsiveness across schools.
Structure and organisation of the school system. Catalonia benefits from a decentralised system with strong regional steering, multilevel governance and a mixed network of providers that shape how responsibilities are distributed and policies implemented. Within this policy eco-system, ensuring coherence, equity and consistent delivery across territories depends on effective co-ordination, regulation and responsiveness to local needs.
Digital technology and education. Strong infrastructure and widespread access provide favourable conditions for digital learning. A key challenge faced by the system is ensuring that digital tools are integrated pedagogically, used responsibly and equitably, and translate into improved learning outcomes rather than reinforcing existing disparities.
Student population and distribution. Growing diversity and uneven socio-economic conditions intensify system complexity. This places pressure on planning and resources, requiring more targeted allocation and stronger implementation.
Performance of the education system. High participation and improving attainment indicate strong retention and progression. However, declining learning outcomes, a growing share of low performers, limited share of top achievers and widening socio-economic gaps point to a misalignment between access, progression and the equitable acquisition of foundational skills.
Overall, the chapter highlights a system that has successfully expanded access and progression but now faces a critical shift towards improving the quality and equity of learning outcomes. It provides the foundation for the rest of the report, which develops targeted recommendations on equity and inclusion (Chapter 3), teachers and school leadership (Chapter 4), evaluation and assessment (Chapter 5), and governance and funding (Chapter 6).
The education system of the Autonomous Community of Catalonia in Spain operates within a context shaped by significant demographic, economic and institutional dynamics. Over the past decade, the system has combined high levels of participation and broad access with increasing diversity in its student population and evolving territorial patterns. At the same time, governance arrangements characterised by decentralisation and shared responsibilities across levels of administration shape how policies are designed and implemented. These aspects create both opportunities for responsiveness and challenges for coherence, particularly as the system seeks to adapt to changing social and economic demands.
This chapter provides a diagnostic overview of the Catalan education system, focussing on key structural aspects, participation trends, learning outcomes and resource allocation. Rather than offering a purely descriptive account, it identifies a set of underlying system-level dynamics that will be explored in greater depth in the following chapters. In particular, it analyses how demographic change, territorial differences and governance arrangements influence the conditions under which the system seeks to deliver equitable and high-quality education outcomes.
Catalonia’s education system operates within a rapidly evolving demographic, economic and social context. Catalonia combines strong economic dynamism, sustained labour-market outcomes, and population growth driven by migration. Within this evolving context, persistent socio-economic inequalities, territorial differences, and increasing linguistic and cultural diversity are reshaping the composition of the student population and the demands placed on schools. These dynamics shape the conditions under which the education system seeks to promote inclusion, equity and quality.
Geography and population characteristics
Catalonia is an autonomous community of Spain located in the northeast of the Iberian Peninsula. It is bordered by France and Andorra to the north, the Mediterranean Sea to the east, and the Spanish communities of Aragon to the west and Valencia to the south. Its surface area of 32 000 km2, represents 6% of Spanish territory. It is administratively divided into four provinces – Barcelona, Girona, Tarragona, and Lleida – and 947 municipalities (Idescat, 2025[1]). Its capital is Barcelona and the official languages are Catalan and Spanish, and Aranese is spoken in the small Aran region at the Pyrenees (Government of Catalonia, 2025[2]).
In 2025, Catalonia had eight million inhabitants, representing approximately 16% of the country’s population (49 million in 2025) (Idescat, 2025[3]). Over the past two decades, Catalonia has experienced major demographic shifts. In 2024, the resident population in Catalonia increased by 111 900 inhabitants, marking the second strongest population increase in the last 15 years, after 2022 (140 140 inhabitants) (Idescat, 2026[4]). It is the second most populous autonomous community, after Andalusia (8.6 million in 2025), and ahead of the Community of Madrid (7 million in 2025) (INE, 2025[5]). Most of the inhabitants live in the province of Barcelona, with a population of approximately 5.9 million residents in 2025 (representing over 60% of the Catalan and 10% of the Spanish population), of which 1.7 million reside in the city of Barcelona (Idescat, 2025[3]; Ajuntament de Barcelona, 2025[6]). In demographic terms, Catalonia is comparable in size to the combined population of Iceland, Latvia, Lithuania, Luxembourg, and Slovenia.
At the same time, in 2024 deaths exceeded births for the seventh consecutive year, continuing a trend that began in 2018 (Idescat, 2026[4]). With the exception of Girona, which recorded positive natural growth, all counties (comarques) and Aran experienced natural population decline in 2024 (Idescat, 2026[4]). Overall population growth is therefore driven almost entirely by immigration (Figure 2.1). In 2024, the migration growth rate reached 15.2%, compared to a natural growth rate of -1.7% (Idescat, 2026[4]). In this context, immigration has become an important driver of Catalonia's demographic renewal and plays a significant role in supporting economic vitality and social development. Future changes in the school-age population will be shaped less by natural growth and more by migration dynamics, with implications for school planning, resource allocation and the provision of language and integration support.
Total crude growth rate, natural increase and net migration, rate per 1 000 inhabitants, 2000-2024

Note: From 2021 onwards, in some cases, total growth does not match the sum of natural population growth and net migration because it includes a statistical adjustment not attributable to demographic phenomena.
Source: Idescat (2026[4]). Population estimates, Births Statistics and Deaths Statistics, https://www.idescat.cat/pub/?id=ep&n=10330&t=202300&col=2&lang=en (accessed on 1 April 2026)
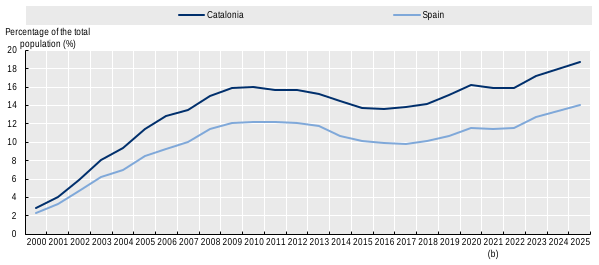
The share of foreign nationals in the population has increased from around 2.5% in 2000 to 18.7% in 2025 (Idescat, 2026[7]). Barcelona particularly has a large international community, with close to 460 000 foreign residents in 2025. This represents a 5.7% increase from previous year and accounting for 26.4% of its inhabitants (Ajuntament de Barcelona, 2025[6]). While similar upward trends are observed across Spain, the scale is more pronounced in Catalonia, reflecting the region’s relative economic dynamism and attractiveness (Figure 2.2). This growing diversity contributes to making Catalonia one of the more diverse regions in Europe and underscores the important role of migration in sustaining demographic and labour-market dynamics. It is also reflected in classrooms, where students bring a wide range of linguistic and cultural backgrounds.
Foreign population as a share of total population in Catalonia and Spain, 2000-2025
Note: (b) Break in time series.
Source: Idescat (2026[7]), Basic indicators of Catalonia: Foreign population as of 1 January 2025. https://www.idescat.cat/indicadors/?id=basics&n=10332&t=202500&col=1&lang=en (accessed on 1 April 2026).
International migration flows are dominated by labour and family migration, particularly from Morocco, Colombia, Peru, Argentina and Honduras (Idescat, 2025[8]). Humanitarian migration also played a role, notably from Ukraine, which registered a positive net balance in 2023 (Idescat, 2025[8]). International net migration is strongly concentrated in the Barcelona metropolitan area, reflecting its role as Catalonia’s main centre of economic activity (Idescat, 2025[8]).
Internal migration patterns also highlight significant mobility. In 2023, one in three internal moves involved people of foreign nationality (32%), despite foreign nationals representing less than one-fifth of the population (Idescat, 2025[8]). At the same time, municipalities with 10 000 to 50 000 inhabitants recorded the highest net inflows, while Barcelona and other large cities experienced substantial outflows (Idescat, 2025[8]). This pattern is consistent with post-pandemic mobility trends and housing affordability pressures. For the education system, these dynamics suggest increasing territorial redistribution of students, with implications for school capacity, planning of provision and the continuity of student learning trajectories.
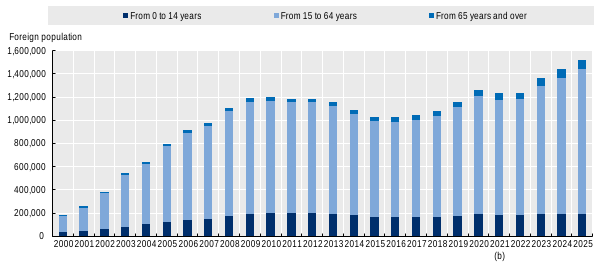
In terms of age structures, low birth rates have led to a contraction of the population aged 0 to 15, whose share declined from 16.8% in 2015 to 14.4% in 2025 (Idescat, 2026[4]). Over the same period, the working-age population (aged 16 to 64) had a slight increase by around 1 percentage point, reaching 65.9% in 2025 (Idescat, 2026[4]). This increase is partially explained by the growing presence of foreign nationals of working age, whose numbers have increased almost eight-fold since 2000 (Figure 2.3) (Idescat, 2026[7]). In parallel, population ageing has increased the share of adults aged 65 and over, reaching 19.7% in 2025 (compared to 18.3% in 2015), with notable territorial variation (Idescat, 2026[4]). In this context of low fertility and population ageing, migration plays a key role in sustaining the active population and enabling generational renewal.
The implications for the school-age population are analysed in more detail later in the section on student population and distribution. Overall, these trends point to a dual challenge: managing declining cohorts in some areas while responding to growing and more diverse student populations in others.
Foreign population by age group in Catalonia, 2000-2025
Note: (b) Break in time series.
Source: Idescat (2026[7]), Basic Indicators of Catalonia: Foreign population as of 1 January 2025, https://www.idescat.cat/indicadors/?id=basics&n=10332&t=202500&col=1&lang=en (accessed on 1 April 2026).
Economy
The Catalan economy shows resilience despite economic uncertainties. With a GDP above EUR 300 billion in 2024, Catalonia accounts for about 19% of national GDP (EUR 1 590 billion in 2024), and is the second-largest regional economy after the Community of Madrid (19.8% of national GDP) (INE, 2026[9]). Economic activity is highly concentrated in the province of Barcelona, which alone generates a substantial share of regional output (INE, 2026[9]; Ajuntament de Barcelona, 2024[10];. At the same time, GDP per capita varies significantly across territories, pointing to uneven economic development within the region (Idescat, 2025[11]). These territorial disparities may be associated with differences in local resources, opportunities and educational conditions.
Over the past two decades, Catalonia has transitioned towards a service-oriented economy, while maintaining a comparatively strong industrial base. In 2024, services accounted for around 75% of gross value added followed by industry (19%) (Idescat, 2025[12]). In 2023, within the service sector, wholesale trade generated the highest turnover (EUR 128 335 million) and the highest added value, with retail trade sector ranking second in terms of turnover (EUR 51 563 million) (Idescat, 2025[13]). In 2025, all sectors recorded positive growth, with particularly strong expansion in construction (+5.3%) and agriculture (+7.2%), while industry (+1.8%) and services (+3%) continued to grow at more moderate rates (Idescat, 2026[14]). This structure creates a diverse demand for skills, ranging from lower-skilled service roles to more specialised technical and professional occupations.
The Catalan economy has a strong presence of small and medium-sized enterprises (SMEs). SMEs account for the vast majority of firms and employ a substantial share of the workforce. In 2024, 99.9% of firms had fewer than 250 employees, of which 94.1% had no salaried employees or were micro-enterprises with fewer than 10 employees (Idescat, 2026[15]). The dominance of SMEs reflects broader national trends but is particularly relevant in Catalonia given the breadth of sectors in which these firms operate. From an education perspective, this business structure creates sustained demand for workers across a wide range of skill levels and tends to increase the importance of flexible pathways between education, training and employment.
The economy’s service orientation is closely reflected in employment patterns. In 2025, services employed nearly 2.9 million people, around 75% of total employment, across more than 540 000 firms, with wholesale and retail trade among the largest employers (Idescat, 2026[16]). Service activities are highly diverse, spanning lower-paid and labour-intensive sectors such as hospitality, trade and care, as well as more knowledge-intensive professional, scientific, administrative and digital activities. Employment growth has been stronger in retail trade, transport and storage, information and communications, and administrative and auxiliary services (Idescat, 2026[16]). This suggests that the education system must support both rapid labour market entry and the development of stronger transversal, technical and digital skills.
Industry remains strategically important despite employing a smaller share of the workforce. In 2025, industrial activities employed around 663 000 workers, representing 17% of total employment, and generated more than EUR 41 billion in gross value added at factor cost (Idescat, 2025[17]). Apparent productivity per worker in industry was substantially higher than in services in 2025, reinforcing its importance for regional competitiveness and income levels (Idescat, 2025[13]; Idescat, 2025[17]). Catalan industry is also diverse and internationally oriented: in 2023, food products, chemical industries, and the production and distribution of electricity and gas were among the main contributors to turn over and exports, and around one third of industrial sales were directed to foreign markets, predominantly in the European Union (Idescat, 2025[17]).
This combination of labour-intensive services, SME dominance and relatively productive industry points to a dual challenge for the education system: supporting broad employability across a wide skills spectrum, while also sustaining the more specialised competences needed for productivity, innovation and international competitiveness.
Labour market
Labour-market outcomes are relatively favourable compared to national averages. In 2025, the employment rate of adults aged 20 to 64 years old stood at 76.4%, in line with EU-27 average (75.8% in 2024) and above national average (71.4% in 2024) (Idescat, 2026[18]). Since the economic recession of 2008-09, employment rates have now exceeded pre-recession levels, with a growth of 11.8 percentage points between 2013-2024 (Figure 2.4) (Idescat, 2026[18]). The gender gap in employment, measured as the difference between the employment rates of men and women aged 20-64, is also comparatively low with regards to both national (9.8%) and EU-27 (10%) averages, standing at 8.5% in 2024 (Idescat, 2026[19]). Nevertheless, women tend to display a higher share of part-time work arrangements (12.7 percentage points higher) and temporary contracts (4 percentage points higher) in 2024 (Idescat, 2026[19]).
In 2025, the unemployment rate stood at 8.4%, below the national average (10.5%) and among the lowest across autonomous communities, and comparable to Castile and León (8.6%), Galicia (8.4%) and Madrid (8%) (INE, 2026[20]). Unemployment has declined steadily since the 2008-09 recession, with a difference of 14.2 percentage points between 2012-2024 (Figure 2.4) (Idescat, 2026[21]). Long-term unemployment has also followed similar downwards trends, from 12.2% in 2013 to 2.6% in 2025 (Idescat, 2026[22]). As elsewhere in Spain, unemployment disproportionately affects individuals with lower levels of education and skills. These patterns highlight the important role that education and training systems can play in supporting labour market inclusion, particularly by strengthening foundational skills and providing effective pathways for individuals with lower qualifications (OECD, 2011[23]).
Employment and unemployment rate in Catalonia and Spain, 2009-2025

Source: Idescat (2026[18]), European Union indicators: Employment rate, https://www.idescat.cat/indicadors/?id=ue&n=10111&lang=en#Plegable=text; Idescat (2026[21]), European Union indicators: Unemployment rate, https://www.idescat.cat/indicadors/?id=ue&n=10114&t=202500&lang=en (accessed on 1 April 2026).
In 2025, more than half of young people aged 16-29 years old were employed (52.4%), a figure higher than the national average (44.2%), representing an increase of 8.8 percentage points since 2020 (Figure 2.5) (Idescat, 2026[24]). Over the same period, the share of 18-24-year-olds neither in employment nor in education and training (NEET) stood at 10.6% in 2025, a sharp decrease from 18.2% NEET rate of 2020 (Figure 2.5) (Idescat, 2026[25]). At the same time, the gender gap in NEET rate in 2025 was just 0.4 in favour of men (Idescat, 2026[25]). The Catalan share remains below the national average (12%) and EU-27 average (11%) for 2024 (Idescat, 2026[25]). While these trends point to improving transitions into the labour market, their sustainability will depend on the extent to which education pathways remain aligned with evolving labour market needs and provide access to stable employment opportunities.
Employment rate of 16-29 year-olds and NEET rate of 18-24 year-olds in Catalonia and Spain, 2009-2025

Source: Idescat (2026[24]), Statistical Yearbook of Catalonia: Relationship with the activity of the population from 16 to 29 years of age, https://www.idescat.cat/indicadors/?id=aec&n=17501&col=4&lang=en; Idescat (2026[25]), European Union indicators: Young people neither in employment nor in education and training (NEET), https://www.idescat.cat/indicadors/?id=ue&n=14431&col=3&lang=en (accessed on 1 April 2026).
Household living standards are also relatively high: in 2025 average net annual household income reached around EUR 43 890, significantly above the national average (EUR 38 990) and lower than Madrid (EUR 47 380), Basque Country (EUR 46 540), Navarre (EUR 46 140) and Balearic Islands (EUR 44 460) (INE, 2026[26]). The average consumption expenditure of Catalan households amounted to around EUR 37 410 per household (Idescat, 2025[27]). However, marked socio-economic gradients persist. This indicates that economic growth does not translate evenly into living standards, with implications for inequalities in educational opportunities and outcomes. Households in which the main breadwinner had higher education recorded substantially higher expenditure levels (+13.8%) than those where the highest qualification was primary education or below (-25.2%) (Idescat, 2025[27]). Housing-related costs represent the largest single expenditure category, accounting for 34% of total household spending, reflecting mounting affordability pressures (Idescat, 2025[27]).
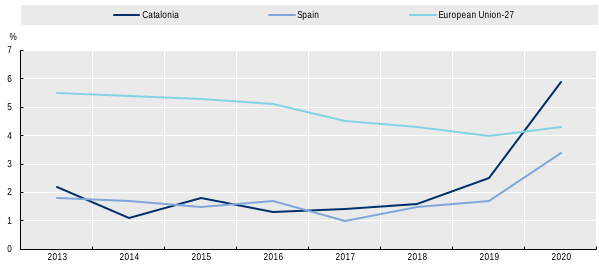
These dynamics coincide with rising levels of severe housing deprivation in Catalonia, from less than 1.5% in 2016 to almost 6% in 2020, above both national and EU averages (Figure 2.6) (Idescat, 2020[28]). Housing constraints increasingly shape residential mobility and have direct implications for education, particularly by affecting school continuity, concentration of disadvantage and equitable access to learning opportunities.
Severe housing deprivation rate, 2013-2020
Note: Estimated value for European Union-27.
Source: Idescat (2020[28]), EU Sustainable Development Goal indicators for Catalonia: Severe housing deprivation rate by poverty status, https://www.idescat.cat/indicadors/?id=ods&n=16162&col=3&lang=en (accessed on 1 April 2026)
Socio-economic vulnerabilities
Despite relatively strong average labour and income levels, income inequality and socio-economic vulnerability remain widespread. Income distribution indicators point to persistent distributional disparities. In 2025, the Gini index stood at 29.1 for Catalonia, down from the peak observed in 2014 (33) and stable compared to previous year (Idescat, 2026[29]). The income quintile share ratio (S80/S20) indicates that the top 20% of Catalan households accumulated 4.7 times what the 20% of the most disadvantaged households earned in 2025 (Idescat, 2026[29]). Although below the COVID-19 pandemic peak (6 times in 2020), this figure suggests enduring distributional gaps (Idescat, 2026[29]).
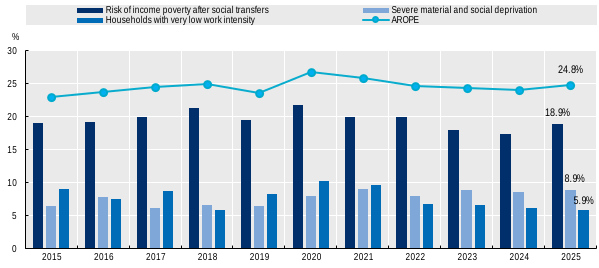
Socio-economic vulnerability remains substantial. In 2025, almost one-quarter (24.8%) of the Catalan population was at risk of poverty or social exclusion (AROPE) (Idescat, 2026[30]). Although broadly stable in recent years and below the pandemic peak in 2020 (26.7%), this rate remains above pre-pandemic levels (23.6% in 2019) and above the EU-27 average (21% in 2024) while slightly below the national average (25.8% in 2024) (Idescat, 2026[30]).
A more disaggregated view of the AROPE indicators highlights the underlying drivers of vulnerability (Figure 2.7). In 2025, 18.9% of the population was at risk of income poverty after social transfers, 8.9% experienced severe material and social deprivation, and 5.9% lived in households with very low work intensity (Idescat, 2026[31]). Income poverty remains the dominant component of overall vulnerability and, despite a slight increase in 2025, has declined from its COVID-19 pandemic peak (21.7% in 2020) (Idescat, 2026[32]). In contrast, severe material and social deprivation has not returned to pre-pandemic levels, pointing to more persistent forms of hardship (Idescat, 2026[33]). Since 2022, its prevalence has exceeded consistently that of households with very low work intensity, reversing earlier patterns (Idescat, 2026[34]; Idescat, 2026[33]). This suggests direct implications for access to educational resources and learning conditions. Meanwhile, the share of households with very low work intensity has declined since 2020, possibly reflecting improved labour market participation (Idescat, 2026[34]).
People at risk of poverty or social exclusion (AROPE rate) and its components, 2015-2025
Source: Idescat (2026[35]), People at risk of poverty or social exclusion, https://www.idescat.cat/indicadors/?id=ods&n=13472&col=3&lang=en; Idescat (2026[32]), People at risk of income poverty after social transfers, https://www.idescat.cat/indicadors/?id=ods&n=13473&col=3&lang=en; Idescat (2026[33]), People suffering from severe material and social deprivation, https://www.idescat.cat/indicadors/?id=ods&n=14980&lang=en; Idescat (2026[34]), People living in households with very low work intensity, https://www.idescat.cat/indicadors/?id=ods&n=13475&lang=en (accessed on 1 April 2026).
Material hardship and social constraints continue to affect a sizeable share of households. In 2025, more than one-third (35.5%) of the population reported being unable to cover unforeseen expenses of around EUR 900, almost half (47.3%) reported challenges in making ends meet, and around one in six (16.5%) experienced difficulties in keeping homes adequately warm (Idescat, 2026[31]). These constraints shape household stability and living conditions in ways that are directly relevant for children’s educational participation and well-being.
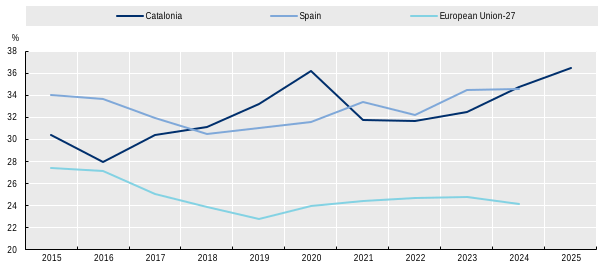
Risks are unevenly distributed across population groups, with children particularly affected. In 2025, more than one in three children under 18 lived in households facing poverty or social exclusion (36.5%), the highest share since 2021 (31.8%) and higher than the COVID-19 pandemic peak (36.2%) (Figure 2.8) (Idescat, 2026[35]). The Catalan AROPE rate for children in 2025 exceeded both the EU-27 average (24.2% in 2024) and the Spanish average (34.6% in 2024) (Idescat, 2026[35]).
The sustained exposure to socio-economic vulnerability among children is likely to have important implications for learning, well-being and broader education outcomes. Child poverty and household income are typically associated with unequal access to early learning opportunities, lower cognitive and schooling outcomes and greater risks of disengagement (OECD, 2025[36]; Cooper and Stewart, 2020[37]; Thévenon et al., 2018[38]). Widespread socio-economic vulnerabilities increase the demand for targeted supports, inclusive school practices and stronger links between education and social services, particularly in schools serving disadvantaged neighbourhoods (OECD, 2025[36]; Thévenon et al., 2018[38]).
Population under 18 at risk of poverty or social exclusion (AROPE rate), 2015-2025
Note: Break in time series for the European Union (EU-27) in 2020.
Source: Idescat (2026[35]), People at risk of poverty or social exclusion, https://www.idescat.cat/indicadors/?id=ods&n=13472&lang=en (accessed on 1 April 2026).
Catalonia’s school system combines strong regional steering with a multilevel governance framework, and a diversified network of education providers. While aligned with the overall structure of the Spanish education system, it is shaped by the region’s autonomy in planning, regulation and implementation. Responsibilities are distributed across levels of government, with increasing emphasis on co-ordination and responsiveness to local contexts.
A multilevel governance framework
As one of the 17 autonomous communities of Spain, Catalonia enjoys a high degree of self-governance within the framework of the Spanish Constitution of 1978 and with the devolved powers set out by the Catalan Statute of Autonomy (Estatut), revised in 2006 (Parliament of Catalonia, 2006[39]; BOE, 1978[40]; BOE, 1978[40]). It maintains a distinct cultural, social and linguistic identity. The Regional Government of Catalonia (Generalitat de Catalunya, henceforth the Generalitat) comprises the Parliament, the Presidency and the Government, operating alongside local municipalities and within the wider legal framework of Spain and the European Union.
Within this framework, the Generalitat exercises legislative and executive responsibilities across a wide range of public policy areas, including education, social services, health, culture, language policy, and social cohesion. This multilevel framework combines national standard-setting with strong regional steering and local implementation. In practice, this requires effective co-ordination mechanisms to ensure that national frameworks, regional priorities and local implementation are aligned and mutually reinforcing.
At the state level, Article 27 of the Spanish Constitution (1978) establishes the right to education as a fundamental right, the exercise of which is compulsory and free of charge in basic education (Art. 27.1 and 27.4) (BOE, 1978[40]). It further defines the purpose of education as “the full development of the human character with due respect for the democratic principles of coexistence and for the basic rights and freedoms” (Art. 27.2) (BOE, 1978[40]). Within this constitutional framework, the State administration, through the Spanish Ministry of Education, is responsible for the general organisation of the education system, including the establishment of minimum requirements for qualifications, the recognition of foreign credentials, and the co-ordination of national education policies such as scholarships and grants, as well as for the co-ordination of research and innovation strategies at national level.
Within these parameters, the Generalitat holds primary responsibility for non-university education. As set out in the Catalan Statute of Autonomy (2006), under Art.21 and 131, the Generalitat regulates, plans and organises the education system, including the creation, modification and closure of schools, the programming of educational provision across the territory and the definition of curricular frameworks within its competences (Parliament of Catalonia, 2006[39]). It establishes criteria for student admission and steers the balanced distribution of students, particularly those with specific educational support needs (SESN). It is also responsible for inspection, internal evaluation, quality assurance and educational innovation. The Generalitat manages the public teaching workforce, including recruitment, professional development, employment conditions and remuneration (Parliament of Catalonia, 2006[39]). Financing responsibilities include funding public schools and publicly-subsidised private schools through the concerted system, as well as overseeing educational support services and inclusive education measures (Chapter 3 and Chapter 6). This concentration of responsibilities at regional level provides the Generalitat with substantial steering capacity but also places strong demands on governance arrangements to ensure consistent implementation across territories and providers.
Local governments play a complementary role, as set out in Article 84 of the Statute of Autonomy (Parliament of Catalonia, 2006[39]). Their responsibilities include the provision and management of early childhood education, school planning and enrolment at the local level, and the maintenance of public schools outside teaching hours (Parliament of Catalonia, 2006[39]). They are also responsible for organising key school services such as transport and canteens and contribute to the setting of school calendars. In some cases, governance is shared through joint arrangements with the Catalan administration, reflecting an approach that combines regional steering with local implementation. An example is the Education Consortium of Barcelona, jointly managed by the City Council and the Department of Education and Vocational Training of the Generalitat, which is responsible for the day-to-day management of the education system in the city (Barcelona Education Consortium, 2023[41]). In addition, many municipalities operate local schooling offices that support families during the pre-enrolment process. The effectiveness of these arrangements depends on the capacity of local actors and the strength of co-ordination with regional authorities, particularly in areas such as school planning, admissions and equity-oriented measures.
Linguistic model
The Catalan linguistic model is grounded in a consolidated legal and institutional framework that combines constitutional guarantees with specific regional legislation. At the national level, the Spanish Constitution recognises Castilian (Spanish) as the official language of the State, grants co-official status to other Spanish languages in their respective territories, and establishes the duty to protect Spain’s linguistic diversity (Art. 3), alongside the right to education (Art. 27) (BOE, 1978[40]). In Catalonia, this framework is developed through the 2006 Statute of Autonomy, Law 1/1998 on language policy, Law 12/2009 on education (LEC), Decree Law 6/2022 on school linguistic projects, and Law 8/2022 on the use and learning of official languages in non-university education1 (DOGC, 1998[42]; Parliament of Catalonia, 2006[39]; BOE, 2009[43]; DOGC, 2022[44]; DOGC, 2022[45]).
Within this framework, Catalan is established as the main language for teaching and learning in the education system (Art. 6 of the Statute of Autonomy) and students have the right to receive an education in this language (Art.35) (Parliament of Catalonia, 2006[39]). In the Vall d’Aran, Aranese is the language of instruction. At the same time, the system is expected to guarantee that all students acquire sufficient oral and written proficiency in both Catalan and Castilian (Spanish) by the end of compulsory education, with both languages represented in the curriculum (Art. 35) (Parliament of Catalonia, 2006[39]).
Catalonia’s education model is organised around principles of non-segregation, linguistic cohesion and equity. The framework explicitly prohibits the separation of students by spoken language at home or language of habitual use, with schooling conceived as a shared space for social integration and equal opportunity (Parliament of Catalonia, 2006[39]). This model reflects broader sociolinguistic conditions in Catalonia and needs to be understood in that context, where exposure to and use of the two official languages differ across social and territorial settings and are associated with broader objectives of social integration.
While competence in Spanish is nearly universal and its social presence is extensive, the use and exposure to Catalan are more unevenly distributed and are often associated with socio-economic and cultural background. As a result, students who do not use Catalan at home, particularly those from more disadvantaged backgrounds, may have fewer opportunities to acquire and practice it outside school. In this context, schooling is expected to play a compensatory role: by ensuring exposure to Catalan within a common learning environment, the system seeks to limit the risk that linguistic inequalities reinforce broader social and educational disparities.
Within this context, linguistic diversity is considered a structural characteristic of the population. This is also reflected in the student population, including students of immigrant background with a wide range of linguistic profiles and varying degrees of linguistic proximity or distance to Catalan and Spanish (Figure 2.14), for instance, shows foreign students’ region of origin, which serves as an imperfect but informative proxy for likely linguistic distance). Administrative data from the 2023 Survey on Language Uses of the Population show that Catalonia’s population aged 15 and over is linguistically diverse in both origin and everyday use. These distinctions are important for interpreting the role of language in education, as linguistic diversity interacts with other factors – such as socio-economic background, migration and prior educational experiences – in shaping students’ learning conditions.
Spanish remains the most common first language (49%), followed by Catalan (29%), while 6% report both as their first language (Idescat, 2025[46]). However, patterns differ for language use: a lower share report Spanish as their habitual language (47%) compared to first language, while the share reporting Catalan as habitual language (33%) is slightly higher than for first language (Idescat, 2025[46]). Notably, sizeable shares of the population report bilingual or multilingual repertoires, including combinations of Catalan, Spanish and other languages.
However, this category encompasses different situations. For native-born students, it largely refers to Spanish-speaking students educated in a system where Catalan is the main language of instruction. For students with an immigrant background, it reflects a much wider range of linguistic profiles, with varying degrees of proximity or distance from Catalan and Spanish. The same survey also points to differences in levels of competence across the two official languages. Competence in Spanish was nearly universal in 2023, 93% of the population reported understanding Catalan and 80% reported being able to speak it (Idescat, 2023[47]). Written proficiency in Catalan was also comparatively lower, with 66% reporting being able to write the language, compared with 94% for Spanish in 2023 (Idescat, 2023[47]).
Furthermore, the system includes targeted linguistic support structures for students who enter the system at later stages, notably through reception classrooms and other linguistic support measures (Chapter 3). These measures reflect both linguistic policy objectives and broader principles of educational inclusion and equity.
Education planning and financing
The Education Law of Catalonia (Law 12/2009) defines the Education Service of Catalonia as comprising public schools and publicly-subsidised private schools and places educational programming at the centre of system governance (DOGC, 2009[48]). Programming is framed as the key instrument for guaranteeing the right to education, promoting social cohesion and ensuring equality of access. It seeks to balance parental choice and freedom to establish schools with equity objectives, notably through the balanced distribution of students with specific educational support needs (SESN). It also connects planning decisions to system financing and the organisation of educational stages. As such, planning functions not only as a technical exercise, but as a central governance instrument through which equity, resource allocation and system organisation are aligned.
These principles are operationalised through secondary legislation. In particular, Decree 11/2021 on the programming of educational provision and admission procedures regulates educational offer planning and introduces mechanisms to ensure a more equitable distribution of students across publicly funded schools (DOGC, 2021[49]). These measures are supported by the Pact against School Segregation (PSEC), established in 2019, which commits the Generalitat, municipalities and educational stakeholders to reducing socio-economic and immigrant segregation across schools (Catalan Ombudsman, 2019[50]) (see Chapter 3 for an in-depth analysis of the implementation of the Pact and impact on school composition). The effectiveness of these instruments depends on consistent implementation across territories and providers, particularly given the complexity of co-ordinating admissions, planning and equity measures in a mixed school network.
Within this governance architecture, Catalonia’s inclusive education model is grounded in Decree 150/2017, which establishes mainstream schooling as the default setting for all students (DOGC, 2017[51]). The Decree defines attention to diversity through a tiered framework of universal, additional and intensive measures designed to respond to varying educational needs. However, it should be noted that the Decree was introduced without an accompanying financial memorandum and therefore without the dedicated resources required for its implementation. Available evidence suggests that the financial and human resources mobilised for implementation may not yet fully match the scope and ambitions of the reform, constraining its implementation capacity of the decree (KSNET, 2023[52]; Catalan Ombudsman, 2025[53]) (see Chapters 3 and 5).
The Generalitat is the main funder of school education, covering teacher salaries in public and concerted schools, operational costs, infrastructure investment and educational agreements (Parliament of Catalonia, 2006[39]). Local governments play a limited financial role, mainly in early childhood education and school maintenance. The Spanish State contributes primarily through scholarships and targeted programmes. In practice, this means that funding decisions are closely intertwined with governance arrangements, particularly through staffing allocations and targeted programmes, which then shape how resources are experienced at school level (Chapter 6).
Recent policy developments point towards a gradual shift to more place-based governance, with the introduction of pilot educational governance zones from the 2025/26 school year (OECD/Department of Education and Vocational Training, unpublished[54]). These aim to strengthen co-responsibility between the Generalitat and municipalities, improve co-ordination of resources, and enable more tailored responses to local needs. Their effectiveness will depend on the clarity of roles, the availability of local capacity and the extent to which they are integrated into existing governance and funding arrangements.
These governance and planning arrangements are reflected in the system’s current strategic priorities, which provide an overarching direction for policy development and implementation (Box 2.1).
Building on the Departmental Action Plan for 2024–2028, current education priorities include:
To improve the academic results of students and achieve educational excellence. This priority responds to a sustained decline in results over the last decade and the need to strengthen basic competencies (notably reading and mathematics), supported by stronger evaluation capacity and international collaboration (such as the current partnership with OECD) and renewed system-level assessment tools;
Progressively achieve the universal and free provision of early childhood education. While compulsory education remains central, the Plan frames Catalonia’s system as covering the full 0–18 (and beyond) continuum, with a strong push toward universality in 0–3 and expanded pathways to support continuity in upper secondary, especially Baccalaureate and VET, as well as adult learning. Emphasis is put on quality, territorial equity, collaboration with municipalities, and a stable legal and financing framework;
Strengthen educational equity and reduce early school leaving. Key directions include addressing segregation, revising school “complexity” classification to align funding with needs, improving guidance during transitions between stages, and progressively expanding support measures to reduce barriers to participation;
Strengthen vocational training (VET) with an accessible, dual offer that is integrated with the productive fabric. It includes expanding places, modernising access and enrolment procedures, improving guidance, supporting mobility, and aligning provision with labour-market needs, including the green and digital transitions and rural access;
To achieve oral and written proficiency in Catalan, Spanish and Aranese language in Aran, and to promote and improve skills in English and other foreign languages. Language priorities are linked to evidence of weaknesses in reading comprehension, reinforcing literacy, school libraries, multilingual immersion approaches, and strengthened foreign-language support (including conversation assistants and teacher capacity);
Promote the teaching career. Measures include reforming the teaching profession and career structure, strengthening pedagogical leadership, improving initial and continuous training (including agreements with universities), enhancing working conditions, and reducing administrative burdens;
Promote lifelong learning and generate new educational opportunities to prevent the risk of poverty and social exclusion. The plan emphasises flexible pathways and “new opportunities” provision—particularly for young people (15–21) at risk of disengagement, as well as stronger adult education capacity and recognition of competences;
Promote a new model of educational governance, deploying educational zones, with co-responsibility with the local world. Co-governance with municipalities, expanding educational zones and community-based “education at full time” approaches, alongside clearer frameworks for local planning and implementation;
To ensure the learning opportunities and well-being of all students. Priorities include advancing inclusive education (and extending relevant provisions to additional stages), strengthening tutorial/personalised support, reinforcing safe-school approaches (violence prevention), mental health and emotional well-being, orientation services, and responsible digitalisation (including attention to risks linked to technology and AI);
Progressively equalise the schooling conditions of the Education Service of Catalonia. The plan stresses reducing disparities across publicly funded provision (public and publicly subsidised private), improving fairness in resources and support (including for vulnerable and newly arrived students), and strengthening transparency and administrative processes.
Source: Department of Education and Vocational Training (2025[55]), Pla d’acció departamental 2024-2028 [Departmental Action Plan 2024-2028], https://educacio.gencat.cat/web/.content/home/departament/linies-estrategiques/pla-departamental/pla-accio-educacio-fp.pdf; OECD/Department of Education and Vocational Training (unpublished[54]), Responses to OECD background questionnaire «A multi-year project to improve learning outcomes in Catalonia», internal document.
Structure
Catalonia follows the overall structure of Spain’s education system while exercising autonomy in its regulation and implementation (Table 2.1) (DOGC, 2009[48]). Schooling is virtually universal from ages 3 to 5 and compulsory from ages 6 to 16 (Department of Education and Vocational Training, 2021[56]). Provision for the 0 to 3 age group remains non-universal, although policy directions indicate a commitment to developing and expanding this model over time. This structure provides a broad and diversified set of pathways, but also raises questions about transitions between stages and the alignment between different educational tracks.
International Standard Classification of Education (ISCED 2011) and Catalan education system
Note: This is a simplified structure.
Source: Department of Education and Vocational Training (2026[57]), Tria educativa [Educational choice], https://triaeducativa.gencat.cat/ca/inici/index.html (accessed on 1 April 2026).
Early childhood education and care
Early childhood education and care (ECEC) is non-compulsory and organised in two three-year cycles. The first cycle (Educació infantil de primer cicle) covers children between 0 and 3 years old and corresponds to an International Standard Classification of Education (ISCED) level of 01 (Department of Education and Vocational Training, 2026[58]). This first cycle, being non-compulsory, is generally not free. Private childcare centres charge families fees, with each of them free to set its price. Most public nurseries are owned by the municipalities, which also determine the fee that families pay and the reductions and exemptions that they contemplate. Starting from the 2023/2024 school year, there has been a progressive incorporation of first-cycle education into free education, with public nursery schools offering free schooling for two-years olds in pre-school education (Department of Education and Vocational Training, 2025[59]). The second cycle (Educació infantil de segon cicle) covers children between 3 and 6 years old and corresponds to ISCED level 02 (Department of Education and Vocational Training, 2026[60]). Provision of this second cycle is free of charge. Admission to both cycles of ECEC is the responsibility of the Catalan education authorities.
Compulsory primary and secondary education
Compulsory education in Catalonia comprises ten years of free and compulsory schooling, including primary education and compulsory secondary education, including basic vocational education and training (VET). Primary education (Educació primària) spans six years from ages 6 to 12, corresponding to ISCED 1 (Department of Education and Vocational Training, 2026[61]). It is followed by four years of compulsory secondary education (Educació Secundària Obligatòria, ESO), for students aged 12 to 16 and which is organised in two cycles: the first three years of ESO (ages 12-15) correspond to ISCED level 2 while the fourth year (ages 15-16) corresponds to ISCED level 3 (Department of Education and Vocational Training, 2026[62]). ESO provides a comprehensive common curriculum designed to ensure that all students acquire the key competences required for further learning, employment and active citizenship. Successful completion leads to the award of the ESO graduate certificate (Graduat en Educació Secundària Obligatòria), which is the key qualification for progression to post-compulsory education. Ensuring that all students successfully acquire these competences remains a central challenge, particularly in the context of increasing diversity and socio-economic disparities.
Vocational training (VET) basic level (Cicles Formatius de Grau Bàsic, CFGB) complements primary and secondary education within the framework of compulsory education (Department of Education and Vocational Training, 2026[63]). It is aimed at students aged 15 to 17 who have completed the third year of ESO (or, exceptionally, the second year) and are recommended by the teaching team. CFGB programmes have a duration of two academic years and are designed for students who are particularly motivated by professional learning and who may benefit from acquiring ESO competences in a more vocationally oriented environment. Successful completion leads to both the Basic Technician qualification and the ESO graduate certificate.
General upper secondary education and vocational pathways
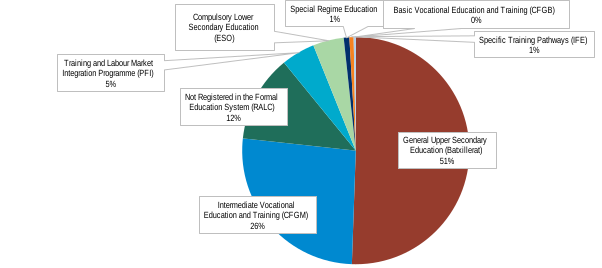
From age 16 onwards, Catalan students can choose among different non-compulsory academic and vocational pathways designed to respond to different student profiles, interests and labour-market needs (Figure 2.9).
General upper secondary education (Batxillerat, i.e. Baccalaureate) is a two-year academic programme of thirty teaching hours per week, corresponding to ISCED level 3 (Department of Education and Vocational Training, 2026[64]). It is usually completed between the ages of 16 and 18, although it is open to people of any age, either in person or remotely through the Institut Obert de Catalunya (IOC). It is designed to prepare students both for university and for professional pathways (Department of Education and Vocational Training, 2026[64]). It offers four tracks: arts (visual arts, image and design, and music and performing arts); sciences and technology; general; and humanities and social sciences (Department of Education and Vocational Training, 2026[64]).
Catalan VET is organised by professional families covering a broad range of sectors, including industry, health, ICT, hospitality and tourism, commerce, arts and design, sports, energy, maritime studies and social services (Department of Education and Vocational Training, 2026[65]). It is offered at two main levels, each of them lasting two academic years (2 000 hours). The first, the intermediate-level cycles (Cicles Formatius de Grau Mitjà, CFGM), corresponds to ISCED 3, requires the ESO graduate certificate or equivalent for its access and its completion leads to the qualification of Technician (Department of Education and Vocational Training, 2026[66]). The second, the higher-level cycles (Cicles Formatius de Grau Superior, CFGS), corresponds to ISCED 5, requires the Batxillerat or equivalent for its access and leads to the qualification of Higher Technician, with direct access to university and possible ECTS recognition (Department of Education and Vocational Training, 2026[67]). All cycles combine school-based learning with compulsory workplace training. In addition, specialisation courses (Cursos d'especialització), lasting between 300 and 720 hours, allow graduates of intermediate or higher VET to deepen expertise in strategic areas (Department of Education and Vocational Training, 2026[68]).
Enrolment rates for students after 4th year of ESO, school year 2024-2025
Note: In the Catalan education system, the fourth year of ESO (Educació Secundària Obligatòria) is classified as ISCED level 3, as it marks the transition to upper secondary education. The first three years of ESO correspond to ISCED level 2 (lower secondary education).
Source: OECD/Department of Education and Vocational Training (unpublished[54]), Responses to OECD background questionnaire «A multi-year project to improve learning outcomes in Catalonia», internal document.
For young people who have not completed compulsory secondary education (ESO), several pathways are nonetheless available. Programes de Formació i Inserció (PFI) is a one-year programmes (1 000 hours) for young people aged 16-21 which combine vocational modules, general education and workplace training (Department of Education and Vocational Training, 2026[69]). Completion allows access to intermediate VET and adult education to obtain the ESO qualification. Itineraris Formatius Específics (IFE) is a specialised vocational programme for students aged 16-20 with special educational needs associated with mild or moderate intellectual disabilities (Department of Education and Vocational Training, 2026[70]). They focus on autonomy, employability and social inclusion. These pathways play an important role in preventing early disengagement, although their effectiveness depends on accessibility, quality of provision and successful transitions to further education or employment.
Recent policy developments have placed increasing emphasis on expanding vocational provision across basic (CFGB), intermediate (CFGM) and higher levels (CFGS), while also strengthening specific training pathways (IFE) and insertion programmes (PFI) as tools to prevent early disengagement and support continuity in education among students at risk of leaving the system prematurely (DOGC, 2025[71]). The expansion and diversification of VET pathways reflects broader efforts to align education provision with labour market needs and improve retention for students with diverse educational profiles.
Tertiary education
Entry to university is based on completion of upper secondary education and a general university entrance examination (commonly referred to as the PAU (Proves d'Accés a la Universita)) (Department of Education and Vocational Training, 2026[72]). In line with the European Higher Education Area (EHEA), university education is structured into three cycles: bachelor's degree, master's degree, and doctoral studies (Department of Education and Vocational Training, 2026[72]).
Organisation
Families may choose between three types of educational centres: public schools, which are publicly funded; publicly-subsidised private schools (concertada), and private schools, which get no public funding and are supported by student fees. Only the first two are part of the publicly funded Education Service of Catalonia. A small number of schools separate boys and girls in class, and these schools do not receive public funding.
The Catalan school network is extensive, with around 4 000 early childhood education and care centres and primary education schools (Idescat, 2025[73]). Among these, around two-thirds are public (2 733 schools for the 2023/2024 school year) and one-third are private (1 200 schools) (Idescat, 2025[73]). In 2023/2024, around 260 000 children were enrolled in ECEC, of whom around 69% attended public schools (178 500 students) and 31% attended private schools (81 130 students) (Idescat, 2025[74]). At the primary level, in 2024-2025 enrolment stood at 452 000 students, with similar proportion as ECEC of around 68% attending public schools (307 660 students) while 32% attending private schools (144 350 students) (Idescat, 2025[75]). Students with specific educational support needs (SESN) are, in principle, educated in mainstream schools. Special education centres continue to operate for a small proportion of students requiring highly intensive support (about 8 230 for the 2023/2024 school year) (Idescat, 2025[76]). The coexistence of public and publicly subsidised private schools is a defining aspect of the system, and which raises important considerations for governance, funding and equity in the distribution of students and resources (Chapter 3 and Chapter 6).
The school week runs from Monday to Friday at all educational levels, with around 25 hours of instruction per week in primary education and about 30 hours in secondary education (OECD/Department of Education and Vocational Training, unpublished[54]). Schools have some autonomy in organising the school day, including the option, particularly in secondary education, to concentrate teaching hours in the morning (so-called “intensive working day”) (OECD/Department of Education and Vocational Training, unpublished[54]). The organisation of school time has been the subject of sustained public and policy debate, reflecting concerns about learning conditions, student well-being, equity in access to extracurricular activities and the growing role of private tutoring, with implications for equity, student well-being and access to learning opportunities beyond the school day (Chapter 3 and Chapter 6).
School leadership is organised through management teams whose composition varies by school type and level. School principals are appointed through a merit-based competitive process that requires the presentation of a management project and are appointed for renewable four-year terms, subject to external evaluation. Catalonia employs around 90 000 public-sector teachers and approximately 37 000 teachers in private schools (OECD/Department of Education and Vocational Training, unpublished[54]). The workforce is predominantly female and relatively ageing, reflecting historical recruitment patterns. Recent policy efforts have focussed on stabilising the workforce, addressing shortages in specific subject areas and supporting teacher well-being (OECD/Department of Education and Vocational Training, unpublished[54]). These features of the workforce have implications for system capacity, including the ability to respond to emerging challenges, support innovation and ensure continuity of teaching quality across schools.
Digitalisation is reshaping the skills that education systems are expected to develop, while also transforming how teaching and learning take place (OECD, 2026[77]). In Catalonia, digital technologies, including the rapid expansion of artificial intelligence (AI), bring both opportunities to enhance learning and risks of amplifying existing disparities in outcomes. While digital technologies can improve quality, inclusiveness and efficiency, their impact depends on how they are integrated into pedagogy (OECD, 2026[77]; OECD, 2025[78]). This makes the pedagogical integration of digital tools an important dimension of system performance.
A highly digitalised region
Catalonia’s high level of digitalisation provides favourable conditions for the use of technology in education, both in terms of infrastructure and population-wide digital engagement. Catalonia is a highly digitalised region within Spain, with widespread access to information and communication technologies (ICT). Administrative data indicate that almost all households had internet access (98.5%) in 2025, compared to 81% in 2015 (Idescat, 2026[79]). Digital device ownership is nearly universal. In 2025, 99.6% of households had a mobile phone, 87% had a computer, and 55% had a tablet (Idescat, 2026[79]). These conditions reduce some of the basic access barriers that constrain digital learning in other contexts.
Internet use among the population is similarly widespread. Administrative survey data for 2025 found that 98% of people aged 16-74 had used internet in the three months prior to the survey and 97% have used it regularly (at least once a week) (Idescat, 2026[79]). These data represent an increase compared to 2024 of 0.8 and 0.4 points, respectively (Idescat, 2026[79]). Internet use among children is also high and increasing, with the share of 10- to 15-year-olds using the internet rising from 94% in 2024 to 97% in 2025 (Idescat, 2026[80]). This broad digital engagement creates a favourable context for school digitalisation, while also increasing expectations that education systems will equip students to use digital technologies critically and effectively.
Catalan youths and adults demonstrate strong ICT skill use across several domains. In 2025, 80% of people aged 16–74 reported using at least one computer-related skill, slightly above the Spanish average (78%), with particularly high levels among young people aged 16–24 (96% in Catalonia versus 94.5% in Spain) (Idescat, 2026[81]). These skills include tasks such as installing software, managing files across devices or cloud storage, creating presentations and using spreadsheet formulas. This suggests that the wider population is increasingly familiar with functional digital tasks, which may support the uptake of digital services and tools in education.
Digital public services are also widely used in Catalonia. In 2025, over eight out of ten people aged 16 to 74 in Catalonia (83%) contacted or interacted with public authorities or public services through a website or app, above the Spanish average of 81% (INE, 2025[82]). This places Catalonia among the higher-performing regions in terms of e-government use, although slightly below the highest level observed in the Community of Madrid (86%) (INE, 2025[82]). The most common types of interaction involve accessing information (67%) and consulting personal information stored by public administrations (57%) (INE, 2025[82]).
The strong diffusion of digital technologies is reflected in the rapid expansion of the ICT sector. In 2024, the ICT sector employed 140 450 people, representing a 5.3% increase compared to the previous year and almost double the level recorded in 2014 (78 940 employees) (Idescat, 2026[83]). This growth highlights the increasing importance of digital activities in Catalonia’s economy and reinforces demand for digital skills across the labour market. For education systems, this reinforces the importance of digital skills not only as tools for learning, but also as a growing component of labour market preparation.
Digital technologies for teaching and learning purposes
In response to the growing importance of digital skills and concerns about how effectively the education system was preparing students for an increasingly digital society, Catalonia implemented the Digital Education Plan (Pla d’Educació Digital de Catalunya, PEDC) for the period 2020-2023. The plan was grounded on the recognition that digital competence – defined as “the creative, critical and safe use of digital technologies for learning, work, leisure, inclusion and participation in society” – is a key skill for 21st century citizens (Department of Education and Vocational Training, 2020[84]). The PEDC therefore responded both to a skills agenda and to concerns about uneven school capacity to support digital learning.
At the time the plan was designed, the evidence base on students’ digital skills was limited and no large-scale national evaluation had been conducted to measure these skills directly (Ivàlua, 2022[85]). Nonetheless, the plan was motivated by concerns that students were not consistently acquiring sufficient digital competences by the end of compulsory education and that inequalities persisted, related in part to differences in infrastructure, teacher preparedness and school-level capacity (Ivàlua, 2022[85]). This increased the importance of implementation monitoring and evaluation.
The plan therefore sought to address these challenges through a comprehensive strategy combining investments in infrastructure, teacher training and pedagogical innovation. Implementation results show substantial progress. Teacher participation in digital training increased substantially, with over 35% of teachers in public schools receiving additional digital training in 2022–23, compared to 16% the previous year (Ivàlua, 2025[86]). As a result of these efforts, around 90% of teachers have reached at least an A2 level of digital competence in 2025 (OECD/Department of Education and Vocational Training, unpublished[54]). These results point to substantial implementation progress in capacity-building and school-level planning.
Schools were supported in developing a Digital School Strategy (Estratègia Digital de Centre) to guide the pedagogical use of technology and adapt digitalisation to local needs. By 2023/2024, around 3 340 schools had completed their digital strategy (Ivàlua, 2025[86]). More than 220 digital mentors were deployed to support schools in implementing these strategies and integrating technology into teaching practices, with over 94% of schools reporting that mentoring played a key role in strategy development (Ivàlua, 2025[86]). This school-level planning approach creates space to adapt digitalisation to local contexts.
Investments in digital infrastructure and equipment have been significant. Between 2021/2022 and 2022/2023, nearly 500 000 electronic devices have been distributed in public schools to students from 5th grade of primary school to 4th grade of secondary education (ESO) (Ivàlua, 2025[86]). This measure contributed to near-universal access to digital devices for learning in public schools. Connectivity was modernised to ensure that all public schools have access to high-speed fibre-optic internet and Wi-Fi networks, and classrooms are equipped with interactive digital screens and audiovisual equipment to support teaching and learning. The Department of Education and Vocational Training also made possible for students who lack internet connectivity at home to borrow portable connectivity devices (MiFi) to ensure equitable participation in digital learning (OECD/Department of Education and Vocational Training, unpublished[54]). These measures appear to have helped reduce access barriers in public schools and establish the material conditions for more widespread digital learning.
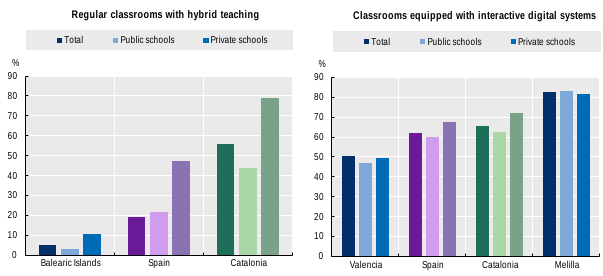
Administrative data suggest that digital technologies are now widely available in classrooms and increasingly integrated into school organisation (Figure 2.10). In 2022/2023, 65.4% of classrooms in Catalonia were equipped with interactive digital systems, such as interactive whiteboards, projectors, or digital panels, compared to 62% across Spain on average (MEFPD, 2025[87]). Within Catalonia, the availability of these digital systems is higher in private schools (72%) than in public schools (63%) (MEFPD, 2025[87]).
Catalonia leads Spain in terms of readiness for hybrid teaching: 56% of classrooms allow hybrid instruction, compared to 29% on average in Spain (Figure 2.10) (MEFPD, 2025[87]). In public schools the share reaches 44% (double the Spanish average, 22%) and 70% in private schools (47% in Spain) (MEFPD, 2025[87]). Access to digital devices for teaching and learning is also comparatively strong, with an average of 1.7 students per computer, compared to 2.2 at the national level for the 2022/2023 school year (MEFPD, 2025[87]). These indicators suggest that Catalonia has moved beyond basic connectivity challenges and now performs relatively strongly in terms of digital readiness within the Spanish context.
Share of regular classrooms with hybrid teaching and classrooms equipped with interactive digital systems (IDS), school year 2022/2023, Catalonia, Spain, highest and lowest value across autonomous communities
Note: This includes general non-tertiary education. Early childhood education and special education centres are excluded.
Source: MEFPD (2025[87]), Sistema estatal de indicadores de la educación 2025 [National System of Education Indicators 2025], https://www.educacionfpydeportes.gob.es/dam/jcr:d2b43f52-a91a-4923-aae4-0eb10f35a3a2/seie-2025.pdf.
Furthermore, the use of digital devices varies across education levels. In secondary education (ESO), more than 60% of students reported high or very high use of digital devices (Ivàlua, 2025[86]). This figure is substantially higher than in primary education, where the use of digital devices was instead only minor, less than one in four students reporting similarly intensive use (Ivàlua, 2025[86]). This pattern partly reflects pedagogical choices to introduce digital technologies progressively at younger ages. It also suggests that digital integration is not uniform across stages, but reflects both developmental considerations and pedagogical choices about when and how to introduce technology.
Despite these advances, evidence suggests that access and use do not always translate into effective learning. The 2025 Ivàlua evaluation identifies persistent socio-economic gaps in digital use and indicates that some uses of technology offer limited pedagogical value or may reduce students’ attention and active participation (2025[86]). These findings suggest that policy attention may increasingly need to focus not only on expanding provision but also on improving the quality and equity of digital use.
International evidence confirms these patterns. While Catalan students in secondary education perform relatively well in digital competence according to the International Computer and Information Literacy Study (ICILS) 2023 assessment, significant disparities remain by socio-economic background, gender and school sector (Fraillon and Rožman, 2025[88]). Girls outperform boys (531 points compared with 505), students in private schools achieve higher scores than those in public schools (542 versus 505), and the performance gap between advantaged and disadvantaged students reaches 77 points, indicating the continued influence of socio-economic factors on learning outcomes (Fraillon and Rožman, 2025[88]). These findings suggest that, even in a relatively well-equipped system, differences in digital competence remain associated with socio-economic background and school sector.
The growing use of digital technologies in schools has also sparked a broader policy debate about how these tools should be integrated into teaching and learning. Recent evaluations of the use of digital devices in schools suggest that their educational impact depends strongly on the way they are used pedagogically (Ivàlua, 2025[89]). Teachers in Catalonia report that digital technologies can support student motivation, collaborative learning and personalised instruction when integrated within well-defined pedagogical frameworks (Ivàlua, 2025[89]). At the same time, intensive or poorly regulated use may lead to distractions or negative effects on reading comprehension and written expression (Ivàlua, 2025[89]). This reinforces the idea that the educational value of digitalisation lies less in the presence of devices than in the quality of pedagogical integration and the capacity to regulate use appropriately.
In response to these concerns, the Department of Education and Vocational Training has introduced several measures aimed at promoting responsible digitalisation in schools by balancing the development of students’ digital competences with safeguards for learning and well-being (Department of Education and Vocational Training, 2025[90]). Measures include clearer guidance on classroom use, initiatives to promote responsible device use among students and families, including the awareness campaign “Less screen, more life” (Menys pantalla, més vida), and a new regulation banning the use of mobile phones in compulsory education (Department of Education and Vocational Training, 2025[90]; 2025[91]). These measures suggest a shift from expansion-focussed digital policy towards a more balanced approach that combines digital competence development with safeguards for learning and well-being.
Overall, Catalonia benefits from strong enabling conditions for digital learning, with widespread access and sustained investments under the Digital Education Plan. These efforts have supported significant progress in infrastructure, access and the diffusion of digital practices across schools. However, differences in pedagogical use, persistent socio-economic gaps and uneven classroom practices suggest that access alone is not sufficient to ensure effective outcomes. Looking ahead, policy efforts may increasingly need to focus on strengthening the quality, coherence and equity of digital use, alongside maintaining access and infrastructure (Chapter 4).
The size and composition of Catalonia’s student population have evolved in line with demographic change, sustained migration and increasing social diversity. These trends have altered enrolment patterns across levels and intensified linguistic, socio-economic and educational support needs within schools, with implications for planning, resource allocation and the organisation of support across the system.
In the 2023/2024 school year, Catalonia had around 1 703 220 students across all education levels (from early childhood to university) (Idescat, 2025[92]). Of these, around 259 640 were enrolled in early childhood education (15.2%), 452 000 in primary education (26.5%), 676 460 in secondary education (39.7%), 8 230 in special education (0.5%), and 306 880 in university (18%) (Idescat, 2025[92]).
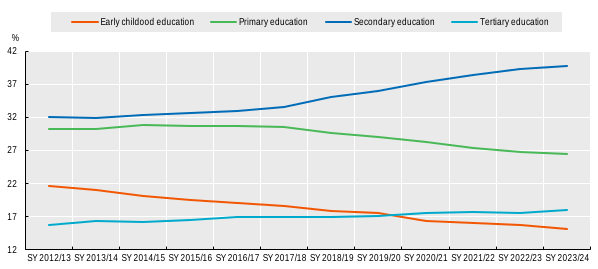
Since the 2012/2013 school year, total enrolment across the education system (from early childhood to university) has increased by around 12%, from 1.53 million to 1.7 million students in 2023/2024, largely reflecting migration-driven population growth (Idescat, 2025[92]). However, this expansion has been uneven across levels (Figure 2.11). Persistently low birth rates have translated into falling enrolment in the early years of schooling: between 2012/2013 and 2023/2024, the share of students in early childhood education fell from 22% to 15% of total enrolment, while primary education declined from 30% to 27% (Idescat, 2025[92]). By contrast, secondary education expanded from 32% to 40% of total enrolment, while university enrolment increased more moderately and special education remained broadly stable (Idescat, 2025[92]). This suggests that the system is simultaneously managing contraction in the early years and expansion in later stages, creating different planning pressures across levels.
Enrolment rates for early childhood education, primary, secondary and tertiary education, 2012/2013 through 2023/2024
Note: Secondary education includes the students of the Programs for Initial Professional Qualification (PIPQ).
Source: Idescat (2025[92]), Statistical Yearbook of Catalonia: Students and teachers. By education levels, https://www.idescat.cat/indicadors/?id=aec&n=15712&lang=en (accessed on 1 April 2026).
The expansion of secondary education reflects both the demographic progression of larger cohorts into upper grades and higher retention beyond compulsory schooling, alongside the expansion of vocational pathways. Indeed, between the 2012/2013 and the 2023/2024 school year, lower secondary education grew from 285 460 students to 346 500 (+21%), while enrolment in upper secondary education (general and vocational combined2) increased from 194 780 students to 321 840 (+65%), indicating higher retention after age 16 (Idescat, 2014[93]; Idescat, 2025[94]). Within upper secondary education, vocational programmes have driven most of this expansion. Enrolment in vocational pathways has more than doubled over the period (+106%), while general academic upper secondary education has grown only modestly (+15%) (Idescat, 2014[93]; Idescat, 2025[94]).
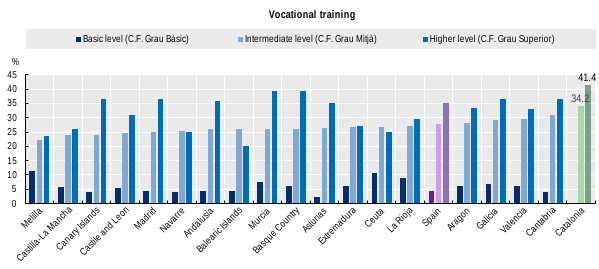
As a result, the post-compulsory system has become increasingly vocational in profile in Catalonia. Catalonia also shows comparatively strong outcomes in vocational pathways relative to other autonomous communities in terms of graduation (Figure 2.12) (MEFPD, 2025[87]). The increasing weight of post-compulsory and vocational pathways also points to a system in which retention beyond age 16 has improved, but where the composition of upper secondary education is changing in ways that may have implications for guidance, provision and labour-market alignment.
Graduation rate in vocational training cycles, school year 2022/2023
Source: MEFPD (2025[87]), Sistema estatal de indicadores de la educación 2025 [National System of Education Indicators 2025], https://www.libreria.educacion.gob.es/libro/sistema-estatal-de-indicadores-de-la-educacion-2025_185897/ (accessed on 1 April 2026).
Students with specific educational support needs (SESN)
Beyond overall enrolment trends, the internal composition of the Catalan student population has shifted significantly. A growing share of students are formally recognised as having specific educational support needs (SESN), reflecting both increasing student diversity and expanded identification practices. This reflects not only increasing diversity in student needs, but also a broader recognition of educational vulnerability within the system.
In the 2024/2025 school year, around 366 060 students were formally recognised as having SESN, of whom approximately 98% were enrolled in ordinary schools (OECD/Department of Education and Vocational Training, unpublished[54]). Only a small and stable proportion of students (7 670 in 2024-25), representing less than 1% of total non-university enrolment, attend specialised special education centres, underscoring the structurally inclusive orientation of the Catalan system (OECD/Department of Education and Vocational Training, unpublished[54]). This indicates that inclusion in Catalonia is primarily organised within mainstream settings, placing growing demands on ordinary schools to respond effectively to a wider range of needs.
While system-level inclusion is high, the proportion of students with recognised SESN has increased substantially in mainstream primary and compulsory secondary education in recent years (see Chapter 3 for detailed trend analysis and breakdown by type of need). However, this upward trend appears to be driven primarily by the increased identification of needs and recognition of new dimensions of educational vulnerability, rather than by demographic growth, as overall enrolment declined slightly during this period. In practice, this means that rising recognition of need may increase pressure on support structures and resource allocation even in the absence of overall enrolment growth.
Immigrant background
Alongside the growing recognition of educational support needs, broader demographic and migration trends have also transformed the composition of the student population. In the 2023/2024 school year, around 225 000 students were of foreign nationality, representing approximately 16% of total enrolment in non-university education in Catalonia (Idescat, 2025[95]). Higher shares of foreign students were registered in public schools than private centres (Idescat, 2025[95]). The Barcelona metropolitan area alone hosted nearly one-third of the total foreign student population (72 630), followed by Vallès Occidental (22 640), albeit showing a substantially smaller share (Figure 2.13) (Idescat, 2025[95]). This confirms that migration is not only a broader demographic feature of Catalonia, but also a central dimension of the composition of its school population.
The 10 Catalan counties with the highest numbers of foreign students, school year 2023/2024
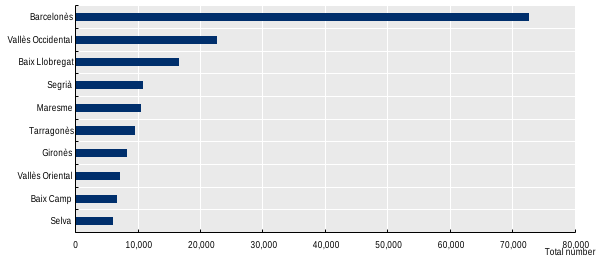
Source: Idescat (2025[96]), Statistical Yearbook of Catalonia: Foreign students. By place of origin. Counties and Aran, https://www.idescat.cat/indicadors/?id=aec&n=15727&lang=en (accessed on 1 April 2026).
In absolute terms, for the school year 2022/2023, Catalonia hosted the largest number of foreign students in Spain (231 790 students), ahead of Madrid (172 860), Valencia (147 910) and Andalusia (119 050) (Annex Table 2.A.1) (MEFPD, 2025[87]).
Student self-report data from PISA 2022 further indicate that nearly one in four 15-year-old students in Catalonia reported having an immigrant background (24%) (OECD, 2023[97]). This is one of the highest shares among Spanish autonomous communities, after Melilla (26%), and close to the Balearic Islands (21%) (OECD, 2023[97]). Among students who reported having an immigrant background, 14.4% reported being second-generation immigrants, while 9% first-generation (OECD, 2023[97]). At the national level, students’ self-report data on immigrant background was around 15% in 2022 (OECD, 2023[97]). These data indicate that immigration is a particularly salient aspect of the Catalan school population, both in absolute terms and relative to most other Spanish autonomous communities.
The composition of the foreign student population reflects Catalonia’s broader migration patterns. Administrative data for the 2023/2024 school year shows that the largest group comes from Central and South America (72 110 students), followed by students from the Maghreb (54 130), the European Union (37 500) and from Asia and Oceania (30 420), with smaller numbers from the rest of Europe, the rest of Africa, and North America (Figure 2.14) (Idescat, 2025[96]). This diversity implies that schools are responding not to a single migrant profile, but to a wide range of linguistic, educational and socio-economic circumstances.
Number of foreign students in Catalonia by place of origin, school year 2023/2024
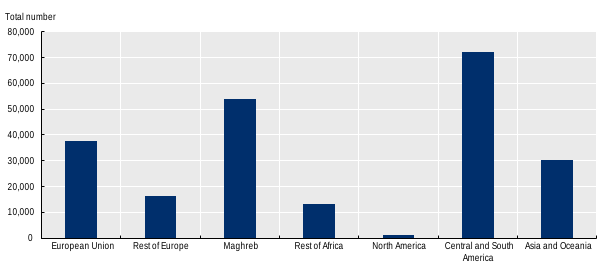
Source: Idescat (2025[96]), Statistical Yearbook of Catalonia: Foreign students. By place of origin. Counties and Aran, https://www.idescat.cat/indicadors/?id=aec&n=15727&lang=en (accessed on 1 April 2026).
The distribution of students of foreign nationality also varies by educational stage. In 2022/2023, Catalonia recorded particularly high shares in primary education (20%), well above the Spanish average (14%), followed by early childhood education (17% compared to 11% in Spain) and compulsory secondary education (15% compared to 12% in Spain) (MEFPD, 2025[87]). Although the proportion declines in post-compulsory non-tertiary education (11%), Catalonia also hosts the largest absolute number of foreign students in non-tertiary education among Spanish autonomous communities: nearly one-fourth of foreign students in non-tertiary education in Spain is in Catalonia (Annex Table 2.A.1) (MEFPD, 2025[87]).
This demographic composition reflects Catalonia’s openness and attractiveness to international mobility and will be an important factor for its future competitiveness. It brings significant linguistic, cultural and socio-economic diversity into classrooms which, in turn, increases the need for effective inclusion, support services and responsive system governance. Overall, these patterns also suggest that migration-related diversity is not concentrated in a single part of the system, but shapes enrolment across several educational stages, with implications as well for language support, inclusion and school-level capacity.
Socio-economic distribution
The socio-economic composition of schools in Catalonia reflects the interaction between residential patterns, admission policies and broader demographic dynamics. School-level composition is shaped not only by parental preferences or institutional practices, but also by spatial income distribution and residential segregation, which structure the pool of students available to each school. As a result, school composition is shaped by both social geography and institutional arrangements, rather than by family choice alone.
While place of residence remains the primary student allocation criterion, Catalonia has progressively strengthened regulatory instruments (see Decree 11/2021 on the programming of the educational offer and admission procedure and the Pact against school segregation (DOGC, 2021[49]; Catalan Ombudsman, 2019[50];) to mitigate school segregation and enhance early detection to promote a more balanced distribution of students with specific educational support needs (SESN), including those derived from disadvantaged socio-economic or socio-cultural circumstances (SESN-B) (Chapter 3). These regulatory efforts operate within structural constraints related to residential patterns and local implementation capacity.
Despite these efforts, school composition continues to reflect the distribution of disposable income in the territory, whether it is the neighbourhood, the municipality, the region or the province level. The 2025 monitoring report of the Catalan Ombudsman (Síndic de Greuges de Catalunya) indicates persistent differences in socio-economic composition between schools within the same municipality, particularly in large urban areas, reflecting persistent residential segregation and uneven local implementation capacity (2025[98]). Segregation therefore remains connected not only to school composition, but also to the capacity of governance arrangements to mitigate it in practice.
Imbalances are also associated with ownership of school facilities. In 2023-2024, 31% of primary students in public schools were identified as having specific educational needs derived from socio-economic or socio-cultural situations (SESN-B), compared to 16.6% in the publicly-subsidised private schools (concertada) (Figure 2.15) (Catalan Ombudsman, 2025[98]). In secondary education, disparities were smaller but still marked, with 21.5% of students in the public sector having these needs and 15.4% in the private sector (Catalan Ombudsman, 2025[98]). These differences indicate that disadvantage remains unevenly distributed across the publicly funded network, with implications for both equity and the distribution of support resources.
Proportion of students with SESN and SESN-B in primary and secondary education, by school ownership in Catalonia, school year 2023/2024
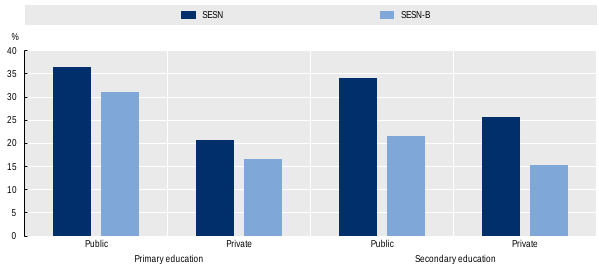
Note: SESN refers to specific educational support needs, and SESN-B refers to specific educational support needs due to disadvantaged socio-economic or socio-cultural circumstances.
Source: Catalan Ombudsman (2025[98]), Pacte contra la segregació escolar. Vint prioritats d'actuació per combatre la segregació escolar a Catalunya [Pact against school segregation (PSEC). Twenty priorities for action to combat school segregation in Catalonia], Síndic de Greuges de Catalunya, https://www.sindic.cat/site/unitFiles/10786/Informe%20pacte%20segregacio_juny2025_cat_ok.pdf.
Socio-economic disparities are also strongly associated with immigrant background. According to PISA 2022, 53% of immigrant students in Catalonia fall in the bottom quarter of the national index of economic, social and cultural status (ESCS), compared with 13% of non-immigrant students (a 39 percentage-point gap) (OECD, 2023[97]). Conversely, only 6% of immigrant students are in the top socio-economic quarter, compared with 32% of non-immigrant students (a 26-point gap) (OECD, 2023[97]). Comparable patterns of socio-economic stratification by immigrant status are observed across Spain, although the concentration of immigrant students in Catalonia gives this relationship particular weight in the regional context. Nationally, 50% of immigrant students are socio-economically disadvantaged compared with 20% of non-immigrant students (OECD, 2023[97]).
The concentration of socio-economically disadvantaged students has implications for both learning outcomes (see Performance of the education system section) and resource allocation (Chapter 6), as schools serving higher shares of disadvantaged students require stronger support and tend to face more complex implementation demands.
Catalonia has made sustained progress in expanding participation across education levels and increasing enrolment rates. At the same time, evidence from international assessments points to declining student performance and persistent disparities, which suggests that strong participation and attainment do not necessarily translate into equally strong learning outcomes for all students.
Access and participation
Participation is consistently high across stages, from early childhood to post-compulsory education, indicating broad and sustained engagement with the education system. This suggests that access is not the system’s main challenge; rather, the key issue is how far participation is matched by equitable learning and successful progression. In the first cycle (ages 0 to 2) of ECEC in Catalonia, enrolment reached 44% in 2024-2025, the highest level recorded since the early 2010s (35%) (Figure 2.16) (Department of Education and Vocational Training, 2025[99]). International data suggest that this share is slightly lower than the national average (46%) but remains well above the OECD average (29%) in 2023 (OECD, 2025[100]). Nonetheless, these comparisons should be interpreted with caution, as they rely on different data collections.
The second cycle (ages 3 to 5) of ECEC, although not compulsory, is almost universally attended in Catalonia, with over 95% of children attending in 2024/2025 (Figure 2.16) (Department of Education and Vocational Training, 2025[99]). While this share is slightly below pre-COVID-19 pandemic levels and below the national average (98%), it remains above OECD average (85% for 3- to 5-year-olds) and broadly in line with EU average (95%) in 2023 (OECD, 2025[100]; Eurostat, 2025[101]). Minor fluctuations largely reflect small mismatches between actual population changes and demographic estimates (MEFPD, 2025[87]). Again, some caution is advised when comparing results, as differences in data sources limit direct comparability.
Participation in post-compulsory education is also comparatively high. The schooling rate at post-compulsory ages had remained relatively stable at around 90% since 2012-2013 (Figure 2.16) (Department of Education and Vocational Training, 2025[99]). In 2024/2025, the enrolment rate among students aged 16- to 17-years-old was 90.5% in Catalonia (Department of Education and Vocational Training, 2025[99]). These patterns point to a system that has been relatively successful in sustaining participation both before and after compulsory schooling.
Participation rates at pre-compulsory and post-compulsory ages in Catalonia, by age group, 2012/2013 through 2024/2025
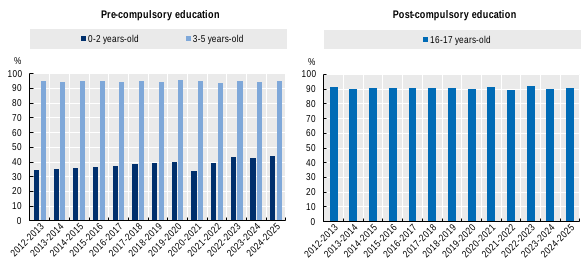
Note: Compulsory education in Catalonia begins at age 6 and consists of ten years of schooling (primary and lower secondary).
Source: Department of Education and Vocational Training (2025[99]), Indicadors del sistema educatiu [Indicators of the education system], https://educacio.gencat.cat/ca/departament/estadistiques/indicadors-series/sistema-educatiu/ (accessed on 1 April 2026).
Once in the system, students in Catalonia tend to progress smoothly through their educational pathways. Grade repetition in Catalonia is comparatively low within the Spanish context. According to administrative data for the 2022/2023 school year, repetition rates in Catalonia were practically negligible in primary education (0.4%) – the lowest among all autonomous communities and cities – compared to a national average of 1.1% (MEFPD, 2023[102]). In compulsory secondary education (ESO), repetition reached 2.7%, again the lowest rate in Spain, against a national average of 7% (MEFPD, 2023[102]). These indicators point to relatively smooth progression through formal pathways, although they do not in themselves capture the quality or depth of student learning.
Age suitability (i.e. the share of students enrolled in the grade corresponding to their theoretical age) is high in Catalonia and consistent with its low repetition rates. In 2024-25, over 95% of primary students were enrolled in the expected grade for their age (Department of Education and Vocational Training, 2021[56]). At key reference ages, Catalonia performs above the Spanish average: 98% of 8-year-old students were enrolled in the third year of primary (94% in Spain), and 97% of 10-years-olds in the fifth year of primary (91.7% in Spain) (Department of Education and Vocational Training, 2025[99]). In compulsory secondary education (ESO), age suitability declines progressively but remains comparatively strong, from 94% at age 12 (88% in Spain) to 86% at age 15 (76% in Spain) (Department of Education and Vocational Training, 2025[99]). Catalonia has also recorded one of the largest improvements over the past decade. Between the 2012-13 and 2022-23, age suitability at age 15 increased by more than 15 percentage point, compared with almost a 13-point increase at the national level (Department of Education and Vocational Training, 2025[99]).
These indicators suggest that access is universal, participation is consistently high across stages and students progress through educational stages with comparatively limited interruption in Catalonia. The extent to which these trajectories translate into successful completion across educational stages is examined through attainment outcomes.
Attainment
Attainment outcomes provide a more complete picture of how successfully students complete different stages of education. In Catalonia, attainment outcomes are comparatively strong and have improved over time.
Graduation rates at the end of compulsory secondary education (ESO) are comparatively high in Catalonia. In the 2023/2024 school year, 87% of students assessed in the fourth year of ESO successfully completed the stage and obtained the lower secondary certificate (Department of Education and Vocational Training, 2025[99]). Graduation outcomes varied by school sector, which points to persistent differences in student composition and in the conditions under which schools support progression and completion. In 2023/2024, the graduation rate in public schools stood at 85% compared to 93% in publicly-subsidised private schools, reflecting differences in student composition and performance (Department of Education and Vocational Training, 2025[99]).
ESO graduation rates have also improved steadily in Catalonia, rising from 81% in 2012/2013 to 86% in 2022/2023 (Figure 2.17) (MEFPD, 2025[87]). In 2022/23, Catalonia recorded the second-highest completion rate among autonomous communities, after the Basque Country (87%), and surpassed regions such as Asturias and Cantabria that previously had higher rates (MEFPD, 2025[87]).
Graduation rates in compulsory secondary education (ESO), by autonomous communities and cities, 2012/2013 and 2022/2023
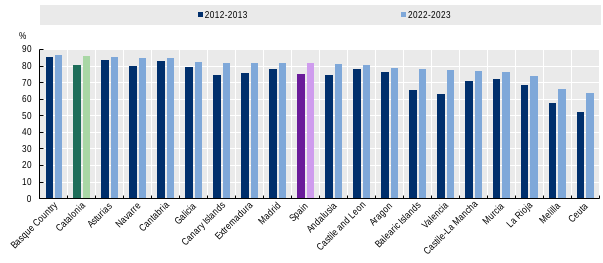
Note: Ranked in descending order of graduation rate in 2022/2023.
Source: MEFPD (2025[87]), Sistema estatal de indicadores de la educación 2025, [National System of Education Indicators 2025], https://www.libreria.educacion.gob.es/libro/sistema-estatal-de-indicadores-de-la-educacion-2025_185897/ (accessed on 1 April 2026).
At upper secondary level (Batxillerat), graduation rates are higher. In 2023-24, 92% of assessed students successfully completed the second year and obtained the baccalaureate qualification (Department of Education and Vocational Training, 2021[56]). This marks the highest rate observed since the COVID-19 pandemic, indicating continued recovery and stabilisation. As observed in ESO, differences between sectors are notable: 90% in public schools compared to 96% in the private sector (Department of Education and Vocational Training, 2025[99]). As at lower secondary level, differences between sectors suggest that progression and completion are not equally distributed across the system.
In addition, it should be noted that upper secondary qualifications can be obtained after varying lengths of study, hence completion rates are typically higher when considering older cohorts. Among young people aged 20-24, the share who had attained at least upper secondary education reached 79.2% in Catalonia in 2025 (Figure 2.18) (Idescat, 2026[103]). While this represents a substantial improvement over the past decade (56.2% in 2013), the most recent rate remains below both the EU (85.1%) and the Spanish averages (79.9%) for 2024 (Idescat, 2026[103]).
Population aged 20 to 24 that has completed secondary education and population aged 25 to 34 that has completed tertiary education

Note: (b) Break in time series for Spain and European Union (EU-27) in 2021 and 2014, and for Catalonia in 2014. In April 2024, Idescat reviewed the results of Catalonia of the Economically Active Population Survey for the years 2021-2023 with the new population base derived from the 2021 Population and Housing Census.
Source: Idescat (2026[103]), European Union indicators: Population aged 20 to 24 that has completed secondary education, https://www.idescat.cat/indicadors/?id=ue&n=10099&col=3&lang=en; Idescat (2026[104]), European Union indicators: Tertiary educational attainment, https://www.idescat.cat/indicadors/?id=ue&n=10100&col=3&lang=en (access 1 April 2026)
Attainment at tertiary levels has increased significantly over time. In 2025, 57.5% of the population aged 25-34 in Catalonia successfully completed tertiary studies (ISCED 5-8) (Figure 2.18) (Idescat, 2026[104]). This share is higher than both the Spanish average (52.6%) and the EU-27 average (44.2%) for 2024 (Idescat, 2026[104]). Women are more likely than men to hold tertiary qualifications (63.5% compared to 51.7% in 2025) (Idescat, 2026[104]).
While attainment outcomes have improved overall, early school leaving provides an additional perspectives on the difficulties in sustaining participation and successful completion. In 2025, 13.5% of 18–24-year-olds in Catalonia had left education and training with at most lower secondary education and were no longer participating in education or training (Idescat, 2026[105]). This share was slightly above the Spanish average (12.8%) and well above the EU average (9.1%) (Idescat, 2026[105]). Gender differences are particularly pronounced. Among boys, early school leaving rates reached 16.8% in 2025, compared with 9.8% among girls, a 7-points gap (Idescat, 2026[105]). This gap was wider than the Spanish average (6.4 points) and notably larger than in Madrid (1.5 points), although below the particularly large disparities observed in the Balearic Islands (15.6 points) (Figure 2.19) (MEFPD, 2026[106]). This suggests that gender differences in educational trajectories beyond compulsory schooling are comparatively pronounced in Catalonia, particularly among boys.
Share of 18-24-year-olds who at most have achieved lower secondary education and are not involved in any education or training, by gender, 2025
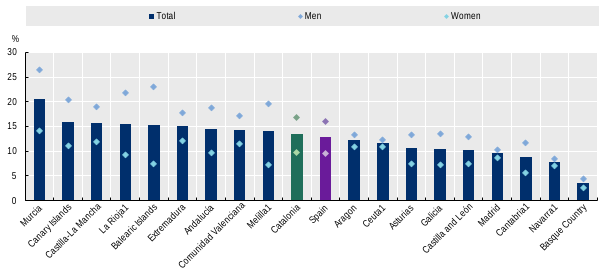
Note: (1) Data should be interpreted with caution, as estimates based on small sample sizes are subject to large sampling errors.
Source: MEFPD (2026[106]), Abandono temprano de la educación-formación por comunidad autónoma, sexo y periodo (indicador), [Early school leaving across autonomous communities, by gender, and over time (indicator)], https://estadisticas.educacion.gob.es/EducaJaxiPx/Tabla.htm?path=/laborales/epa/indi/l0/&file=indi_01.px (accessed on 12 May 2026).
In response, policy efforts are focussing on strengthening flexible transition and re-engagement pathways for young people who have left formal education or arrived in Catalonia after compulsory-school age. In this context, the Department of Education and Vocational Training plans to formally regulate so-called “new opportunities centres”, which currently support around 5 500 young people outside the mainstream education system through guidance, training and supported transition pathways back into education or employment (OECD/Department of Education and Vocational Training, unpublished[54]).
High participation, smooth progression and improving attainment indicate that Catalonia has a system that effectively retains students and supports completion. At the same time, persistent differences across school sectors and early school leaving rates suggest that not all students benefit equally from this strong pipeline. More broadly, these indicators point to a system that performs comparatively well in keeping students in education, but less consistently in ensuring strong learning outcomes for all. Strengthening transitions and continuity between compulsory and post-compulsory pathways remains particularly important for students with weaker academic performance or more vulnerable educational trajectories.
Learning outcomes
Student performance in Catalonia presents a mixed picture, with relatively modest average outcomes and growing concerns about declining trends and widening disparities. Evidence from international assessments points to challenges in foundational skills, alongside persistent gaps in how learning outcomes are distributed across socio-economic and demographic groups.
Performance of primary education students
Catalonia’s results in the Trends in International Mathematics and Science Study (TIMSS) 2023 point to emerging challenges in foundational learning at the end of primary education. The assessment measures mathematics and science competencies of fourth-grade students in primary education (ISCED 1), covering both content domains and cognitive processes3.
According to TIMSS 2023 evidence, Catalan students scored 489 points in mathematics, the third lowest among participating Spanish autonomous communities, ahead only of the Balearic Islands (473) and the Canary Islands (485) (von Davier et al., 2024[107]). Catalonia’s score is below the Spanish average (498) and substantially below the EU (514) and OECD (525) averages for mathematic proficiency in 2023 (von Davier et al., 2024[107]). Performance gaps are reflected not only in mean scores but in distribution: 42% of students in Catalonia did not reach the intermediate level in mathematics (12% at very low and 30% at low proficiency levels), compared to 38% in Spain, 30% in the EU and 27% in the OECD (von Davier et al., 2024[107]). The proportion of low-performing students is one of the highest among Spanish regions, exceeded only by the Balearic Islands (51%) and the Canary Islands (44%) (von Davier et al., 2024[107]). At the top end, 20% reached high or advanced levels in mathematics, which is comparatively lower than other autonomous communities, such as Castile and León (38%) and the Community of Madrid (35%) (von Davier et al., 2024[107]). This share is also below the averages of Spain (25%), the EU (35%) and the OECD (40%), indicating a relatively limited group of high achievers (von Davier et al., 2024[107]).
In science, results were comparatively stronger. Catalonia scored 502 points, close to the Spanish average (504), although still below the EU (513) and OECD (526) averages (von Davier et al., 2024[107]). Within Spain, Catalonia performs above the Balearic Islands (485), Andalusia (497) and the Canary Islands (499). Some 34% of students performed below intermediate proficiency in science, although this was a smaller share compared to mathematics (42%) (von Davier et al., 2024[107]). In contrast, 26% attained high and advanced performance, broadly aligned with the national distribution (von Davier et al., 2024[107]). The performance challenge at primary level therefore appears more pronounced in mathematics than in science for Catalonia. These patterns of comparatively weaker performance become even more pronounced by age 15, as shown by results from PISA 2022.
Performance of 15-year-old students
The OECD Programme for International Student Assessment (PISA) 2022 points to weaker outcomes at age 15 across mathematics, reading and science domains for Catalonia (2023[97])4. performance declined across many OECD countries and in Spain overall, the deterioration in Catalonia was comparatively large, especially in reading and mathematics. This raises concerns about the system’s capacity to secure strong foundational skills by the end of compulsory education.
In PISA 2022, Catalonia scored close to the Spanish average (473) and the OECD average (472), with 469 points in mathematics (Figure 2.20) (OECD, 2023[97]). Catalonia has a 30-point performance gap with the highest-performing region, Castile and León (499 points) (OECD, 2023[97]). While Catalonia does not fall into the lowest-performing autonomous communities and cities for mathematics (Canary Islands (447), Melilla (404) and Ceuta (395)), its score places it structurally closer to the lower end of the national distribution than to the leading regions (OECD, 2023[97]). This suggests that Catalonia’s challenge is not only absolute performance, but also its relative distance from the strongest-performing systems within Spain.
In reading, Catalonia recorded 462 points, 12-points below the Spanish average (474) and 14-points below the OECD average (476) (Figure 2.20) (OECD, 2023[97]). Among autonomous communities and cities, Castile and León (498), the Principality of Asturias (497) and Madrid (496) outperform Catalonia by more than 30 points (OECD, 2023[97]). Catalonia’s result is only marginally above Andalusia (461) and remains far from the top-performing group, with only Melilla (405) and Ceuta (404) recording substantially lower scores (OECD, 2023[97]).
In science, Catalonia scored 477 points, 8-points lower than the Spanish and OECD average (485) (Figure 2.20) (OECD, 2023[97]). The gap with the highest-performing regions such as Castile and León and Galicia (506) exceeds 25 points, while Catalonia performed slightly above Castilla-La Mancha (475) and Andalusia (473), and slightly below the Basque Country (480) and Extremadura (478) (OECD, 2023[97]).
Mean score in mathematics, reading, and science performance by autonomous communities and cities
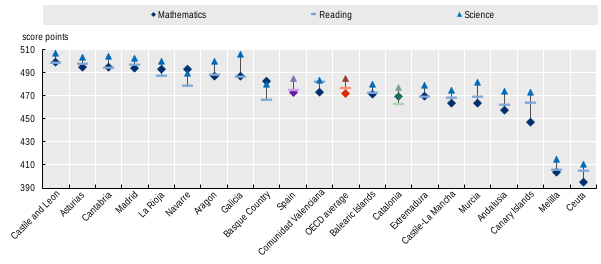
Note: Ranked in descending order of reading performance.
Source: OECD (2023[97]), PISA 2022 Results (Volume I): The State of Learning and Equity in Education, doi:10.1787/53f23881-en.
Importantly, PISA trend data reveal a general downward trend in student performance since 2012 across 35 OECD countries, with an unprecedented drop between 2018 and 2022, amounting to almost 15 score points in mathematics and around 10 points in reading on average (OECD, 2023[97]). Given that change in the OECD average for these countries over consecutive PISA assessments up to 2018 had never exceeded four score points in mathematics and five score points in reading, these 2022 results are unprecedented. Catalonia follows this pattern, with mean scores in all three subjects significantly lower in 2022 than in both 2012 and in 2018 (Figure 2.21) (OECD, 2023[97]). The decline therefore seems structural rather than cyclical, even if the pandemic may have intensified pre-existing weaknesses.
Mean performance in mathematics, reading and science, 2012 through 2022
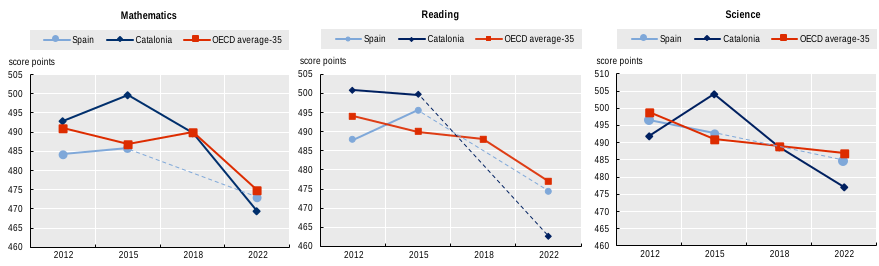
Note: Spain’s results for PISA 2018 are excluded from trend analysis due to OECD concerns regarding implausible response behaviour.
OECD average-35 refers to the arithmetic mean across all OECD Member countries, excluding Costa Rica, Luxembourg and Spain.
Source: OECD (2023[97]), PISA 2022 Results (Volume I): The State of Learning and Equity in Education, doi:10.1787/53f23881-en.
Mathematics performance in Catalonia fell by 24 points compared to 2012 – a decline higher than the one observed across 35 OECD countries (-16) and in Spain (-11), and one of the largest statistically significant reductions among Spanish autonomous communities (Figure 2.22) (MEFPD, 2023[102]; OECD, 2023[97];. Only Navarre (-24) and the Basque Country (-23) recorded comparable declines (MEFPD, 2023[102]).
The decline in mathematics performance was concentrated in the most recent cycle, with 21 points lost between 2018 and 2022 alone in Catalonia (Figure 2.22) (MEFPD, 2023[102]). The decline is sharper than that observed in Spain (-8) and across 35 OECD countries (-15), and contrasts with more stable trajectories observed in autonomous communities such as Madrid, which recorded a non-significant increase (+8) (MEFPD, 2023[102]; OECD, 2023[97];. This suggests that pandemic-related disruption alone does not fully explain the scale of the decline in Catalonia, raising questions about differences in system resilience and policy response.
Change in mathematics performance between PISA 2022 and 2012, and 2018, by autonomous communities and cities
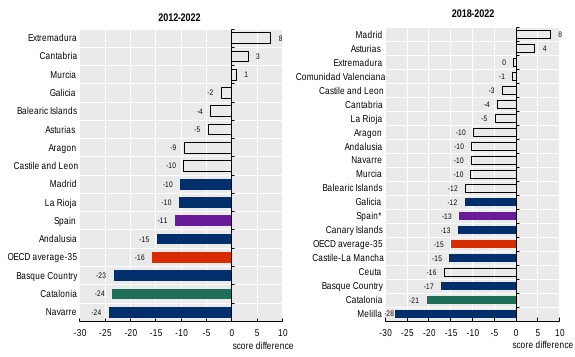
Notes: *For Spain the most recent comparison is to 2015 results.
Only autonomous communities and cities that participated and have available data in 2012, 2018 and 2022 PISA assessments are shown.
Outlined bars indicate non‑statistically significant differences. OECD average-35 refers to the arithmetic mean across all OECD Member countries, excluding Costa Rica, Luxembourg and Spain.
Source: OECD (2023[97]), PISA 2022 Results (Volume I): The State of Learning and Equity in Education, doi:10.1787/53f23881-en.
In reading, Catalonia experienced an even more pronounced long-term decline. Between 2012 and 2022, performance fell by 38 points, the largest reduction among participating autonomous communities (Figure 2.23) (MEFPD, 2023[102]). The decline exceeds both the average observed across 35 OECD countries (-16) and in Spain (-14), indicating sustained weakening over the decade rather than a cycle-specific shock5 (MEFPD, 2023[102]; OECD, 2023[97];. This is particularly significant given the centrality of reading for learning across the curriculum and for students’ broader educational trajectories.
Change in reading performance between PISA 2022 and 2012, by autonomous communities and cities
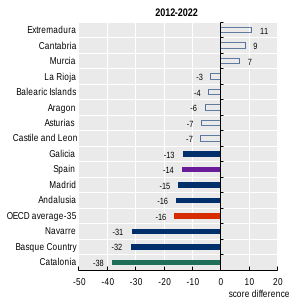
Notes: Only autonomous communities and cities that participated and have available data in 2012 and 2022 PISA assessments are shown.
Outlined bars indicate non‑statistically significant differences. OECD average-35 refers to the arithmetic mean across all OECD Member countries, excluding Costa Rica, Luxembourg and Spain.
Source: OECD (2023[97]), PISA 2022 Results (Volume I): The State of Learning and Equity in Education, doi:10.1787/53f23881-en.
In science, declines have been more modest. Between 2012 and 2022, science performance in Catalonia declined by 15 points, a statistically significant reduction comparable to Madrid (-15) and smaller than Navarre (-25) and the Basque Country (-26) (Figure 2.24) (MEFPD, 2023[102]). This decline is higher than the one observed across 35 OECD countries (-12) and in Spain (-12) (OECD, 2023[97]).
Unlike mathematics, the change in science performance between 2018 and 2022 was not statistically significant in Catalonia (-11 points), suggesting that not all of the declines can be attributed to the most recent period and to disruptions related to the COVID-19 pandemic (MEFPD, 2023[102]). Over the same period, Madrid was the only region to record a significant improvement (+15 points) (MEFPD, 2023[102]).
Change in science performance between PISA 2022 and 2012, and 2018, by autonomous communities and cities
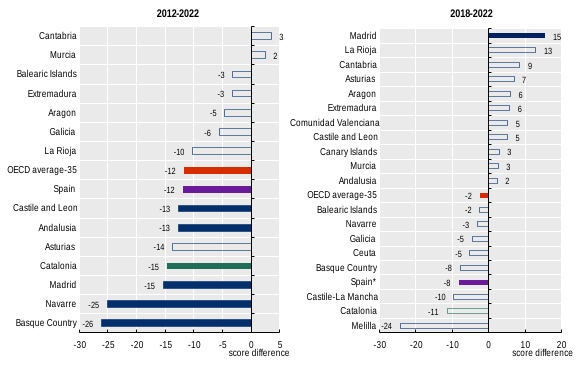
Notes: *For Spain the most recent comparison is to 2015 results.
Only autonomous communities and cities that participated and have available data in 2012, 2018 and 2022 PISA assessments are shown.
Outlined bars indicate non‑statistically significant differences. OECD average-35 refers to the arithmetic mean across all OECD Member countries, excluding Costa Rica, Luxembourg and Spain.
Source: OECD (2023[97]), PISA 2022 Results (Volume I): The State of Learning and Equity in Education, doi:10.1787/53f23881-en.
Variation in students’ performance
In the Catalan context, different dimensions of student diversity (including socio-economic background, immigrant background and linguistic profiles) interact in shaping learning outcomes. While differences related to home language are sometimes highlighted in public and policy debates, their interpretation requires caution. Potential differences in students’ mastery of the language of instruction are not limited to students with a migrant background, as some students who primarily speak Spanish at home may also require additional support to fully access learning in Catalan. This highlights the importance of ensuring that linguistic support measures respond to students’ actual learning needs and provide equitable access to learning opportunities.
At the same time, available analyses based on PISA data suggest that observed differences in performance between Catalan-speaking and Spanish-speaking students are strongly associated with underlying socio-economic and educational characteristics, rather than with language background alone. For example, Albaigés and Ferrer-Esteban (2024[108]) show that performance differences between these groups tend to diminish substantially, and in some cases largely disappear, once individual- and school-level ESCS, immigrant background and grade repetition are taken into account. This suggests that, within the Catalan system, disparities in outcomes are more strongly related to broader patterns of socio-economic inequality than to students’ home language alone. These findings show the importance of distinguishing between different profiles of linguistic need when designing support measures, and ensuring that support responds to actual learning conditions across the system.
While average scores and trends provide an overview of system performance, they do not capture how learning outcomes are distributed across students. Mean scores conceal important differences in how students are distributed across performance levels. A clearer picture of system performance therefore emerges when looking at both the share of top performers and the share of students below minimum proficiency (below PISA Level 2).
Results from PISA 2022 indicate that Catalonia has a limited pool of top-performing students across domains. In 2022, 6% of Catalan students reached the highest proficiency levels (Level 5 and 6) in mathematics, in line with Spanish average (6%) but below the OECD and EU averages (9%) (OECD, 2023[97]). Only four regions – La Rioja, Asturias, Castile and León, and Madrid – approach OECD levels (9%). A similar pattern is observed in reading and science, where around 5% of students reached the highest proficiency levels, in line with Spain (5%) and well below OECD and EU averages (7%) (OECD, 2023[97]).
At the lower end of the performance distribution, the share of students below PISA Level 2 – the minimum expected level of proficiency at age 15 – remains a key policy concern. In 2022, 29% of students in Catalonia performed below proficiency Level 2 in mathematics, a share slightly higher than the Spanish average (27%) and close to the EU (30%) and OECD (31%) averages (OECD, 2023[97]; Idescat, 2025[109]). This share was substantially higher compared to other autonomous communities such as Castile and León (18%), Cantabria (19%) and Madrid (20%) (OECD, 2023[97]). In reading, 29% of students in Catalonia performed below Level 2 in 2022, substantially above Spain (24%) and OECD and EU averages (26%) (Idescat, 2025[109]; OECD, 2023[97]). Spain’s comparatively lower national figure reflects strong performance in several autonomous communities, notably Castile and León (16%) and Madrid (17%) (OECD, 2023[97]). In science, 24% of students in Catalonia did not reach Level 2 proficiency in 2022. This was in line with OECD and EU averages (24%) but above Spain (21%) (OECD, 2023[97]; Idescat, 2025[109]). Catalonia’s shares of low achievers for 2022 were also nearly double the EU 2030 targets of reducing low achievement in reading, mathematics and science below 15% (Council of the European Union, 2021[110]).
Over the period 2012-2022, the share of top performers (i.e. scoring at Level 5 or 6) decreased in mathematics, from 8.7% to 6% (-2.7 percentage points) and in reading, from 7.3% to 4.9% (-2.4 points) (OECD, 2023[97]; OECD, 2014[111]). However, it increased in science, from 3.4% to 4.6% (+1.2 percentage points) (OECD, 2014[111]; OECD, 2023[97]).
Since 2012, underachievement (i.e. share of 15-year-old students scoring below Level 2) has increased across all three domains in Catalonia. In mathematics, the share rose from 20% in 2012 to 29.4% in 2022 (+9.4 percentage points), in reading it nearly doubled, from 15% to 29%, while in science it rose from 15.5% to 21.3% (+5.8 points) (Figure 2.25) (OECD, 2014[111]; OECD, 2023[97]). These data suggest that the overall decline in student performance in Catalonia reflects a sustained widening of the lower end of the performance distribution.
These trends highlight important disparities within the student population, complementing the analysis of declining average performance. Examining how outcomes vary according to students’ socio-economic background, immigrant background and gender provides further insight into the distribution of educational opportunities and learning outcomes in Catalonia.
Percentage of 15-year-old students failing to reach level 2 ('basic skills level') on the PISA scale in mathematics and reading, 2009-2022
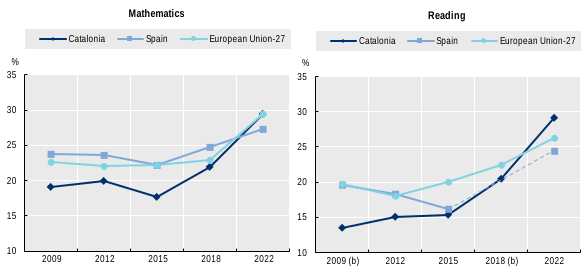
Note: (b) Break in time series for the European Union (EU-27) in 2009 and 2018, and for Spain in 2009.
Source: Idescat (2025[109]), European Union indicators: Underachievement in reading, maths or science, https://www.idescat.cat/indicadors/?id=ue&n=14743&lang=en (accessed on 1 April 2026).
Performance by socio-economic background (ESCS)
Differences in student performance in Catalonia are strongly associated with socio-economic background. The OECD PISA study measures this relationship through the index of economic, social and cultural status (ESCS), which combines parental education, parental occupation and home possessions. A higher ESCS score reflects greater access to economic, cultural and social capital.
In PISA 2022, socio-economically advantaged students (the top 25% in terms of socio-economic status) outperformed disadvantaged students (the bottom 25% of ESCS) by 96 score points in mathematics in Catalonia (Figure 2.26) (OECD, 2023[97]). Catalonia records the largest socio-economic performance gap in mathematics among all Spanish autonomous communities. By contrast, Cantabria stands out as the autonomous community with the smallest gap (60 points) (OECD, 2023[97]). Catalonia’s socio-economic performance gap in mathematics is larger than the average difference observed in Spain (86 points) and across OECD countries (93), although it remains below the EU average (102) (OECD, 2023[97]). This indicates that socio-economic inequality is particularly strongly associated with learning outcomes in Catalonia, even within the Spanish context.
Mean mathematics performance in PISA 2022 by ESCS quartiles, by autonomous communities and cities
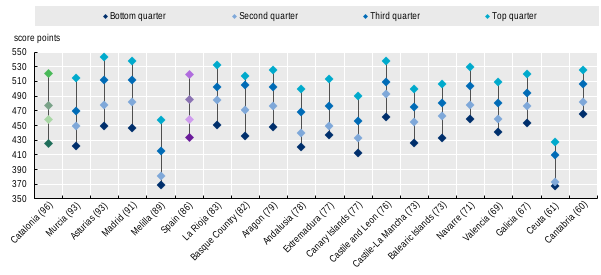
Note: In parenthesis, estimated score differences between socio-economically advantaged (top quartile) and disadvantaged students (bottom quartile). Ranked in descending order of the difference between top and bottom quartile.
Source: OECD (2023[97]), PISA 2022 Results (Volume I): The State of Learning and Equity in Education, doi:10.1787/53f23881-en.
Trend data suggest that inequalities have widened in Catalonia over the past decade. While the socio-economic gap in mathematics remained broadly stable in Spain and across OECD countries on average between 2012 and 2022, it increased by 6 score points in Catalonia (OECD, 2023[97]; OECD, 2013[112]). This widening reflects uneven performance declines: mathematics scores fell by 25 score points among disadvantaged students, compared with a 19-point decline among advantaged students (OECD, 2023[97]; OECD, 2013[112]). The sharper deterioration at the lower end of the distribution indicates that recent performance losses have disproportionately affected more vulnerable students, a pattern explored further in Chapter 3.
The strength of the socio-economic gradient (i.e. how well socio-economic status predicts performance) further illustrates this pattern. In 2022, 15.4% of the variance in mathematics performance in Catalonia was explained by differences in student socio-economic status (R²=0.154) (OECD, 2023[97]). This share is similar to OECD average (15.5%) and above Spain (14.2%), indicating that socio-economic background plays a somewhat stronger role in shaping outcomes in Catalonia than in Spain overall (OECD, 2023[97]). Although this share has decreased slightly since 2012 (17.5%), socio-economic background continues to play a substantial role in shaping outcomes (OECD, 2013[112]).
Similarly, the slope of the socio-economic gradient (i.e. the differences in performance observed across socio-economic groups) indicates that a one-unit increase in the ESCS index was associated with a 33-point increase in mathematics performance in Catalonia in 2022, broadly in line with Spain (32 points), although improving since 2012 (35 points) (OECD, 2023[97]). As PISA estimates that 20 score points correspond to roughly one year of learning at age 15 across OECD systems (Avvisati, 2021[113]), this reflects a steep and educationally meaningful divide.
Finally, after accounting for socio-economic background, Catalonia’s adjusted mean performance remains statistically similar to its observed mean score (OECD, 2023[97]). This indicates that performance gaps are less a question of student composition (e.g. the share of disadvantaged students) but more a reflection of how strongly socio-economic disadvantage is associated with lower achievement within the system, a relationship further examined in Chapter 3.
Performance by immigrant background
Another salient dimension of education performance relates to immigration background. Differences in prior educational trajectories, socio-economic resources and language exposure, particularly when the language spoken at home differs from the language of instruction, shape learning outcomes.
In Catalonia, native-born students consistently outperform students with an immigrant background in all assessed PISA domains (Figure 2.27). This pattern mirrors trends across OECD and EU education systems. In mathematics, the performance difference reaches 43 points in favour of native-born students in Catalonia, 10 points higher than Spain average (33 points), 13 points higher than OECD average (30) and close to EU average (42) (OECD, 2023[97]). In reading, this difference is 43 points in favour of native-born students, lower than the EU average (46 points), but higher than OECD average (41) and particularly higher than Spain average (32) (OECD, 2023[97]). In science, the differences are higher than those in reading and mathematics: 46 points for Catalonia, close to EU average (49 points) but higher than Spain (36) and OECD (38), also in favour of native-born students (OECD, 2023[97]). These gaps are sizeable enough to contribute materially to overall inequalities in system performance, particularly given the large share of students with an immigrant background in Catalonia.
Differences in mean mathematics, reading and science scores by immigrant status, autonomous communities and cities participating in PISA 2022
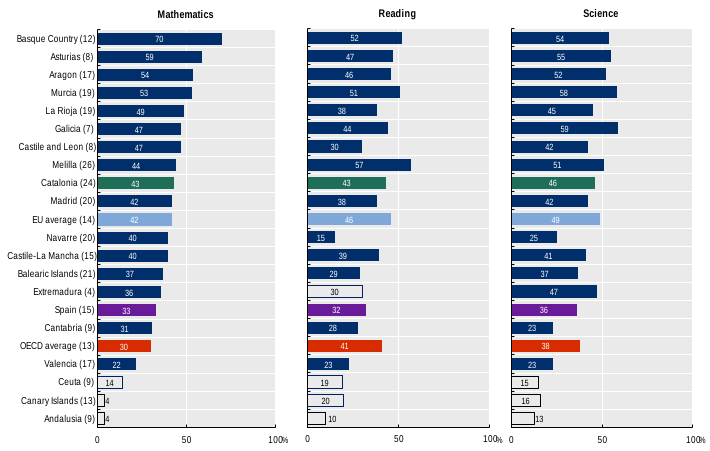
Note: Outlined bars indicate non‑statistically significant differences. Numbers in parenthesis are % of immigrants.
Source: MEFPD (2023[102]), PISA 2022: Programa para la Evaluación Internacional de los Estudiantes. Informe español, [PISA 2022. Programme for International Student Assessment. Spanish Report], https://www.libreria.educacion.gob.es/libro/pisa-2022-programa-para-la-evaluacion-internacional-de-los-estudiantes-informe-espanol_183950/.
Moreover, students with an immigrant background are disproportionately represented among low performers in Catalonia. Data from PISA 2022 show that, in mathematics, 42% of immigrant students perform below Level 2, compared to 24% of non-immigrant students – a 19-percentage point gap (OECD, 2023[97]). This disparity is wider than in Spain overall, where 38% of immigrant students score below Level 2 in mathematics, representing a 14-percentage points gap compared with non-immigrant students (OECD, 2023[97]). Still, it remains lower than shares observed in other autonomous communities, such as Melilla (76%, 23-point gap), Basque Country (51%, 34-point gap) and Murcia (50%, 25 points) (OECD, 2023[97]).
Similar disparities are observed in reading and science performance, where the share of low performers among immigrant students was 40% in reading (16.3 percentage points difference) and 36% in science (16.9 percentage points difference) in 2022, both higher than the respective averages in Spain (33% in reading and 31% in science) (OECD, 2023[97]). Given that nearly one-quarter of 15-year-olds in Catalonia self-report having an immigrant background in PISA 2022 (OECD, 2023[97]), these differences materially contribute to the overall concentration of low achievement across domains, a pattern considered further in Chapter 3.
These patterns indicate that disparities associated with immigrant background are evident across all proficiency domains and are reflected not only in mean performance but also in the concentration of students below minimum proficiency levels. Further analysis of the characteristics of students with an immigrant background may provide additional context for understanding these differences.
Socio-economic status by immigrant background
The relationship between immigrant background and student performance is closely connected to socio-economic inequalities. Students with an immigrant background in Catalonia are also disproportionately concentrated in the lower end of the socio-economic distribution.
According to PISA 2022, over half of students with an immigrant background (53%) fall in the bottom quarter of the ESCS index in Catalonia, compared to 13% of non-immigrant students, a 39 percentage-point difference (OECD, 2023[97]). Conversely, only 6% of immigrant students are in the top ESCS quarter, compared with 32% of non-immigrant students in Catalonia (OECD, 2023[97]). This concentration of disadvantage is slightly more pronounced in Catalonia than at the national level. Some autonomous communities show even higher concentrations of disadvantaged immigrant students, notably Melilla (75%), Murcia (67%) and La Rioja (60%) (OECD, 2023[97]).
This distribution suggests that part of the performance gap associated with immigrant background may reflect the underlying socio-economic disadvantage faced by students with an immigrant background in Catalonia. Before accounting for differences in students' socio-economic background or language spoken at home, non-immigrant students in Catalonia scored, on average, 42 points6 higher in mathematics than students with an immigrant background (Figure 2.28).
However, once socio-economic status is taken into account, this gap largely decreases to around 5 score points and is no longer statistically significant. After additionally accounting for the language spoken at home, the estimated difference narrows further to around 3 score points and remains not statistically significant. Similarly, PISA 2022 finds that the mathematics performance gap in Spain narrows from 32 to 7 score points once socio-economic background is taken into account, suggesting that differences in outcomes are largely associated with socio-economic disadvantage rather than immigrant status per se (OECD, 2023[97]). While these results do not imply a causal relationship, they indicate that much of the observed performance gap is associated with differences in socio-economic conditions. These insights highlight the importance of policies that address both socio-economic inequalities and the specific challenges faced by students with an immigrant background.
Difference in mathematics performance by immigrant background, before and after accounting for student socio-economic background (ESCS) and language spoken at home, PISA 2022

Note: Estimates are based on students with non-missing information on immigrant background, socio-economic status (ESCS) and language spoken at home. Outlined bars indicate non‑statistically significant differences.
Source: OECD (2023[97]), PISA 2022 Results (Volume I): The State of Learning and Equity in Education, doi:10.1787/53f23881-en.
Performance by gender
Performance differences by gender provide additional insight into the distribution of learning outcomes in Catalonia. Gendered performance disparities observed at age 15 can shape later educational trajectories, labour market opportunities and participation in different fields of study. International evidence shows that these differences are closely linked to social and cultural factors, including attitudes towards learning, school engagement and educational expectations, rather than innate ability (OECD, 2023[97]). PISA 2022 shows that on average across OECD countries boys outperforming girls in mathematics, while girls perform substantially better in reading; gender differences in science are generally smaller and less consistent across systems. This trend is also observed in Spain.
Catalonia nevertheless displays a distinctive pattern with respect to other Spanish autonomous communities. In mathematics, Catalonia is the autonomous community in which boys outperform girls by the smallest margin: only 2 points, a difference that is not statistically significant. This contrasts with the much larger gaps observed in Cantabria (17 points) and Madrid (15 points), as well as with the averages for Spain, the EU and the OECD, where boys outperform girls by around 10 points on average. However, the comparatively small gap in Catalonia reflects weaker performance among boys rather than stronger performance among girls. Boys in Catalonia score 471 points in mathematics, below the Spanish average for boys (478), while girls perform at a level broadly similar to the national average (468 points).
In reading, Catalonia records the largest gender gap among the autonomous communities. Girls outperform boys by 34 score points, while the average for Spain, the EU and the OECD is around 24 points. While both girls and boys perform below the Spanish average in reading, the gap is substantially larger among boys, with a mean score of 446 points in Catalonia compared with 462 nationally, than among girls (480 compared with 487).
In science, Catalonia is the only autonomous community where girls outperform boys (3 score points albeit non-statistically significant difference). By contrast, average gender differences in science across Spain slightly favour boys (5 points), while differences across the EU and OECD are close to zero. As in reading, however, both girls and boys in Catalonia perform below the Spanish average in science (470 compared with 482 points for girls and 476 compared with 487 for boys). Overall, these patterns suggest that comparatively weaker outcomes among boys contributes significantly to performance disparities in Catalonia. This points to the importance of further analysing gender differences in school engagement, learning behaviours and educational trajectories.
The reviewed evidence on the performance of the Catalan education system suggests an emerging misalignment between strong participation and attainment, and more modest and uneven learning outcomes. Declines in performance, particularly in reading and mathematics, seem to be driven by a sustained expansion of low achievement alongside a shrinking share of high performers. These trends occur in a context of increasing student diversity and persistent socio-economic segregation across schools (Chapter 3). Socio-economic background remains a powerful determinant of outcomes, with widening gaps and a concentration of disadvantage among certain groups, including students with an immigrant background. Gender differences, particularly lower reading performance among boys, also contribute to disparities in educational trajectories and engagement.
Overall, differences in outcomes appear to be driven less by access or composition alone than by the extent to which socio-economic and demographic factors translate into disparities in learning. While the system seems effective in retaining students and supporting completion, ensuring consistent acquisition of foundational skills across all groups remains a key challenge.
Well-being outcomes
Student well-being is an integral dimension of education system performance, reflecting both the conditions under which students learn and factors that shape their engagement, motivation and achievement. International evidence shows that cognitive, social and emotional dimensions of well-being, such as students’ capacity to manage their own learning, their sense of belonging at school and the quality of teacher support, are closely associated with learning outcomes, resilience and equity (OECD, 2023[114]). In this context, indicators related to self-directed learning, sense of belonging and teacher support provide a relevant lens to examine students’ learning experiences and the conditions underpinning performance in Catalonia.
In PISA 2022, Catalonia performs comparatively well in fostering students’ confidence in their capacity for self-directed learning, a key dimension of system resilience and student well‑being that reflects learners’ ability to plan, monitor and regulate their own learning (OECD, 2023[114]). A majority of Catalan students report feeling confident or very confident in key self-directed learning tasks, including finding learning resources online on their own (82%), planning when to do school work on their own (83%), completing schoolwork independently (85%), or assessing their own progress with learning (73%), with levels slightly above national averages (Figure 2.29) (OECD, 2023[114]). These skills are particularly important in contexts where learning is disrupted (e.g., COVID-19) or less structured, such as during remote or hybrid schooling, as they enable students to sustain engagement and continue learning independently (OECD, 2023[114]).
Importantly, these dispositions are meaningfully associated with learning outcomes. In Catalonia, students who report greater confidence in self-directed learning perform substantially better in mathematics than their less confident peers. A one‑unit increase in the PISA 2022 index of self-directed learning effectiveness is associated with an increase of 21 score points in mathematics performance (Figure 2.29) (OECD, 2023[114]). While part of this relationship reflects socio-economic differences, a substantial and statistically significant association remains even after accounting for students’ socio-economic background (15 points), highlighting self-directed learning as an important and independent contributor to student outcomes (OECD, 2023[114]).
Share of students who reported feeling confident/very confident in taking the following selected actions if their school building closes again in the future, PISA 2022
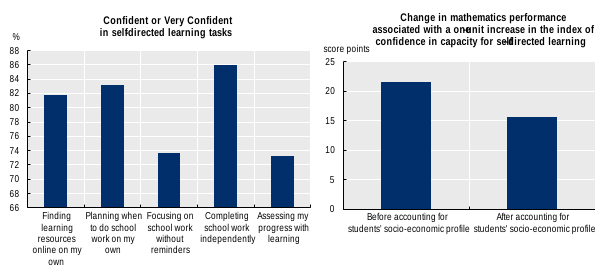
Note: The index of confidence in capacity for self-directed learning is based on student’s self-report.
Source: OECD (2023[114]), PISA 2022 Results (Volume II): Learning During – and From – Disruption, 10.1787/a97db61c-en.
At the same time, other dimensions of well-being point to areas of concerns. In Catalonia, 17% of 15-year-old students disagree or strongly disagree with the sentence “I feel like I belong at school” and an equal share (18%) agree or strongly agree with the sentence “I feel like an outsider (or left out of things) at school” (OECD, 2023[114]). Both figures exceed the Spanish averages (14% and 12%, respectively), pointing to a comparatively weaker sense of integration among students (OECD, 2023[114]). Moreover, one in six students (16%) report feeling lonely at school, also above the Spanish average (12%) (OECD, 2023[114]) (Chapter 3). While the relationship between students’ sense of belonging and academic performance is less direct, these perceptions are closely linked to students’ well-being and engagement (OECD, 2023[114]).
Classroom-level perceptions also point to areas for improvement. Catalan students report comparatively moderate levels of teacher support in mathematics compared to many other autonomous communities. Evidence from PISA 2022 shows that around 62% of students in Catalonia report that teachers show an interest in every student’s learning in every or most lessons, below communities such as Aragon (73%), the Canary Islands (72%), Cantabria (72%) and Madrid (72%), as well as below the Spanish average (69%) (OECD, 2023[114]). This points to potential gaps in consistent, individualised support within classrooms.
These concerns around students’ emotional well-being and school engagement have prompted the Department of Education and Vocational Training to expand targeted well-being and school support initiatives, including the “Well-being for Emotional Well-being” (Benestar per estar Bé) programme, through which specialised psychological support teams provide assistance to schools facing critical situations and support co-ordination and prevention activities (Department of Education and Vocational Training, 2026[115]).
These indicators provide a focussed, though not exhaustive, view of student well-being in Catalonia. They show a system that performs well in fostering students’ capacity to learn independently, but where challenges remain in strengthening students’ sense of belonging and perceptions of teacher support. This matters because sustaining strong learning outcomes over time requires not only cognitive skills, but also learning environments in which students feel supported, included and able to engage fully. Strengthening these dimensions could therefore help consolidate existing strengths while addressing emerging risks to student well-being, engagement and learning outcomes.
In Catalonia, at the time of writing this report, the environment was shaped by an active process of social dialogue concerning workforce conditions, inclusive education and broader efforts to strengthen the education systems. This process emerged in a context of sustained mobilisation and protests across the education sector, reflecting broader concerns regarding working conditions, inclusive education, administrative workload and implementation pressures within schools.
Since early 2026, several unions representing teachers and educational staff organised strikes, demonstrations and territorial stoppages in relation to demands for salary improvements, additional staffing, reductions in student-teacher ratios and stronger support for inclusive education (Catalunya Press, 2026[116]). Government representatives acknowledged these challenges and opened dialogue with unions.
During a period of sector-wide strikes in February 2026, the Generalitat reaffirmed its willingness to negotiate with unions and highlighted the increasing complexity of classrooms, the pressures associated with inclusive education and the need to improve both working conditions and school resources (Catalunya Press, 2026[116]). These discussions eventually led to the signature, in March 2026, of an agreement between the Department of Education and Vocational Training and the CCOO and UGT trade unions (Box 2.2). The agreement introduced a broad package of workforce and system reforms, including gradual remuneration increase, reductions in student-teacher ratios, reinforcement of inclusive education, additional resources for educational support staff (PAE), and measures aimed at reducing bureaucracy in schools. Planned investments amount to close to EUR 2 billion over the four years implementation period, equivalent to almost one quarter (23.9%) of the Department’s total budget proposal (Government of Catalonia, 2026[117]).
Despite the announced measures, the agreement did not fully resolve tensions within the sector. Several unions criticised both the substance of the agreement and the negotiation process, arguing that important issues remained insufficiently specified or inadequately funded (Vallespín, 2026[118]). In April 2026, the Minister of Education Esther Niubó reaffirmed that the Government’s priority was to implement the agreement rather than reopen negotiations, while unions warned that mobilisations would continue unless further negotiation spaces were established (Vallespín, 2026[118]).
Mobilisation intensified in May 2026, when education unions initiated a new cycle of 17 strike days across May and June, rejecting the agreement signed and calling for renewed negotiations on salaries, staffing and working conditions (Pere Roca Soler, 2026[119]). At the same time, the Department of Education and Vocational Training convened a new meeting with the unions (Government of Catalonia, 2026[120]).
A new pre-agreement with the unions was presented by the Department of Education and Vocation Training on May 29th, proposing a new remuneration supplement for teaching staff and further commitments regarding staffing allocations, inclusive education resources and curriculum consultation mechanisms (Government of Catalonia, 2026[121]). In parallel, many of the priorities reflected in the agreement were incorporated into the Government's proposed 2026 education budget, which foresees a substantial increase in education expenditure, additional teaching and support staff, expanded resources for inclusive education and significant investments in educational infrastructure and system modernisation (Government of Catalonia, 2026[122]; Department of Education and Vocational Training, 2026[123]).
Following negotiations with teacher unions, the Government ultimately signed the agreement with three of the five unions represented at the Sectoral Table (CCOO, UGT, and Aspepc-sps). The agreement incorporates commitments to improve the education system and teachers’ working conditions (Government of Catalonia, 2026[124]) Dialogue efforts were still ongoing at the moment of preparing this report.
These developments point both to significant pressure within the education system and to an important opportunity for reform, which can build on the preceding aim in Catalonia to improve student outcomes through system transformation. The scale of the planned investments, combined with sustained social dialogue and strong stakeholder mobilisation, may create conditions for strategically advancing long-standing objectives related to workforce sustainability, inclusion, educational quality and implementation capacity across the Catalan education system.
In March 2026, the Department of Education and Vocational Training of the Generalitat of Catalonia and the Trade Union Confederation of Workers' Commissions (Confederación Sindical de Comisiones Obreras, CCOO) and the General Union of Workers (Unión General de Trabajadores, UGT) reached an “agreement for education” aimed at strengthening the quality of the education system and improving workforce conditions. The agreement reflects a renewed phase of social dialogue and introduces a multi‑year reform agenda combining workforce measures, organisational reforms and investments linked to inclusion and school capacity. It establishes a Joint Deployment and Monitoring Committee responsible for supervising implementation and monitoring compliance with the agreed calendar and commitments.
The March agreement responds to concerns regarding the growing complexity of teaching, increasing diversity of student needs, pressures associated with inclusive education, administrative workload and challenges related to workforce attraction and retention. The measures are intended to strengthen implementation capacity across schools while improving workforce stability and learning conditions.
A central component regards workforce stability and planning. The agreement introduces annual workforce planning mechanisms linked to enrolment trends, student ratios, staffing needs, structural vacancies and school complexity. It also establishes a multi-year strategy to increase the proportion of permanent teaching positions from 57% currently to 85% by 2028, with the aim of reducing reliance on temporary staffing and improve continuity within schools and educational services.
The agreement also introduces measures aimed at improving the organisational functioning of schools and reducing administrative burden. These include a comprehensive administrative simplification plan, streamlining procedures and digital systems, and ensuring that non-teaching duties are reassigned to appropriate staff profiles, thereby protecting teachers’ pedagogical time. The agreement also seeks to rationalise staffing structure by limiting the use of profiled positions and introducing systematic evaluation of their impact on learning outcomes and school functioning.
Another major area of reform concerns learning conditions and the allocation of resources across the system. The agreement foresees a progressive reduction in student-teacher ratios, with implementation based on territorial planning, available space and human resources. The reduction will first be introduced in entry grades and then extended progressively to other levels. In the 2026/2027 academic year, over-ratios will be eliminated and 90% of public schools are expected to have a maximum ratio of 20 students in I3, or an equivalent student-teacher ratio. From 2027/2028, public schools are expected to have a maximum ratio of 20 students in I3, or an equivalent student-teacher ratio. In compulsory secondary education, public schools will have a maximum ratio of 30 students per group in the first year of ESO, or an equivalent student-teacher ratio, in 2026/2027, followed by a progressive reduction towards 25 students per group from 2027/2028 onwards, prioritising schools with high and very high levels of complexity.
The consolidation and expansion of inclusive education policies constitute a major pillar of the package, with approximately EUR 299 million allocated to measures extending to 2031. Building on Decree 150/2017, the agreement foresees the expansion of specialised support structures, reinforcement of multidisciplinary support services and the progressive incorporation of additional socio-educational and health professionals into schools. In parallel, the agreement includes a review of school complexity indicators and reception model for newly arrived students, with the objective of aligning staffing and support more closely with local needs.
The agreement further updates the functional framework of the teaching profession. Teachers are recognised as playing a stronger role in identifying educational needs, reducing barriers to participation and integrating guidance and support functions into ordinary teaching practice. The package also includes a planned legislative initiative recognising teachers as public authority in the exercise of their functions.
A significant component of the package concerns remuneration and professional recognition. The March 2026 agreement introduces a gradual 30% increase in the specific supplement for teaching staff between 2026 and 2029, equivalent to approximately EUR 3 000 annually for primary and secondary teachers. This specific salary supplement, intended to compensate for the particular conditions of the teaching profession, including technical difficulty, dedication and responsibility, had not been revised since 2001. The adjustment is explicitly justified by the growing complexity of the teaching role, particularly in inclusion, guidance and digital competencies, and is framed as aligning compensation with evolving professional demands. In addition, teachers are granted financial compensation (EUR 50 per night) for participating in school trips requiring overnight stays.
Subsequent discussions led to a May 2026 addendum introducing an additional remuneration measure: the “Complement for the Improvement of the Education Service of Catalonia” (Complement de millora del Servei d'Educació de Catalunya). Conceived as a universal and permanent component of the specific supplement, the new allowance is granted to all teaching staff working in schools of the Education Service of Catalonia, independently of individual performance evaluation. The allowance is cumulative with the previously agreed 30% increase in the specific supplement and other position-related remuneration components. Initially set at EUR 50 per month in 2026, it is planned to increase progressively to EUR 173.30 per month by 2029 (equivalent to EUR 2 426 annually), with retroactive application from 1 January 2026. This addendum also includes commitments to create 5 000 professorship positions between 2027 and 2028 and specifies a multi-year deployment plan for 6 413 additional staffing allocations linked in part to inclusive education and psycho-social support structures.
Finally, the Department of Education and Vocational Training has also worked, together with the union organisations, on a Strategic Plan that places strong emphasis on the recognition of educational support staff (Personal d’Atenció Educativa, PAE), reflecting their key role in delivering equitable and inclusive education. New salary supplements for several PAE categories, including early childhood education technicians, social integration workers, special education educators, and nursery staff, are introduced, backed by a dedicated funding of approximately EUR 23 million. These measures are explicitly linked to the complexity of direct student support tasks and the growing needs of vulnerable learners, marking a shift towards more differentiated and function-based remuneration.
Source: Government of Catalonia (2026[121]), Acord entre el departament d’educació i formació professional i les organitzacions sindicals ccoo i ugt sobre millores del sistema educatiu i condicions de treball del personal funcionari docent del Departament d’Educació i Formació Professional [Agreement between the Department of Education and Vocational Training and the union organisations CCOO and UGT on system improvements to the educational and working conditions of the teaching staff of the Department of Education and Vocational Training], https://www.ccoo.cat/educacio/wp-content/uploads/sites/139/2026/03/el-text-de-lacord.pdf; Government of Catalonia (2026[124]), Acuerdo para la mejora educativa [Agreement for Educational Improvement], https://web.gencat.cat/ca/ciutadania/actualitat/noticies/2026/06/acord-per-a-la-millora-educativa (accessed on 12 June 2026).
The evidence reviewed in this chapter suggests that Catalonia’s performance challenge cannot be reduced to demographic change or socio-economic composition alone. Rising diversity, persistent inequalities and differences in students’ language backgrounds increase the demands placed on schools, but the decline in outcomes also points to broader questions about instructional capacity, support for schools, evidence use and system steering. The following chapters therefore examine four policy levers that are closely related to the system’s capacity to improve learning outcomes while sustaining equity: equity and inclusion, teachers and school leadership, evaluation and assessment, and governance and funding.
References
[6] Ajuntament de Barcelona (2025), La població de Barcelona el 2025 [The population of Barcelona in 2025], http://hdl.handle.net/11703/140971 (accessed on 12 March 2026).
[10] Ajuntament de Barcelona (2024), El producte interior brut (PIB) de Barcelona 2023 [Barcelona GDP 2023], https://premsa-estatics-prod.s3.eu-west-1.amazonaws.com/premsa/wp-content/uploads/2024/05/PIB_BCN_2023_Maig_2024.pdf.
[108] Albaigés, B. and M. León (eds.) (2024), Els condicionants de sistema de l’èxit educatiu: gestió dels sistemes educatius i igualtat d’oportunitats [The systemic determinants of educational success: management of educational systems and equality of opportunity], Fundació Bofill, https://www.equitat.org/app/uploads/2025/03/q94-anuari2024_estateducaciocatalunya_v2.pdf.
[113] Avvisati, F. (2021), “How much do 15-year-olds learn over one year of schooling?”, PISA in Focus, No. 115, OECD Publishing, Paris, https://doi.org/10.1787/b837fd6a-en.
[41] Barcelona Education Consortium (2023), Barcelona Education Consortium: Managing Education in the City since 2009, https://www.edubcn.cat/rcs_gene/extra/01_el_ceb/03_CEB_Dossier_octubre_2023-angles.pdf.
[43] BOE (2009), Ley 12/2009, de 10 de julio, de Educación [Law 12/2009 of 10 July on Education], https://www.boe.es/eli/es-ct/l/2009/07/10/12/con (accessed on 12 May 2026).
[40] BOE (1978), The Spanish Constitution, https://www.boe.es/buscar/pdf/1978/BOE-A-1978-40001-consolidado.pdf.
[53] Catalan Ombudsman (2025), L’educació inclusiva a Catalunya [Inclusive education in Catalonia], Síndic de Greuges de Catalunya, https://www.sindic.cat/site/unitFiles/10530/Informe%20educacio%20inclusiva_gener_25_definitiu.pdf.
[98] Catalan Ombudsman (2025), Pacte contra la segregació escolar. Vint prioritats d’actuació per combatre la segregació escolar a Catalunya [Pact against school segregation (PSEC). Twenty priorities for action to combat school segregation in Catalonia], Síndic de Greuges de Catalunya, https://www.sindic.cat/site/unitFiles/10786/Informe%20pacte%20segregacio_juny2025_cat_ok.pdf.
[50] Catalan Ombudsman (2019), Pacte contra la segregació escolar [Pact against school segregation in Catalonia], Síndic de Greuges de Catalunya, https://www.sindic.cat/site/unitFiles/6058/Pacte%20segregacio%20escolar%202018_definitiu.pdf.
[116] Catalunya Press (2026), La Generalitat defiende la educación y apuesta por acuerdos para satisfacer las demandas del profesorado [The Catalan Government is committed to education and is working towards agreements to meet teachers’ demands], https://www.catalunyapress.es/articulo/politica-catalunya/2026-02-11/5768169-generalitat-defiende-educacion-apuesta-acuerdos-satisfacer-demandas-profesorado (accessed on 12 May 2026).
[37] Cooper, K. and K. Stewart (2020), “Does Household Income Affect children’s Outcomes? A Systematic Review of the Evidence”, Child Indicators Research, Vol. 14/3, pp. 981-1005, https://doi.org/10.1007/s12187-020-09782-0.
[110] Council of the European Union (2021), Council Resolution on a strategic framework for European cooperation in education and training towards the European Education Area and beyond (2021-2030) 2021/C 66/01, https://eur-lex.europa.eu/legal-content/EN/TXT/?uri=CELEX:32021G0226(01) (accessed on 12 May 2026).
[64] Department of Education and Vocational Training (2026), Batxillerat [Baccalaureate], https://triaeducativa.gencat.cat/ca/batxillerat/ (accessed on 1 April 2026).
[68] Department of Education and Vocational Training (2026), Cursos d’especialització [Professional training specialisation courses], https://triaeducativa.gencat.cat/ca/fp/cursos-especialitzacio/ (accessed on 1 April 2026).
[58] Department of Education and Vocational Training (2026), Educació infantil (0-3 anys) [Early childhood education (0-3 years)], https://triaeducativa.gencat.cat/ca/estudis/?educacio-infantil-primer-cicle&p_id=233 (accessed on 1 April 2026).
[60] Department of Education and Vocational Training (2026), Educació infantil (3-6 anys) [Early childhood education (3-6 years)], https://triaeducativa.gencat.cat/ca/estudis/?educacio-infantil-segon-cicle&p_id=234 (accessed on 1 April 2026).
[61] Department of Education and Vocational Training (2026), Educació primària [Primary education], https://triaeducativa.gencat.cat/ca/estudis/?educacio-primaria&p_id=235 (accessed on 1 April 2026).
[62] Department of Education and Vocational Training (2026), Educació secundària obligatòria [Compulsory secondary education], https://triaeducativa.gencat.cat/ca/estudis/?educacio-secundaria-obligatoria&p_id=246 (accessed on 1 April 2026).
[65] Department of Education and Vocational Training (2026), Formació professional [Professional training], https://triaeducativa.gencat.cat/ca/fp/ (accessed on 1 April 2026).
[63] Department of Education and Vocational Training (2026), Grau bàsic [Professional training basic level], https://triaeducativa.gencat.cat/ca/fp/grau-basic/ (accessed on 1 April 2026).
[66] Department of Education and Vocational Training (2026), Grau mitjà [Professional training intermediate level], https://triaeducativa.gencat.cat/ca/fp/grau-mitja/ (accessed on 1 April 2026).
[67] Department of Education and Vocational Training (2026), Grau superior [Professional training higher level], https://triaeducativa.gencat.cat/ca/fp/grau-superior/ (accessed on 1 April 2026).
[72] Department of Education and Vocational Training (2026), Graus i màsters [Degrees and masters], https://triaeducativa.gencat.cat/ca/graus-masters/ (accessed on 1 April 2026).
[70] Department of Education and Vocational Training (2026), Itineraris formatius específics (IFE) [Specific training itineraries (IFE)], https://triaeducativa.gencat.cat/ca/fp/ife/ (accessed on 1 April 2026).
[123] Department of Education and Vocational Training (2026), Pressupostos 2026 (02/2026) [Budget 2026 (02:2026, proposal)], https://govern.cat/govern/docs/2026/03/03/16/36/Dossier%20Pressupost%20Educaci%C3%B3%20i%20FP%202026.pdf.
[115] Department of Education and Vocational Training (2026), Programa de benestar emocional “Benestar per estar bé” [Emotional well-being programme “Well-being to be well”], https://educacio.gencat.cat/ca/arees-actuacio/professors/altres/programa-benestar-emocional/ (accessed on 12 May 2026).
[69] Department of Education and Vocational Training (2026), Programes de formació i inserció (PFI) [Training and integration programs (PFI)], https://triaeducativa.gencat.cat/ca/fp/pfi/ (accessed on 1 April 2026).
[57] Department of Education and Vocational Training (2026), Tria educativa [Educational choice], https://triaeducativa.gencat.cat/ca/inici/index.html (accessed on 1 April 2026).
[59] Department of Education and Vocational Training (2025), Escolarització gratuïta a I2 en escoles bressol públiques [Free schooling in I2 in public nursery schools], https://educacio.gencat.cat/ca/actualitat/parlem/gratuitat-infantil2/index.html (accessed on 12 March 2026).
[99] Department of Education and Vocational Training (2025), Indicadors del sistema educatiu [Indicators of the education system], https://educacio.gencat.cat/ca/departament/estadistiques/indicadors-series/sistema-educatiu/ (accessed on 12 March 2026).
[55] Department of Education and Vocational Training (2025), Pla d’acció departamental 2024-2028 [Departmental Action Plan 2024-2028], https://educacio.gencat.cat/web/.content/home/departament/linies-estrategiques/pla-departamental/pla-accio-educacio-fp.pdf.
[90] Department of Education and Vocational Training (2025), Pla de digitalització responsable [Responsible digitisation plan], https://educacio.gencat.cat/ca/departament/linies-estrategiques/pla-digitalitzacio-responsable/ (accessed on 12 March 2026).
[56] Department of Education and Vocational Training (2021), Sistema educatiu a Catalunya [The education system in Catalonia], https://educacio.gencat.cat/ca/arees-actuacio/centres-serveis-educatius/centres/sistema-educatiu/ (accessed on 12 March 2026).
[84] Department of Education and Vocational Training (2020), Digital Education Plan of Catalonia, https://educacio.gencat.cat/web/.content/home/departament/publicacions/colleccions/pla-educacio-digital/pla-educacio-digital-catalunya/pla-educacio-digital-angles.pdf.
[71] DOGC (2025), Acord GOV/55/2025, de 4 de març, per optimitzar i millorar l’accés a la formació professional, ampliar l’oferta dels ensenyaments professionalitzadors i fomentar la continuïtat formativa, [Agreement GOV/55/2025, of 4 March, to optimise and improve access to vocational training, expand the provision of vocational qualifications and promote continuous training], https://portaldogc.gencat.cat/utilsEADOP/PDF/9365/2075388.pdf.
[44] DOGC (2022), DECRET LLEI 6/2022, de 30 de maig, pel qual es fixen els criteris aplicables a l’elaboració, l’aprovació, la validació i la revisió dels projectes lingüístics dels centres educatius, [DECREE-LAW 6/2022, of 30 May, establishing the criteria applicable to the preparation, approval, validation and review of the language projects of educational centres], https://portaljuridic.gencat.cat/eli/es-ct/dl/2022/05/30/6 (accessed on 12 May 2026).
[45] DOGC (2022), LLEI 8/2022, del 9 de juny, sobre l’ús i l’aprenentatge de les llengües oficials en l’ensenyament no universitari, [LAW 8/2022, of June 9, on the use and learning of official languages in non-university education], https://portaljuridic.gencat.cat/eli/es-ct/l/2022/06/09/8 (accessed on 12 May` 2026).
[49] DOGC (2021), DECRET 11/2021, de 16 de febrer, de la programació de l’oferta educativa i del procediment d’admissió en els centres del Servei d’Educació de Catalunya, [DECREE 11/2021, of February 16, on the programming of the educational offer and the admission procedure in the centers of the Education Service of Catalonia], https://dogc.gencat.cat/ca/document-del-dogc/?documentId=893678 (accessed on 12 March 2026).
[51] DOGC (2017), DECRET 150/2017, de 17 d’octubre, de l’atenció educativa a l’alumnat en el marc d’un sistema educatiu, [DECREE 50/2017, of 17 October, on educational care for students within the framework of an inclusive educational system], https://portaldogc.gencat.cat/utilsEADOP/PDF/7477/1639866.pdf.
[48] DOGC (2009), LLEI 12/2009, del 10 de juliol, d’educació, [Law 12/2009, of July 10, on education], https://portaljuridic.gencat.cat/eli/es-ct/l/2009/07/10/12 (accessed on 12 March 2026).
[42] DOGC (1998), LLEI 1/1998, de 7 de gener, de política lingüística, [LAW 1/1998, of 7 January, on Language Policy], https://portaljuridic.gencat.cat/eli/es-ct/l/1998/01/07/1 (accessed on 12 May 2026).
[101] Eurostat (2025), Early childhood education statistics, https://ec.europa.eu/eurostat/statistics-explained/index.php?title=Early_childhood_education_statistics (accessed on 16 February 2026).
[88] Fraillon, J. and M. Rožman (eds.) (2025), IEA International Computer and Information Literacy Study 2023, Springer Nature Switzerland, Cham, https://doi.org/10.1007/978-3-031-61194-0.
[121] Government of Catalonia (2026), Acord entre el Departament d’Educació i Formació Professional i les organitzacions sindicals CCOO i UGT sobre millores del sistema educatiu i condicions de reball del personal funcionari docent del Departament d’Educació i Formació Professional, [Agreement between the Department of Education and Vocational Training and the union organisations CCOO and UGT on system improvements to the educational and working conditions of the teaching staff of the Department of Education and Vocational Training], https://www.ccoo.cat/educacio/wp-content/uploads/sites/139/2026/03/el-text-de-lacord.pdf.
[124] Government of Catalonia (2026), Acuerdo para la mejora educativa [Agreement for Educational Improvement], https://web.gencat.cat/ca/ciutadania/actualitat/noticies/2026/06/acord-per-a-la-millora-educativa (accessed on 2026).
[117] Government of Catalonia (2026), Educació i FP i CCOO i UGT signen un acord històric per a la millora educativa i les condicions laborals de tots els docents i personal PAE, [The Department of Education and Vocational Training, CCOO and UGT sign a historic agreement for educational improvement and the working conditions of all teachers and PAE staff], https://govern.cat/salapremsa/notes-premsa/799324/educacio-fp-ccoo-ugt-signen-acord-historic-millora-educativa-condicions-laborals-tots-docents-personal-pae (accessed on 12 May 2026).
[120] Government of Catalonia (2026), El Departament d’Educació i Formació Professional convocarà una reunió amb els sindicats amb representació a la Mesa Sectorial, [The Department of Education and Vocational Training will convene a meeting with the trade unions represented on the Sectoral Table], https://govern.cat/salapremsa/notes-premsa/821516/el-departament-d-educaci-i-formaci-professional-convocar-una-reuni-amb-els-sindicats-amb-representaci-a-la-mesa-sectorial (accessed on 12 May 2026).
[122] Government of Catalonia (2026), Pressupostos 2026 [Budget 2026], https://aplicacions.economia.gencat.cat/wpres/2026/03_projecte.htm.
[91] Government of Catalonia (2025), El Departament d’Educació i FP elimina l’ús del mòbil a tota l’etapa obligatòria [The Department of Education and Vocational Training bans the use of mobile phones throughout the compulsory school years], https://govern.cat/salapremsa/notes-premsa/717102/departament-deducacio-fp-elimina-lus-del-mobil-tota-letapa-obligatoria (accessed on 12 March` 2026).
[2] Government of Catalonia (2025), Legal framework of the Catalan language, https://llengua.gencat.cat/en/el-catala/marc-legal/index.html (accessed on 12 March 2026).
[14] Idescat (2026), Annual Economic Accounts for Catalonia. 2025: GDP growth, https://www.idescat.cat/novetats/?id=5464 (accessed on 12 March 2026).
[83] Idescat (2026), Basic Indicators of Catalonia: Companies in the ICT sector. Main results, https://www.idescat.cat/indicadors/?id=basics&n=22190 (accessed on 12 March 2026).
[16] Idescat (2026), Basic indicators of Catalonia: Employed persons in services, https://www.idescat.cat/indicadors/?id=basics&n=10209 (accessed on 12 March 2026).
[79] Idescat (2026), Basic Indicators of Catalonia: Equipment and use of ICT, https://www.idescat.cat/indicadors/?id=basics&n=10481 (accessed on 12 March 2026).
[7] Idescat (2026), Basic Indicators of Catalonia: Foreign population as of 1 January 2025. By sex and age groups, https://www.idescat.cat/indicadors/?id=basics&n=10332&lang=en&t=202500 (accessed on 12 March 2026).
[29] Idescat (2026), Basic Indicators of Catalonia: Inequality of income distribution indicators, https://www.idescat.cat/indicadors/?id=basics&n=10410&lang=en (accessed on 12 March 2026).
[80] Idescat (2026), Basic Indicators of Catalonia: Use of ICT for children aged 10 to 15, https://www.idescat.cat/indicadors/?id=basics&n=10482 (accessed on 12 March 2026).
[31] Idescat (2026), Enquesta de condicions de vida. 2025 [Survey on Living Conditions. 2025], https://govern.cat/govern/docs/2026/02/05/10/30/NPecv2025.pdf.
[32] Idescat (2026), EU Sustainable Development Goal indicators for Catalonia. Goal 1: No poverty. People at risk of income poverty after social transfers, https://www.idescat.cat/indicadors/?id=ods&n=13473&col=3 (accessed on 1 April 2026).
[34] Idescat (2026), EU Sustainable Development Goal indicators for Catalonia. Goal 1: No poverty. People living in households with very low work intensity, https://www.idescat.cat/indicadors/?id=ods&n=13475&lang=en (accessed on 1 April 2026).
[33] Idescat (2026), EU Sustainable Development Goal indicators for Catalonia. Goal 1: No poverty. People suffering from severe material and social deprivation, https://www.idescat.cat/indicadors/?id=ods&n=14980&lang=en (accessed on 1 April 2026).
[30] Idescat (2026), EU Sustainable Development Goal indicators for Catalonia: People at risk of poverty or social exclusion, https://www.idescat.cat/indicadors/?id=ods&n=13472&t=&lang=en (accessed on 12 March 2026).
[105] Idescat (2026), EU Sustainable Development Goal indicators: Early leavers from education and training (04.10), https://www.idescat.cat/indicadors/?id=ods&n=13603&lang=en (accessed on 12 May 2026).
[35] Idescat (2026), European Union indicators. People at risk of poverty or social exclusion, https://www.idescat.cat/indicadors/?id=ue&n=10121&lang=en (accessed on 12 March 2026).
[18] Idescat (2026), European Union indicators: Employment rate, https://www.idescat.cat/indicadors/?id=ue&n=10111&lang=en#Plegable=text (accessed on 12 March 2026).
[19] Idescat (2026), European Union indicators: Gender employment gap, https://www.idescat.cat/indicadors/?id=ue&n=14429&lang=en#Plegable=text (accessed on 12 March 2026).
[22] Idescat (2026), European Union indicators: Long-term unemployment rate, https://www.idescat.cat/indicadors/?id=ue&n=10116&lang=en#Plegable=text (accessed on 12 March 2026).
[103] Idescat (2026), European Union indicators: Population aged 20 to 24 that has completed secondary education. By sex, https://www.idescat.cat/indicadors/?id=ue&n=10099&lang=en (accessed on 12 March 2026).
[104] Idescat (2026), European Union indicators: Tertiary educational attainment, https://www.idescat.cat/indicadors/?id=ue&n=10100&lang=en#Plegable=text (accessed on 12 March 2026).
[21] Idescat (2026), European Union indicators: Unemployment rate. By sex, https://www.idescat.cat/indicadors/?id=ue&n=10114&t=202500&lang=en (accessed on 12 March 2026).
[25] Idescat (2026), European Union indicators: Young people neither in employment nor in education and training (NEET), https://www.idescat.cat/indicadors/?id=ue&n=14431&lang=en (accessed on 12 March 2026).
[4] Idescat (2026), Population Estimates. S2/2024–S1/2025. Definitive data, https://govern.cat/govern/docs/2026/01/28/10/00/NPep2025S1.pdf.
[15] Idescat (2026), Statistical Yearbook of Catalonia: Companies and establishments as of 1 January. By activity sectors and number of wage earners, https://www.idescat.cat/indicadors/?id=aec&n=15949&lang=en (accessed on 12 March 2026).
[24] Idescat (2026), Statistical Yearbook of Catalonia: Relationship with the activity of the population from 16 to 29 years of age, https://www.idescat.cat/indicadors/?id=aec&n=17501&lang=en (accessed on 12 March 2026).
[81] Idescat (2026), UN Sustainable Development Goal indicators for Catalonia: Goal 4: Quality education. Indicator 4.4.1 Proportion of youth and adults with information and communications technology (ICT) skills, by type of skill, https://www.idescat.cat/dades/ods/nu/4.4.1?lang=en (accessed on 12 March 2026).
[109] Idescat (2025), European Union indicators: Underachievement in reading, maths or science, https://www.idescat.cat/indicadors/?id=ue&n=14743&lang=en (accessed on 12 March 2026).
[8] Idescat (2025), Moviments migratoris. 2023 [Migratory Movements. 2023], https://govern.cat/govern/docs/2025/05/21/09/30/4e6f7490-abe7-4ebd-9d0e-a74d98eb1e8a.pdf.
[95] Idescat (2025), Statistical Yearbook of Catalonia: Foreign students. By ownership of centre and levels. Counties and Aran, https://www.idescat.cat/indicadors/?id=aec&n=15726&lang=en&t=202400 (accessed on 12 March 2026).
[96] Idescat (2025), Statistical Yearbook of Catalonia: Foreign students. By place of origin. Counties and Aran, https://www.idescat.cat/indicadors/?id=aec&n=15727&lang=en (accessed on 12 March 2026).
[11] Idescat (2025), Statistical Yearbook of Catalonia: GDP and GDP per inhabitant. Counties and Aran., https://www.idescat.cat/indicadors/?id=aec&n=15336 (accessed on 12 March 2026).
[12] Idescat (2025), Statistical Yearbook of Catalonia: Gross value added (GVA) by sectors. Counties and Aran., https://www.idescat.cat/indicadors/?id=aec&n=15337 (accessed on 12 March 2026).
[73] Idescat (2025), Statistical Yearbook of Catalonia: Infant and primary education. Centres and teachers. By ownership of centre. Counties and Aran, https://www.idescat.cat/indicadors/?id=aec&n=15713&lang=en#Plegable=text (accessed on 12 March 2026).
[74] Idescat (2025), Statistical Yearbook of Catalonia: Infant education. School units and pupils. By ownership of centre and sex. Counties and Aran, https://www.idescat.cat/indicadors/?id=aec&n=15714&lang=en#Plegable=text (accessed on 12 March 2026).
[46] Idescat (2025), Statistical Yearbook of Catalonia: Language Uses of the Population. First language, language of identification and habitual language, https://www.idescat.cat/indicadors/?id=aec&n=15781&t=202400&lang=en (accessed on 12 March 2026).
[1] Idescat (2025), Statistical Yearbook of Catalonia: Number of municipalities and population. Counties and Aran, https://www.idescat.cat/indicadors/?id=aec&n=15902&lang=en (accessed on 12 March 2026).
[3] Idescat (2025), Statistical Yearbook of Catalonia: Population as of 1 January. Provinces, https://www.idescat.cat/indicadors/?id=aec&n=15223&lang=en (accessed on 12 March` 2026).
[75] Idescat (2025), Statistical Yearbook of Catalonia: Primary education. School units and pupils. By ownership of centre and sex. Counties and Aran, https://www.idescat.cat/indicadors/?id=aec&n=15715&lang=en#Plegable=text (accessed on 12 March 2026).
[94] Idescat (2025), Statistical Yearbook of Catalonia: Secondary education. Students. By ownership of the centre and levels. Regions and Aran, https://www.idescat.cat/indicadors/?id=aec&n=15721&t=202400 (accessed on 12 March 2026).
[76] Idescat (2025), Statistical Yearbook of Catalonia: Special education. School units and pupils. By ownership of centre. Counties and Aran, https://www.idescat.cat/indicadors/?id=aec&n=15717&lang=en#Plegable=text (accessed on 12 March 2026).
[92] Idescat (2025), Statistical Yearbook of Catalonia: Students and teachers. By education levels, https://www.idescat.cat/indicadors/?id=aec&n=15712&lang=en (accessed on 12 March 2026).
[27] Idescat (2025), Statistics on Household Consumer Expenditures. 2024, https://www.idescat.cat/novetats/?id=5358&lang=en (accessed on 12 March 2026).
[13] Idescat (2025), Structural business statistics in the service sector. 2023., https://www.idescat.cat/novetats/?id=5259&lang=en (accessed on 12 March 2026).
[17] Idescat (2025), Structural statistics of companies in the industrial sector. 2023, https://www.idescat.cat/novetats/?id=5260 (accessed on 12 March 2026).
[47] Idescat (2023), Survey on Language Uses of the Population: Knowledge of languages: Catalan, Spanish, English and French., https://www.idescat.cat/pub/?id=eulp&n=10367&lang=en (accessed on 12 May 2026).
[28] Idescat (2020), EU Sustainable Development Goal indicators for Catalonia: Severe housing deprivation rate by poverty status, https://www.idescat.cat/indicadors/?id=ods&n=16162&col=3&lang=en (accessed on 12 March 2026).
[93] Idescat (2014), Statistical Yearbook of Catalonia: Secondary education. Students. By ownership of the centre and levels. Regions and Aran, https://www.idescat.cat/indicadors/?id=aec&n=15721&t=201300 (accessed on 12 March 2026).
[26] INE (2026), Statistical Yearbook 2026: Income per household by autonomous community.
[9] INE (2026), Statistical Yearbook 2026: Spanish Regional Accounts., https://www.ine.es/dynt3/inebase/en/index.htm?padre=8044&capsel=8182 (accessed on 12 March 2026).
[20] INE (2026), Statistical Yearbook 2026: Unemployment rates by different age groups, sex and autonomous community, https://www.ine.es/jaxiPx/Datos.htm?tpx=78852 (accessed on 12 March 2026).
[5] INE (2025), Spain in figures 2025, https://www.ine.es/en/prodyser/espa_cifras/EEC_FULL_PUBLICATION_25.pdf.
[82] INE (2025), Survey on Equipment and Use of Information and Communication Technologies (ICT) in Households, https://www.ine.es/dyngs/Prensa/en/TICH2025.htm (accessed on 12 March 2026).
[86] Ivàlua (2025), Avaluació del Pla d’Educació Digital de Catalunya. Avaluació de la implementació, [Evaluation of the implementation of the Digital Education Plan of Catalonia], https://educacio.gencat.cat/web/.content/home/departament/avaluacio-politiques-publiques/avaluacions-finalitzades/pla-educacio-digital-catalunya/avaluacio-implementacio.pdf.
[89] Ivàlua (2025), Avaluació. Usos dels dispositius digitals als centres educatius i efectes percebuts en els aprenentatges i en el benestar de l’alumnat, [Evaluation. Uses of digital devices in educational institutions and perceived effects on students’ learning and well-being], https://educacio.gencat.cat/web/.content/home/departament/avaluacio-politiques-publiques/avaluacions-finalitzades/us-dispositius-digitals-centres-educatius/informe-avaluacio-us-dispositius-digitals.pdf.
[85] Ivàlua (2022), Avaluació del Pla d’educació digital de Catalunya. Teoria del canvi. Novembre de 2022, [Evaluation of the Digital Education Plan of Catalonia. Theory of Change. November 2022], https://educacio.gencat.cat/web/.content/home/departament/avaluacio-politiques-publiques/avaluacions-finalitzades/pla-educacio-digital-catalunya/teoria-canvi.pdf.
[52] KSNET (2023), Avaluació de les mesures i suports intensius dirigits als alumnes amb necessitats educatives especials vinculades al Decret 150/2017, de 17 d’octubre, de l’atenció educativa a l’alumnat en el marc d’un sistema educatiu inclusiu, [Evaluation of the intensive measures and supports aimed at students with special educational needs under Decree 150/2017 of 17 October on educational provision for students within the framework of an inclusive education system], https://educacio.gencat.cat/web/.content/home/departament/avaluacio-politiques-publiques/avaluacions-finalitzades/educacio-inclusiva/avaluacio-policy-brief.pdf.
[106] MEFPD (2026), “Abandono temprano de la educación-formación por comunidad autónoma, sexo y periodo (indicador) [Early school leaving across autonomous communities, by gender and over time (indicator)]”, EDUCAbase, https://estadisticas.educacion.gob.es/EducaJaxiPx/Tabla.htm?path=/laborales/epa/indi/l0/&file=indi_01.px (accessed on 12 May 2026).
[87] MEFPD (2025), Sistema estatal de indicadores de la educación 2025 [National System of Education Indicators 2025], https://www.libreria.educacion.gob.es/libro/sistema-estatal-de-indicadores-de-la-educacion-2025_185897/ (accessed on 12 March 2026).
[102] MEFPD (2023), PISA 2022: Programa para la Evaluación Internacional de los Estudiantes. Informe español., [PISA 2022. Programme for International Student Assessment. Spanish Report], https://www.libreria.educacion.gob.es/libro/pisa-2022-programa-para-la-evaluacion-internacional-de-los-estudiantes-informe-espanol_183950/ (accessed on 12 March 2026).
[77] OECD (2026), OECD Digital Education Outlook 2026: Exploring Effective Uses of Generative AI in Education, OECD Publishing, Paris, https://doi.org/10.1787/062a7394-en.
[100] OECD (2025), Education at a Glance 2025: OECD Indicators, OECD Publishing, Paris, https://doi.org/10.1787/1c0d9c79-en.
[78] OECD (2025), Education Policy Outlook 2025: Nurturing Engaged and Resilient Lifelong Learners in a World of Digital Transformation, OECD Publishing, Paris, https://doi.org/10.1787/c3f402ba-en.
[36] OECD (2025), Reducing Inequalities by Investing in Early Childhood Education and Care, Starting Strong, OECD Publishing, Paris, https://doi.org/10.1787/b78f8b25-en.
[125] OECD (2024), PISA 2022 Technical Report, PISA, OECD Publishing, Paris, https://doi.org/10.1787/01820d6d-en.
[97] OECD (2023), PISA 2022 Results (Volume I): The State of Learning and Equity in Education, PISA, OECD Publishing, Paris, https://doi.org/10.1787/53f23881-en.
[114] OECD (2023), PISA 2022 Results (Volume II): Learning During – and From – Disruption, PISA, OECD Publishing, Paris, https://doi.org/10.1787/a97db61c-en.
[111] OECD (2014), PISA 2012 Results: What Students Know and Can Do (Volume I, Revised edition, February 2014): Student Performance in Mathematics, Reading and Science, PISA, OECD Publishing, Paris, https://doi.org/10.1787/9789264208780-en.
[112] OECD (2013), PISA 2012 Results: Excellence through Equity (Volume II): Giving Every Student the Chance to Succeed, PISA, OECD Publishing, Paris, https://doi.org/10.1787/9789264201132-en.
[23] OECD (2011), Higher Education in Regional and City Development: Catalonia, Spain 2011, Higher Education in Regional and City Development, OECD Publishing, Paris, https://doi.org/10.1787/9789264089006-en.
[54] OECD/Department of Education and Vocational Training (unpublished), Responses to OECD background questionnaire «A multi-year project to improve learning outcomes in Catalonia», internal document.
[39] Parliament of Catalonia (2006), Organic Act 6/2006 of the 19th July, on the Reform of the Statute of Autonomy of Catalonia, https://www.parlament.cat/document/cataleg/150259.pdf.
[119] Pere Roca Soler (2026), Education Strike in Catalonia: Unions Begin New Cycle of Protests, https://diaricatalunya.cat/en/barcelones/general/education-strike-in-catalonia-unions-begin-new-cycle-of-protests (accessed on 12 May 2026).
[38] Thévenon, O. et al. (2018), “Child poverty in the OECD: Trends, determinants and policies to tackle it”, OECD Social, Employment and Migration Working Papers, No. 218, OECD Publishing, Paris, https://doi.org/10.1787/c69de229-en.
[118] Vallespín, I. (2026), “Niubó descarta mejorar el pacto educativo: “No nos planteamos tocar el acuerdo, sino desplegarlo” [Niubó rules out improving the education pact: ‘We are not considering amending the agreement, but rather implementing it’]”, El País, https://elpais.com/espana/catalunya/2026-04-09/niubo-descarta-mejorar-el-pacto-educativo-no-nos-planteamos-tocar-el-acuerdo-sino-desplegarlo.html (accessed on 12 May 2026).
[107] von Davier, M. et al. (2024), TIMSS 2023 International Results in Mathematics and Science, TIMSS & PIRLS International Study Center, Boston College, https://doi.org/10.6017/lse.tpisc.timss.rs6460.
Foreign students in non-tertiary education, by school ownership and education level, school year 2022/23
Note: Data refer to general non-tertiary and special regime education. Adult and tertiary education are excluded. Percentages are calculated with respect to total enrolment in general education only.
Source: MEFPD (2025[87]), Sistema estatal de indicadores de la educación 2025 [National System of Education Indicators 2025], https://www.educacionfpydeportes.gob.es/dam/jcr:d2b43f52-a91a-4923-aae4-0eb10f35a3a2/seie-2025.pdf
← 1. At the time of writing, Decree Law 6/2022 and Law 8/2022 were under review by the Spanish Constitutional Court following constitutional appeals and a question of constitutionality raised by the High Court of Justice of Catalonia.
← 2. General upper secondary education: Baccalaureate (Batxillerat). Non-compulsory VET: Cicles formatius de grau mitjà (CFGM) and Cicles formatius de grau superior (CFGS). For more details, see section on structure and organisation of the school system.
← 3. The International Association for the Evaluation of Educational Achievement (IEA)'s Trends in International Mathematics and Science Study (TIMSS) 2023 assesses the mathematics and science competencies of students in the fourth grade of primary education. In mathematics, the framework covers three content domains (number, measurement and geometry, data) and three cognitive domains (knowing, applying and reasoning). The science framework is similarly structured, encompassing three content domains (life science, physical science, Earth science) and the same three cognitive domains.
Student performance is reported on a scale with defined international benchmarks:
← 4. The OECD Programme for International Student Assessment (PISA) assesses the extent to which 15-year-olds have acquired knowledge and skills essential for full participation in modern societies, in reading, mathematics and science. Results are reported on subject-specific scales (OECD mean around 500, standard deviation around 100), divided into proficiency levels defined by score-point ranges. These levels represent groups of tasks of increasing difficulty, from basic skills (Level 1) to advanced reasoning (Level 6). For further details, see PISA 2022 Technical Report (OECD, 2024[125]).
← 5. Spain’s reading results for PISA 2018 are excluded from trend analysis due to OECD concerns regarding implausible response behaviour.
← 6. The regression estimates are derived from a common estimation sample restricted to observations with non-missing values for all explanatory variables included in the model (immigrant background, socio-economic status (ESCS) and language spoken at home). The unadjusted difference shown in the figure therefore differs marginally from the descriptive estimate reported elsewhere in the chapter.