This chapter examines not only student performance in environmental science in PISA 2025, but also what PISA 2025 data can tell us about student attitudes towards the environment, their commitment to the environment, and school opportunities that support student environmental agency. The chapter explores student environmental agency, which encompasses the ways in which students understand the natural world and respond to the environmental challenges around them. Such agency emerges from an interplay of what students know, believe and can do, supported by the learning opportunities available to them; this chapter examines these interconnected dimensions and how education systems can strengthen them. Building strong scientific skills and attitudes is essential for sustainable decision-making, and may provide the foundation upon which today’s students can lead future scientific and technological breakthroughs in environmental sustainability.
PISA 2025 Results (Volume I)

Abstract
About three out of four students reached at least baseline proficiency (Level 2) in environmental science, on average across OECD countries, although differences across countries and economies are observed. In seven countries and economies, more than 85% achieved this.
Higher-performing students in environmental science tend to report more positive environmental attitudes such as environmental awareness, belief in one’s capacity to drive change and belief in collective efficacy.
Students’ environmental awareness declined across all five topics assessed in 2015 and 2025, with the largest drop observed for nuclear waste (-9 percentage points in the share of students who reported being able to explain the topic), followed by greenhouse gases and deforestation (-6 points each), while awareness of water shortages and biodiversity loss fell by 4 points, on average across OECD countries.
Caring for the environment is widespread among students. On average, 75% of students across OECD countries reported that looking after the global environment is important to them; in 42 countries and economies, this share exceeds 80% and it is over 90% in B-S-J-Z (China), Indonesia, Korea and Cambodia. On average, 16% of students demonstrate a mismatch between their environmental science proficiency and their reported care for the environment.
Students express strong pro-environmental intentions and optimism, although confidence in how to collaborate effectively is less widespread. On average across OECD countries, large shares of students believe that collective action can address environmental problems (82%) and that individuals can make a difference (81%). However, fewer reported knowing how to collaborate effectively (68%); this dimension also shows substantial cross-country variation (48%–90%).
Students with more positive environmental attitudes are more likely to take action. Environmental awareness, belief in one’s capacity to drive change and belief in collective efficacy are all consistently associated with greater participation in environmental activities across countries and economies.
On average across OECD countries, 28% of students reported never participating in any of the five environmental activities examined in PISA 2025, such as discussing with friends and family how to have a positive impact on the environment. Among these students, common reported reasons include not knowing anyone engaged in environmental actions (OECD average: 56%), believing that someone else would take care of the problem (49%), and feeling their own actions would not make a difference (47%).
While a majority of students reported interest in contributing to environmental protection through their future careers, it is unevenly distributed. On average across countries, around 62% of students expressed interest, with higher levels among girls, socio-economically advantaged students and higher-performing students.
Academically stronger students and students with pro-environmental attitudes were more likely to report their interest in contributing to environmental protection through their future occupations.
Despite the general positive relationship between environmental attitudes and commitment, on average across OECD countries, 7% of 15-year-old students reported caring for the environment but not being committed to protecting the environment. Such a mismatch between attitudes and commitment is minimal, and less than 1% in Viet Nam, Indonesia and Kenya, while it reached 16% in Korea.
Classroom opportunities for environmental learning are consistently associated with stronger pro‑environmental attitudes and commitment, even if their relationship with students’ performance in environmental science varies across countries and economies. Furthermore, a lack of classroom opportunities for environmental learning is related to the mismatch mentioned above. For example, 49% of environmentally “caring and committed” students agreed or strongly agreed that their class discusses solutions to environmental issues, while only 34% of “caring but not committed” students did so.
Around the world, young people are witnessing complex environmental challenges and considering what a more sustainable future might look like. There are multiple ways in which students may contribute to addressing socio‑ecological challenges. Building strong scientific and disciplinary skills is essential for sustainable decision‑making and may provide the foundation upon which today’s students can lead future scientific and technological breakthroughs in environmental sustainability. Pro-environmental attitudes, participation in environmental activities, and related career aspirations can support long-term environmental engagement at both the individual and community levels. These elements are different but equally valuable; they can reinforce one another, and none should be considered more important than the others.
Beyond examining student performance in environmental science, PISA 2025 data explore student attitudes towards the environment, their commitment to the environment – demonstrated by participation in environmental activities and/or interest in a career that contributes to environmental protection – and school opportunities that support student environmental agency. Student environmental agency encompasses the ways in which students understand the natural world and respond to the environmental challenges around them. As shown in Figure I.5.1, student environmental agency emerges from an interplay of what students know, believe and do, supported by the learning opportunities available to them. This chapter examines these interconnected dimensions and how education systems can strengthen them.
A first pillar of environmental agency is student proficiency in environmental science. Proficiency captures how much students know and understand about environmental issues. Their performance in PISA environmental science tasks1 reflects their grasp of ecological and Earth systems, the causes and consequences of environmental problems, and their ability to interpret scientific evidence and Figure out potential solutions. This knowledge and these competencies form the foundation for informed decision-making regarding environmental concerns.
A second pillar, environmental attitudes, focuses on how much students care about the environment and what they believe about their capacity – individually and collectively – to make a difference. As highlighted in Figure I.5.1, this includes measuring students’ environmental awareness, beliefs on whether they can generate environmental change personally, and beliefs in collective environmental efficacy.
The third pillar, environmental commitment, focuses on the extent to which students translate knowledge and attitudes into concrete behaviours and longer-term engagement. In the short term, this includes whether students engage in everyday activities that contribute to environmental protection. In the long term, it captures whether students aspire to contribute to environmental protection through their future careers. This approach recognises that there are many ways in which students contribute to environmental well-being. Environmental agency involves the capacity to define meaningful objectives, remain engaged over time, and adapt when facing challenges. In other words, agency reflects a commitment to a trajectory of sustained engagement, whatever form that engagement may take, rather than one‑off decisions.
Finally, the chapter examines the opportunities that schools provide for environmental learning, represented in the foundation layer of Figure I.5.1. These opportunities reflect the extent to which environmental issues are integrated into teaching and assessment, including activities such as discussing solutions to environmental problems, providing opportunities for students to research environmental topics, taking students on field trips related to environmental issues, and assessing students’ environmental knowledge. Considered together, these classroom‑based opportunities indicate how frequently students are exposed to environmental learning in school and how they are related to their performance in science, environmental awareness, attitudes and engagement.
Taken together, these four dimensions – proficiency, attitudes, commitment and school opportunities – offer a comprehensive framework for understanding how education systems can nurture students’ environmental agency.

Mean performance in environmental science
In PISA 2025, an environmental literacy subscale was included in the science assessment. Box I.5.1 provides details about the design and content of this new subscale.
Among OECD countries, the average score in environmental science was 480 points. B-S-J-Z (China) and Singapore achieved significantly higher scores than all other participating countries and economies. Chinese Taipei, Macao (China) and Japan also performed at comparatively very high levels. Figure I.5.2 shows each country/economy’s mean score.
Environmental literacy in PISA is defined as students’ capacity to:
Explain the impacts of human interactions with Earth’s systems (Competency 1).
Make informed decisions to act based on evaluation of diverse sources of evidence and application of creative and systems thinking to protect the environment (Competency 2).
Demonstrate hope and respect for diverse perspectives in seeking solutions to socio-ecological crises (Competency 3).
An environmental science scale was developed using a subset of PISA 2025 science test items. This scale draws on content, procedural and epistemic knowledge within the science framework that is clearly related to any science that can be considered to be of an environmental or ecological nature. Given the cognitive focus of the science assessment, only Competency 1 and Competency 2 can be measured through these test items.
To capture students’ environmental literacy more comprehensively, additional elements were assessed through the student questionnaire. These items are designed to complement the cognitive measures by addressing broader attitudes, reasoning and decision-making processes relevant to environmental and socio‑ecological issues.
Source: (OECD, 2026[1])

Note: Countries and economies are ranked in descending order of the mean score in environmental science.
Source: OECD, PISA 2025 Database, Table I.B1.5.1. See https://stat.link/2miwbs for the underlying data.
As shown in Figure I.5.3, environmental literacy varies markedly across student and school characteristics. For example, in most countries and economies, socio‑economically advantaged students outperform disadvantaged students, and students attending schools with an advantaged profile score higher than those in disadvantaged schools. Students without an immigrant background also tend to outperform immigrant students, and students enrolled in urban schools score higher than those in rural schools. Gender differences are more heterogeneous: on average across OECD countries, girls score 5 points higher than boys, and this pattern is observed in 44 countries and economies. However, in 10 countries and economies, boys achieve higher scores than girls, indicating that gender gaps vary substantially across education systems (Table I.B1.5.4).
Mean score in environmental science, by student and school characteristics; OECD average

Note: Score-point differences for each indicator are statistically significant (see Annex A3).
Source: OECD, PISA 2025 Database, Table I.B1.5.4. See https://stat.link/2miwbs for the underlying data.
What students know and can do in environmental science
PISA reports student performance through scores on the environmental science scale; however, scores alone do not demonstrate what students can actually do. To provide a meaningful interpretation of student capabilities, PISA groups performance into proficiency levels that describe the types of tasks students at different score ranges can successfully complete. A full description of the competencies associated with each proficiency level of the environmental science scale is provided in the PISA 2025 Technical Report (OECD, forthcoming[2]).
In PISA 2025, the environmental science scale comprises seven proficiency levels;2 Figure I.5.4 shows how students are distributed across them. Level 2 is defined as the baseline level of proficiency; at this level, students are able to describe how human activities influence Earth systems, whether through intended positive actions or unintended negative consequences. They can also explain how a practical solution to a socio-ecological challenge may affect themselves or their family, and they are able to choose the best justification for a decision that addresses environmental and climate-related risks using simple, clear reasoning. Students who do not attain baseline Level 2 are referred to in this chapter as “low performers”.
On average across OECD countries, about three out of four students achieve at least Level 2 proficiency in environmental science. More than 85% of students in B-S-J-Z (China), Macao (China), Singapore, Japan, Estonia, Chinese Taipei and Korea (listed in descending order of the share achieving the baseline) performed at Level 2 or above.
Conversely, 26% of students did not reach Level 2 in environmental science, on average across OECD countries. In 21 countries and economies, more than half of students failed to reach Level 2; whereas in 13 countries and economies, the share of low performers is below 20% (Table I.B1.5.2).
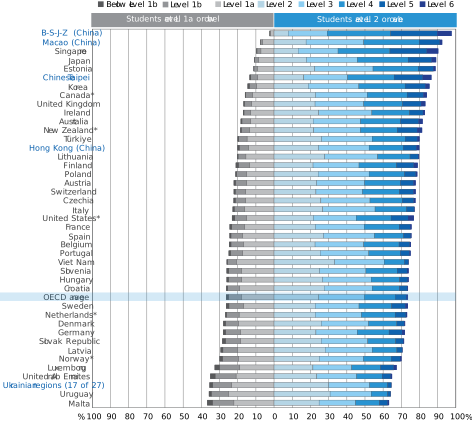
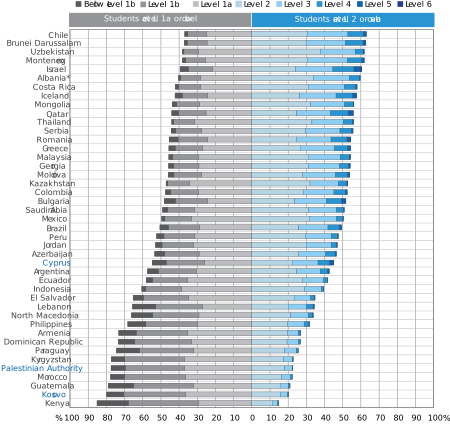
Note: Countries and economies are ranked in descending order of the percentage of students who performed at or above Level 2.
Source: OECD, PISA 2025 Database, Table I.B1.5.2. See https://stat.link/2miwbs for the underlying data.
Environmental awareness
The level of students’ environmental awareness varies by topic. To measure student environmental awareness, students were asked to rate their knowledge of six topics on a four-point scale, as shown in Table I.5.1. On average across OECD countries, over 30% of students reported that they are familiar with the issues of “effects of plastic pollution” and would be able to explain them well, and nearly 30% did so for “extinction of plants and animals”. In contrast, the issue of “nuclear waste” shows the lowest level of students’ awareness, as only one out of ten students reported that they can explain this well. Between 33% and 45% of students responded that they know something about these six topics and could explain the general issues. The level of students’ environmental awareness varies widely across countries and economies, as shown in Figure I.5.o1 (online).
Between 2015 and 2025, students' environmental awareness declined across all five topics that were also assessed in 2015 (Table I.B1.5.9). The topic "effects of plastic pollution" was newly introduced in PISA 2025. The largest decline was observed for "nuclear waste", which fell by 9 percentage points, on average across OECD countries. In 2015, 54% of students reported that they knew something about nuclear waste or were familiar enough with the topic to explain it well, compared to 45% in 2025. This was followed by a 6-percentage-point decline in awareness of "the increase of greenhouse gases in the atmosphere", from 63% in 2015 to 57% in 2025, and of "the consequences of clearing forests for other land use", from 73% to 67%. The remaining two topics, "water shortage" and "the extinction of plants and animals", showed declines of 4 percentage points between 2015 and 2025, from 72% to 68% and from 79% to 75%, respectively.
Percentage of students, OECD average
Source: OECD, PISA 2025 Database, Table I.B1.5.6.
Belief in capacity to generate environmental change
As shown in Figure I.5.5, over 80% of students reported that they agree or strongly agree that collective action can solve environmental problems and that they can personally make a positive impact, on average across OECD countries. Furthermore, three out of four students agreed or strongly agreed that “looking after the global environment is important for me”. In 42 countries and economies, more than 80% of students agreed with this statement (Table I.B1.5.11). This share is over 90% in B-S-J-Z (China), Indonesia, Korea and Cambodia. Even in the countries with the lowest levels of agreement, over half of students still reported that caring for the environment is important to them. By contrast, fewer students reported knowing how to work with others to achieve positive environmental outcomes (68%). This item also shows considerable variation across countries and economies, with agreement levels ranging widely, from 48% to 90%.
Percentage of students who reported they agree or strongly agree with the following statements

Source: OECD, PISA 2025 Database, Table I.B1.5.11. See https://stat.link/2miwbs for the underlying data.
The overall level of students’ beliefs in their capacity to generate positive environmental change, drawing on different aspects discussed earlier, varies widely across countries and economies, as shown in Figure I.5.o2 (online). B‑S‑J‑Z (China) shows, by some distance, the highest level of students’ beliefs in their capacity to contribute to change, and Poland and the Netherlands* show the lowest levels. Belief in one’s capacity to enact change is closely linked to the hope that there is a way towards a possible future that is worth achieving (White et al., 2023[3]).
Belief in collective environmental efficacy
Around two out of three or more students reported believing in collective agency to resolve environmental issues, as shown in Table I.5.2, on average across OECD countries. For example, 73% of students agreed or strongly agreed with the statement “I believe that by working with my local community we can play an important role in positively impacting the environment”. The level of students’ belief in collective environmental efficacy varies widely across countries and economies, as shown in Figure I.5.o3 (online).
Percentage of students, OECD average
Source: OECD, PISA 2025 Database, Table I.B1.5.18.
Environmental attitudes and performance in environmental science
Students who express more positive environmental attitudes on one measure also tend to report more positive attitudes on other measures, in all participating countries and economies. The strongest relationship is observed between students’ beliefs in collective environmental efficacy and their beliefs in their personal capacity to generate environmental change. Some 28% of variation in the former is accounted for by the latter, on average across OECD countries (Table I.B1.5.21). Environmental awareness accounts for some 13% of variation in students’ beliefs in their own capacity to generate environmental change (Table I.B1.5.14) and 6% of variation in students’ beliefs in collective environmental efficacy (Table I.B1.5.22).
Students who achieve higher scores on the environmental science scale tend to report stronger pro-environmental attitudes. This association is observed across almost all participating countries and economies. As shown in Figure I.5.6, all three pro-environmental attitudes measured in PISA 2025 are positively associated with students’ performance in environmental science, although the strength of the relationship varies across them.
The association is somewhat stronger for environmental awareness, with students who scored higher on this scale performing, on average, 32 points higher on the environmental science assessment than those with lower levels of awareness. This strong association is expected, as environmental awareness reflects students’ self-rated knowledge of environmental science. The differences are slightly smaller for the two other attitudes: 23 points for students’ beliefs in their own capacity to generate environmental change, and 17 points for beliefs in collective efficacy regarding environmental issues.
Across almost all countries and economies, socio-economically advantaged students and those in more advantaged schools reported more positive levels of environmental attitudes on all three measures than disadvantaged students and schools (Tables I.B1.5.7, I.B1.5.12 and I.B1.5.19). Since the socio-economic profile of students and schools is also associated with performance in environmental science, the relationships between performance and attitudes are examined after accounting for these factors. The positive associations between performance and attitudes remain broadly consistent even when comparing among students and schools with similar socio-economic profiles (Tables I.B1.5.8, I.B1.5.13 and I.B1.5.20).
There are several potential explanations for these positive relationships between performance and attitudes. Students who have a better understanding of environmental issues may be more likely to value and care about them. The reverse may also be true: pro-environmental attitudes might contribute to better learning outcomes, as motivated students are more likely to engage with environment-related material in class, thereby strengthening both their knowledge and their interest in the subject. These two pathways – motivation supporting learning and learning reinforcing attitudes – likely interact in a mutually reinforcing way. Students who care more about environmental issues may engage more deeply in learning, while increased understanding may further strengthen their concerns and sense of importance, producing the consistently positive association observed in PISA.
Change in student environmental science performance associated with a one-unit increase in each index of environmental attitudes; OECD average and countries with largest and smallest differences

Source: OECD, PISA 2025 Database, Tables I.B1.5.8, I.B1.5.13 and I.B1.5.20. See https://stat.link/2miwbs for the underlying data.
Despite the general positive association between students’ environmental performance and their attitudes shown earlier in this chapter, a non-negligible share of students demonstrates a mismatch between caring and proficiency.
On average across OECD countries, 16% of students show a mismatch of caring without proficiency. These students agreed or strongly agreed that "looking after the global environment is important to me" but did not reach baseline proficiency (Level 2) in environmental science (Figure I.5.7). Another 17% of students show an opposite type of mismatch, which is proficiency without caring. These students reached baseline proficiency level in environmental science but disagreed or strongly disagreed that "looking after the global environment is important to me." Across education systems, the prevalence of these two types of mismatches varies.
Percentage of students who display different combinations of proficiency (below or at/above baseline proficiency in environmental science) and care (whether agreed or disagreed that "looking after the global environment is important to me")

Notes: In the legend, caring refers to students who (strongly) agreed that “looking after the global environment is important to me” and not caring refers to those who (strongly) disagreed with this statement.
Countries and economies are ranked in descending order of the percentage of students who performed below baseline proficiency, i.e. Level 2.
Source: OECD, PISA 2025 Database, Table I.B1.5.16. See https://stat.link/2miwbs for the underlying data.
Environmental commitment involves the extent to which students translate knowledge and attitudes into concrete behaviours and longer-term engagement. In the short term, this includes whether students engage in everyday actions that demonstrate concerns about sustainability. In the long term, it captures whether students aspire to contribute to environmental protection through their future careers. This approach recognises that there are many ways in which students contribute to environmental well-being. As such, environmental agency involves the capacity to define meaningful objectives, stay engaged over time, and adapt when facing challenges. In other words, agency reflects a commitment to a trajectory of sustained engagement, whatever form that engagement may take. This section uses 15-year-old students’ reports on their behaviours and aspirations as proxies for their environmental commitment. A limitation of this approach should be noted as these are not direct measures of lasting environmental engagement.
Environment‑related activities
Across PISA countries and economies, the most common environment-related activities reported by students, among the five activities asked about in PISA 2025, are discussing with friends and family how to have a positive impact on the environment and making purchases based on product sustainability. On average across the OECD, 56% of students engaged at least once in environmental discussions in the year prior to the PISA test (Table I.B1.5.24). Similarly, 54% of students reported making sustainability‑based purchases. Students who reported that they stopped eating certain foods to reduce their environmental impact is also relatively widespread (OECD average: 40%). In contrast, posting concerns about environmental issues on social media and joining a peaceful march or rally are the least frequently reported activities.
As shown in Figure I.5.8, 72% of students reported that they participated in at least one of the environmental activities among the five activities asked about in PISA 2025. This share reaches over 90% in Indonesia, Kenya, Rwanda, Viet Nam, Cambodia, Thailand, the Philippines, Malaysia and Uzbekistan.
Girls are more likely than boys to report participation in environmental activities in almost all countries and economies, with the largest gender gap favouring girls in Finland and Poland (with a gap of over 20 percentage points; Table I.B1.5.33). Socio-economically advantaged students are more likely to report their participation in environmental activities than disadvantaged students in a majority of countries and economies.
As discussed later in this chapter (Figure I.5.11), students reporting such short-term commitment tended to report more positive attitudes towards the environment in all of the three indicators examined in this chapter in all participating countries and economies, and obtained higher scores in environmental science in about half of participating countries and economies (Table I.B1.5.34).
Percentage of students who participated in at least one environment-related activity in the year prior to the PISA test


1. A socio-economically advantaged (disadvantaged) student is a student in the top (bottom) quarter of the PISA index of economic, social and cultural status (ESCS) in his or her own country/economy.
Countries and economies are ranked in descending order of the percentage of students participating in at least one environment-related activity.
Source: OECD, PISA 2025 Database, Table I.B1.5.33. See https://stat.link/2miwbs for the underlying data.
Reasons for not participating in environment-related activities
As shown in Figure I.5.9, among the 28% students who reported never participating in any of the five environmental activities examined in PISA 2025, the most common reason for non‑participation was not knowing anyone engaged in environmental actions: on average across OECD countries, 56% selected this option, with shares ranging from 29% in Uzbekistan to 77% in Korea (Table I.B1.5.35). Two other reasons were also frequently cited: on average across OECD countries, 49% of students said they did not participate because they believed someone else would take care of the problem (with shares ranging from 32% in Armenia to 82% in Cambodia), and 47% said they felt their actions would not make a difference (ranging from 30% in Georgia to 61% in Brunei Darussalam). In addition, on average across OECD countries, 40% of students reported that they did not know how to participate, with national shares ranging from 25% in Kosovo to 63% in Brunei Darussalam.
Percentage of students who did not participate in environment‑related activities in the year prior to the PISA test and agreed or strongly agreed with the following reasons for not taking part

Note: Results in this Figure include only students who reported “never” participating in any of the five environmental activities included in the index of students’ participation in environment‑related activities over the past 12 months.
Source: OECD, PISA 2025 Database, Table I.B1.5.35. See https://stat.link/2miwbs for the underlying data.
Students who reported the statements shown Figure I.5.9 as reasons for their non-participation in environmental activities performed higher in environmental science than those who did not report so, except for the statement “I did not know how”, on average across OECD countries (Table I.B1.5.40). Among students who reported never having participated in any of the five environmental activities in the year prior to the PISA test, those who agreed or strongly agreed that “no one I knew was participating in activities to benefit the environment” scored 23 points higher in environmental science than students who disagreed or strongly disagreed with this statement, after accounting for students' and schools' socio-economic profile. The score-point difference for “I did not believe my actions will make a difference” is 9 points, and 5 points for “someone else will take care of the problem”. For “I did not know how”, no performance difference is observed according to students’ agreement with this statement, after accounting for students' and schools' socio-economic profile.
These results suggest that different types of support may be more effective depending on students’ performance levels. Lower-performing students may require support in developing knowledge and information about how to participate in environmental activities, whereas higher-performing students may benefit more from exposure to locally relevant examples and role models they can follow, which can help foster a sense of collective efficacy and purpose.
Career expectations to support the environment
For the first time in 2025, PISA asked 15-year-old students to what extent they were interested in contributing to protecting the environment in their future job. The responses reveal a generation that is highly motivated by environmental concerns. In almost all countries and economies, a clear majority of students reported being interested in pursuing an environment-related career to some extent or to a large extent. As shown in Figure I.5.10, in 56 countries, at least 60% of students reported such interest, and in 36 countries and economies, the share reached at least 70%. These results suggest that environmental engagement is not a niche preference but a mainstream aspiration among young people globally.
Gender differences, however, are pronounced. In nearly every country and economy, girls were more likely than boys to express interest in contributing to environmental protection in their careers. On average across OECD countries, 68% of girls and 54% of boys reported being interested, an average gender gap of 14 percentage points. In some education systems, such as Poland, Finland and Czechia, the gap exceeds 20 percentage points, while in only three countries/economies (Kenya, Lebanon and Chinese Taipei) is the gap not statistically significant (Table I.B1.5.42).
Socio‑economic differences are present but more modest. In about half of all participating education systems, socio‑economically advantaged students are more likely than disadvantaged students to express interest in contributing to environmental protection through their occupations, though the size of the disparity is smaller than the gender gap. On average across OECD countries, 63% of advantaged students and 60% of disadvantaged students reported being interested – an average gap of 4 percentage points – and in several countries and economies, no significant difference was observed (Table I.B1.5.42).
Importantly, students who express interest in contributing to environmental protection through their future work tend to perform higher in most countries and economies (Table I.B1.5.43). Students who reported that they are interested, to some or a large extent, in contributing to protecting the environment in their future job tend to perform higher scores in environmental science as well as in other domains assessed by PISA, including reading, mathematics and science, on average across OECD countries and in most countries and economies. This suggests that students with stronger academic foundations may also be more attuned to global issues and more likely to value environmental protection as part of their future professional identity. Students who are interested in protecting the environment through their future work may have the motivation and perseverance needed to acquire relevant knowledge and skills. While this association does not imply causation, it shows that academic performance and commitment to environmental protection often coexist.
Similarly, students’ interest in contributing to protecting the environment through their future occupations tend to report higher levels of attitudes in all countries and economies. This positive relationship is observed in all three attitudinal measures examined in this chapter: environmental awareness (Table I.B1.5.45); students' beliefs in their own capacity to generate environmental change (Table I.B1.5.44) and their beliefs in collective environmental efficacy (Table I.B1.5.46).
Taken together, these findings show that environmental purpose is emerging as a defining element of young people’s aspirations, but not all students are equally positioned to translate this purpose into future opportunities. While enthusiasm is widespread, girls show particularly high interest and socio‑economic gaps persist. Academically stronger students and students with pro-environmental attitudes are more likely to see environmental protection as part of their future career identity.
Percentage of students who reported an interest in contributing to protecting the environment in their future jobs ("to some extent" or "to a large extent")


1. A socio-economically advantaged (disadvantaged) student is a student in the top (bottom) quarter of the PISA index of economic, social and cultural status (ESCS) in his or her own country/economy.
Countries and economies are ranked in descending order of the percentage of students who are interested in contributing to protecting the environment in their future jobs.
Source: OECD, PISA 2025 Database, Tables I.B1.5.42 and I.B1.5.43. See https://stat.link/2miwbs for the underlying data.
Short-term and long-term environmental commitments are positively related. As shown in Figure I.5.11, students who reported short-term commitment (i.e. participating in at least one of the five environmental activities included in PISA 2025) also tended to report long-term commitment (i.e. interest in contributing to the environment through their future careers).
As previously outlined, students reporting short-term commitment tended to report more positive attitudes towards the environment in all of the three indicators examined in this chapter. These positive relationships are observed in almost all participating countries and economies (Table I.B1.5.34).
When it comes to performance, a positive relationship is less consistent across countries and economies. On average across OECD countries, students who participated in at least one environmental activity outperformed in environmental science those who did not participate in any of the activities. However, this pattern is observed only in about half of the countries and economies with available data, while around ten countries and economies show the opposite pattern, where students who did not participate tend to outperform those who did (Table I.B1.5.34).
Various environmental indicators, by students who reported participating in at least one environmental activity in the year prior to the PISA test and those who did not

Note: Difference between students who participated in at least one activity and those who did not is statistically significant for all indicators (see Annex A3).
Source: OECD, PISA 2025 Database, Table I.B1.5.34. See https://stat.link/2miwbs for the underlying data.
Environmentally “caring but not committed” students
Despite the general positive relationship between pro-environmental attitudes and participation in environment-related activities, some students who express strong pro-environmental attitudes do not translate these attitudes into environmental commitment.
On average across OECD countries, three out of four students reported they care for the environment, meaning that these are the students who agreed or strongly agreed that looking after the global environment is important to them (Figure I.5.12). A large majority of these students (90%) also reported they commit to environmental issues at least in either the short or long term. Short-term commitment is measured by participation in at least one pro-environmental activity. Long-term commitment is measured by students’ interest in contributing to environmental protection in their future jobs, reported as “to some extent” or “to a large extent.”
However, 7% of 15-year-old students reported caring for the environment but not being environmentally committed, as shown in Figure I.5.12. Such a mismatch between attitudes and commitment was minimal and less than 1% in Viet Nam, Indonesia and Kenya, while it reached up to 16% in Korea.
Percentage of students who display different combinations of care (whether they agreed or disagreed that "looking after the global environment is important to me") and environmental commitment

Notes: In the legend, caring refers to students who (strongly) agreed that “looking after the global environment is important to me” and not caring refers to those who (strongly) disagreed with this statement.
Environmentally committed students are those who participated in at least one environment-related activity or are interested in contributing to protecting the environment in their future jobs ("to some extent" or "to a large extent").
Countries and economies are ranked in descending order of the percentage of students who do not care for the environment.
Source: OECD, PISA 2025 Database, Table I.B1.5.17. See https://stat.link/2miwbs for the underlying data.
Boys are more likely to be environmentally “caring but not committed” (9%) than girls (6%), on average across OECD countries and in most participating countries and economies (Table I.B1.5.47). No countries/economies show an opposite pattern. The widest gender gap is found in Korea and Finland, with a difference of over 6 percentage points. In Korea, 19% of boys are environmentally “caring but not committed” compared to 13% of girls. In Finland, 11% of boys are environmentally “caring but not committed” compared to 5% of girls.
Socio-economically disadvantaged students are slightly more likely to be environmentally “caring but not committed” (8%) than advantaged students (7%), on average across OECD countries. But this pattern is observed only in one‑third of countries and economies with available data. The majority of countries and economies do not show socio-economic difference, and four countries and economies show an opposite pattern, in which advantaged students are more likely to be environmentally “caring but not committed” than disadvantaged students (Table I.B1.5.47).
Performance in environmental science also differs between “caring and committed” and “caring but not committed” students, but there is no consistent pattern across countries and economies. On average across OECD countries, environmentally “caring and committed” students tend to outperform those who are “caring but not committed”, but this pattern is observed in about one-third of the countries and economies while more than half show no difference (Table I.B1.5.48).
When it comes to learning opportunities in class, differences between these two groups are clearer and more consistent. While students’ reports on their opportunities for environmental learning in class are described in detail in the next section, a consistent pattern is observed across all countries and economies; environmentally “caring and committed” students reported that they have more opportunities for environmental learning in class than those who are “caring but not committed” (Table I.B1.5.49). For example, 49% of “caring and committed” students agreed or strongly agreed that their class discusses solutions to environmental issues, while 34% of “caring but not committed” students did so (Table I.B1.5.51). This result suggests the important role that schools can play in enhancing students’ environmental agency, helping to bridge students’ pro-environmental attitudes and their commitment to protecting the environment.
Opportunities for environmental learning in class
The opportunities for environmental learning in class can play an important role in shaping students’ environmental science literacy, attitudes and commitment by increasing their exposure to environmental issues through structured classroom activities.
As shown in Figure I.5.13, classroom-based activities tend to be more commonly reported by students than field trips. At the same time, participation rates differ markedly across countries and economies, highlighting considerable variation in students’ access to structured environmental learning opportunities across education systems.
Percentage of students who agreed or strongly agreed with each statement

Source: OECD, PISA 2025 Database, Table I.B1.5.54. See https://stat.link/2miwbs for the underlying data.
Figure I.5.14 shows the overall extent to which students are exposed to environmental learning opportunities within their regular classroom activities. There are wide differences across countries and economies, with the highest levels of exposure reported in Thailand, Indonesia, B-S-J-Z (China), Viet Nam and Malaysia, and the lowest in the Netherlands*, Belgium, Luxembourg, Germany, Austria and Japan, based on students’ reports.
Students enrolled in socio-economically disadvantaged schools reported having more opportunities for environmental learning in class compared to students in advantaged schools, on average across OECD countries and in about half of countries and economies with available data (Table I.B1.5.55). In contrast, in seven countries and economies, students in advantaged schools reported greater exposure to such opportunities. Similarly, students in rural schools reported more opportunities for environmental learning compared to those in urban schools, on average across OECD countries and in 34 countries and economies. The opposite pattern was observed in five countries and economies.

Note: The index of opportunities for environmental learning in class (OPENVLRN) is based on students’ reports of how frequently environmental topics are integrated into teaching and assessment. It is constructed from students’ self-reported agreement with the statements shown in Figure I.5.13.
Source: OECD, PISA 2025 Database, Table I.B1.5.54. See https://stat.link/2miwbs for the underlying data.
Students who reported encountering more environmental learning opportunities in class tend to hold more pro‑environmental attitudes, as shown in Figure I.5.15. Opportunities for environmental learning in class show consistent positive associations with pro-environmental attitudes. In every participating country and economy, students who reported more frequent classroom opportunities to discuss, investigate, research or be assessed on environmental issues display higher environmental awareness, stronger beliefs in their own capacity to generate environmental change, and greater collective environmental efficacy, even after accounting for students' and schools' socio‑economic profile (Table I.B1.5.57).
Furthermore, opportunities for environmental learning in class are consistently associated with students’ short- and long-term environmental commitment in all countries and economies with available data (Table I.B1.5.58). Short‑term commitment is defined here as students who reported participating in the past year in at least one environment‑related activity out of five activities examined in PISA 2025. Long-term commitment is defined through their interest in contributing to environmental protection in their future jobs. This association remains significant even after accounting for students’ and schools’ socio-economic profile.
In contrast, the associations between opportunities for environmental learning in class and students’ performance in environmental science are more mixed (Table I.B1.5.56). After accounting for students’ and schools’ socio-economic profile, the relationship with performance is positive in slightly less than one-third of countries/economies, negative in another one-third as well as on average across OECD countries, and not statistically significant in the remaining one-third, pointing to considerable cross‑national heterogeneity. This finding should be interpreted with caution and should not be interpreted as a causal relationship. Also, it is important to note that the measure of opportunities for environmental learning in class captures the presence of these environmental learning opportunities in classrooms, but does not capture their quality, pedagogical intensity or the amount of time students are exposed to them.
Number of countries and economies with positive, negative or no significant relationships between learning opportunities and three dimensions of environmental agency (performance, attitudes and commitment)

1. "Before" refers to regressions before accounting for students' and schools' socio-economic profile (measured by the PISA index of economic, social and cultural status (ESCS)). "After" refers to regressions after accounting students' and schools' socio-economic profile.
2. "Short-term commitment" refers to the percentage of students who reported participating in at least one environment-related activity in the year prior to the PISA test.
3. "Long-term commitment" refers to the percentage of students who reported being interested, to some or a large extent, in contributing to protecting the environment in their future jobs.
Source: OECD, PISA 2025 Database, Tables I.B1.5.56, I.B1.5.57 and I.B1.5.58. See https://stat.link/2miwbs for the underlying data.
A plausible explanation for this positive association with attitudes and commitment is that classroom opportunities make environmental issues more visible and personally meaningful to students. Discussing challenges, exploring solutions or engaging with environmental topics in class may encourage students to reflect on these issues and see themselves as capable of taking action. Such experiences can strengthen interest, concern and a sense of social responsibility – aspects closely linked to the environmental attitudes reported earlier in this chapter – and may, in turn, motivate students to participate in environment‑related activities. However, just providing environmental learning opportunities as described Figure I.5.13 may not be enough, as these learning opportunities are not systematically related to higher environmental science performance. These results suggest environmental learning opportunities need to be combined with effective teaching and learning to enhance students’ environmental science performance and to fully develop the three dimensions of environmental agency.
References
[1] OECD (2026), PISA 2025 Assessment and Analytical Framework, OECD Publishing, Paris, https://doi.org/10.1787/86c36975-en.
[2] OECD (forthcoming), PISA 2025 Technical Report, OECD Publishing, Paris.
[3] White, P. et al. (2023), “Agency in the Anthropocene: Supporting document to the PISA 2025 Science Framework”, OECD Education Working Papers, No. 297, OECD Publishing, Paris, https://doi.org/10.1787/8d3b6cfa-en.
← 1. Environmental science items constitute a subset of the items used to construct the science scale, presented in Chapter 2.
← 2. When science proficiency levels were first introduced in PISA 2006, they were defined across six levels, from Level 1 to Level 6. In PISA 2015, with science as the main domain for the second time, Level 1 was further subdivided into Level 1a and Level 1b to provide a more nuanced description of performance at the lower end of the proficiency scale.