Dan Andrews
Andrea Garnero
Sara Holttinen

Dan Andrews
Andrea Garnero
Sara Holttinen
This chapter examines various contractual clauses and agreements that restrict workers’ activities after leaving their employer, with a particular focus on non-compete clauses. It provides an overview of how non-compete clauses are regulated across OECD countries. It then introduces the first harmonised cross-country evidence – based on novel employee‑ and employer-level surveys for 15 OECD economies – on the prevalence of non-compete and related clauses and (firm-to-firm) no-poaching and wage‑fixing agreements. The chapter also presents empirical results on the association between non-compete clauses, wages and productivity. Finally, it discusses policy options to better balance the protection of legitimate business interests with the need to support worker mobility and market dynamism.
Over the past 20 years, the productivity slowdown – underpinned by low rates of job mobility, firm entry and knowledge diffusion – has been accompanied by rising concerns over wage bargaining power in many OECD countries. One factor that could contribute to explaining these headwinds is the rising use of post-employment restraint clauses, which prevent workers from joining (or starting) a competing firm (non-compete clauses); the disclosure of confidential information; or the poaching of former co-workers or clients. While the use of such restraints was originally justified on the basis that they protect legitimate business interests, such as trade secrets, there are concerns that they are increasingly being deployed to stifle job mobility and competition.
In fact, this chapter finds that the prevalence of non-compete clauses is surprisingly high and rising, and that such clauses have spread well beyond knowledge‑intensive activities to jobs where access to confidential information is limited. The evidence in this chapter – while preliminary – suggests that such clauses tend to reduce productivity growth – by impeding the forces of growth-enhancing job reallocation and knowledge diffusion – and wage growth – by limiting workers’ outside options. In countries where non-compete clauses are more tightly regulated, there is some evidence to suggest that the economic “bite” on productivity may be more modest, but still negative. This is consistent with the tendency for such clauses to exert a chilling effect on worker mobility, even when their use is restricted, to the extent that workers may lack awareness of the legitimacy of such clauses.
The chapter provides new harmonised cross-country evidence into the prevalence and economic impacts of non-compete and related clauses. The empirical analysis is based on surveys of firms and employees for 15 OECD countries: Belgium, Canada, France, Germany, Italy, Japan, Korea, Mexico, New Zealand, Poland, Portugal, Spain, Sweden, Switzerland and the United Kingdom. The chapter also features a new policy index for all OECD countries that measures: i) the regulatory framework (who regulates non-compete clauses – the law, courts, or collective agreements – and what is regulated); ii) the terms of exchange (e.g. any compensation requirements for signing non-compete clauses); and iii) the procedural requirements, judicial modification powers, validity after dismissal and sanctions for overly broad agreements.
Firms are increasingly deploying a variety of contractual devices to restrict an employee’s activity after they leave their current job. The most common is a non-disclosure agreement (NDA), which cover around one‑half of private‑sector employees in the 15 OECD countries analysed in the chapter, while between one‑fifth and one‑third of the workforce are bound by non-compete clauses. At the same time, between one‑tenth and one‑fifth of employees are subject to clauses that prohibit the solicitation of clients and co-workers and/or provisions for the repayment of bonuses or training costs when they depart a firm.
Non-compete clauses typically receive most attention in economic policy debates since they directly limit the ability of workers to join (or start) a competing firm. The prevalence of non-compete clauses is higher than expected based on two benchmarks. First, contrary to the original intent, non-compete clauses have spread well beyond knowledge‑intensive occupations to cover many low skilled employees who lack access to confidential information. There is little variation in the use of non-compete clauses by training, growth or innovation activity of firms. Non-compete clauses are also applied indiscriminately and are rarely a bargained outcome. Second, the duration and scope of such clauses is often broader than one would expect based on national regulatory frameworks, partly reflecting lack of awareness of firms regarding the legal requirements. Meanwhile, firms have increased their use of non-compete clauses over the past five years – a pattern that is also evident for other restraint clauses.
Unlike non-compete clauses – which are included in individual employment contracts and have been regulated for centuries – firm-to-firm agreements that restrict competition for labour through co‑ordination among employers are typically considered an illegal practice by antitrust authorities. Yet, this chapter presents evidence that (firm-to-firm) no-poaching and wage‑fixing agreements may be more widespread than previously assumed. Almost one‑half of firms surveyed report being aware of no-poaching, wage‑fixing or both practices within their industry. One‑sixth of employees report being prevented from joining another firm due to a no poaching agreement and one‑quarter report having heard of such practices.
A range of empirical studies demonstrate the adverse effects of non-compete clauses on job mobility and firm entry. Consistent with this, evidence from new OECD surveys shows that a meaningful share of all private‑sector employees have been stopped from moving jobs (5%) or starting a new business (3%) due to having a non-compete clause.
By reducing the number of outside options and reducing worker’s bargaining power, non-compete clauses also suppress wages. New OECD evidence finds that workers bound by non‑compete clauses move up the earnings distribution more slowly – on average about three percentiles less over a 25‑year career – than comparable workers without such restrictions.
In addition, such clauses could reduce productivity by impeding reallocation and the spread of leading ideas. But evidence on this question has been scarce outside of the United States, which in turn motivates a cross-country firm-level econometric analysis of the links between non-compete clauses and productivity performance. A 10‑percentage point (p.p.) increase in the prevalence of non-compete clauses at the industry level is associated with a decline in the level of aggregate (business sector) labour productivity of 1.9%. While not identifying a purely causal relationship, this reflects two key channels:
Weaker labour reallocation: the extent to which labour flows to more productive firms could decline by one‑sixth, which would be associated with a reduction in aggregate productivity by an estimated 0.3%.
Slower knowledge diffusion: the rate of productivity convergence of laggard firms to the global frontier could decline by an estimated 5%. This would imply a reduction in labour productivity growth of 1.8% for the median firm, which would correspond to a reduction in the level of aggregate productivity by 1.6%.
By contrast, the link between non-disclosure agreements (NDAs) and productivity is much weaker than for non-compete clauses, suggesting that there may be less distortive alternatives to protect firm’s business interests than mobility-sapping non-compete clauses.
Finally, in industries where the share of firms aware of non-poaching agreements being deployed is higher, the extent of productivity-enhancing reallocation tends to be weaker, consistent with the adverse effects of non-poaching agreements on job mobility.
The regulation of non-compete clauses varies significantly across OECD countries, ranging from Colombia and Mexico where such clauses are prohibited (but unsanctioned) to a group of countries (e.g. Korea, Australia and New Zealand) that currently adopt a more permissive stance. These latter regimes rely largely on judicial reasonableness tests, limited mandatory compensation requirements, and relatively flexible rules.
While the prevalence of non-compete clauses does not vary systematically across regulatory regimes, the economic bite of non-compete clauses appears to be larger in countries where they are easier for firms to use. In such countries, a 10‑p.p. increase in the prevalence of non-compete clauses is associated with a 2% decline in aggregate productivity. Though the precision of the estimates is lower when comparing countries with different regulatory regimes, the results suggest that the productivity cost may be lower in countries where non-compete clauses are harder to use, though still material at around 1.5%. This illustrates the potential for non-compete clauses to exert a chilling effect on worker mobility even when their use is restricted.
The high and rising prevalence of non-compete clauses coupled with evidence of the adverse consequences for productivity and wages – even in countries where they are more tightly regulated – raises questions about whether current policy frameworks are fit for purpose. Proposals to restrict the use of non-compete clauses have recently emerged in some countries, ranging from outright bans to targeted safeguards that aim to limit abuse while preserving legitimate business interests (e.g. sector-specific prohibitions, exemptions for certain workers, or monetisation). But questions also emerge regarding the clarity and transparency of current legal frameworks and whether sanctions and enforcement actions by authorities are required to prevent the unlawful use of non-compete clauses by firms.
Finally, evidence of (firm-to-firm) no-poaching and wage‑fixing agreements and their attendant consequences for productivity and wages underscores the importance and continued relevance of recent enforcement actions by competition authorities.
Since the late 1990s, growth in potential output per capita has declined by about 1 p.p. across the OECD, underpinned by a pronounced slowdown in labour productivity growth (OECD, 2025[1]). While a range of structural headwinds have contributed to the productivity slowdown, perhaps the most prominent is the decline in economic dynamism, which encompasses all the ways in which firms and workers have become less likely to explore new patterns of economic activity: starting new, innovative firms; switching jobs; and moving residence (Shambaugh, Nunn and Liu, 2018[2]; OECD, 2025[3]). Declining dynamism has reduced aggregate productivity growth by hindering the matching of skills to jobs, the reallocation of workers to more productive firms, and the diffusion of knowledge associated with firm entry and job mobility. It has also reduced worker wage bargaining power by limiting the frequency with which workers receive outside offers and make wage‑enhancing job transitions.
While economic dynamism has declined due to a number of structural reasons (e.g. population ageing or the rising importance of firm-specific human capital in the intangible economy that could lengthen job matches), there is a sense that growing barriers to labour mobility have also sapped the vitality of OECD economies. The decline in economic dynamism could reflect a rise of adjustment frictions that rein in the creative destruction process (Decker et al., 2020[4]) which is instrumental to economic growth (Aghion and Howitt, 1992[5]). While recent analysis has also linked declining dynamism to a growing regulatory environment (OECD, 2025[1]), the spread of non-compete and related clauses – which prevent workers from joining (or starting) a competing firm (non-compete clauses); the disclosure of confidential information (non-disclosure clauses); or the poaching of former co-workers or clients (non-solicitation clauses) – is also consistent with declining dynamism.
A focus on non-compete and related clauses is further motivated by a growing body of evidence documenting widespread employer monopsony power in many OECD labour markets – a condition where limited competition for hires allows employers to secure higher profits by keeping employment and wages lower than what would prevail in an efficient market (Azar and Marinescu, 2024[6]; OECD, 2019[7]; OECD, 2022[8]; OECD, 2022[9]). Frictions such as search and information costs, non-wage job preferences and limited employer competition within local or occupational labour markets can give firms substantial wage‑setting power. Non-compete clauses and related contractual restrictions can play a similar role by directly limiting workers’ outside options and reducing their ability to secure better wages and working conditions by changing jobs or credibly threaten to leave for alternative employers (OECD, 2019[7]).
This chapter contributes to OECD work on declining economic dynamism and widespread monopsony power by taking a deep dive into restraint clauses that may unduly restrict workers’ outside options and labour market dynamism. While such clauses can serve legitimate purposes (i.e. by protecting trade secrets or client relationships), non-compete and related clauses may stifle workers’ ability to move to jobs where their skills are most productively used, the diffusion of knowledge across firms and market competition. Drawing on two novel surveys of employers and workers, this chapter provides the first systematic harmonised cross-country evidence on the incidence and characteristics of non-compete and related clauses across 15 OECD countries. In addition, this chapter provides some first evidence on the spread of no-poaching and wage‑fixing arrangements. Unlike non-compete clauses – which are included in individual employment contracts and have been regulated for centuries – no-poaching and wage‑fixing arrangements are firm-to-firm agreements which restrict competition for labour through co‑ordination among employers and are increasingly scrutinised by competition authorities as illegal practices related to collusion.
The chapter proceeds as follows. Section 5.1 reviews the economic rationale for non-compete clauses, setting out both the arguments in favour of their use and the related potential efficiency costs and distributional issues. Section 5.2 describes the regulatory frameworks governing non-compete clauses across OECD countries and introduces a new index capturing cross-country differences in their design and regulation, which is subsequently used in the empirical analysis. Section 5.3 presents the main findings from the employee and employer surveys on the prevalence, characteristics and use of non-compete and related clauses. Section 5.4 builds on the existing literature to present new cross-country evidence on wages and productivity, drawing on the survey and firm-level data. Section 5.5 discusses policy options and highlights the importance of effective enforcement in aligning the use of non-compete clauses with their legitimate objectives, while Section 5.6 offers some concluding remarks.
Non-compete and related clauses – see Box 5.1 for the list of the most typical clauses that can be found in employment contracts in OECD countries – are contractual provisions that restrict employees’ activities after the termination of an employment relationship. These provisions may prohibit workers from joining a competing firm, starting a competing business, or soliciting former clients or colleagues, typically for a defined period of time and within a specified geographic or occupational scope. Such clauses may be included in initial employment contracts or introduced later during the employment relationship.
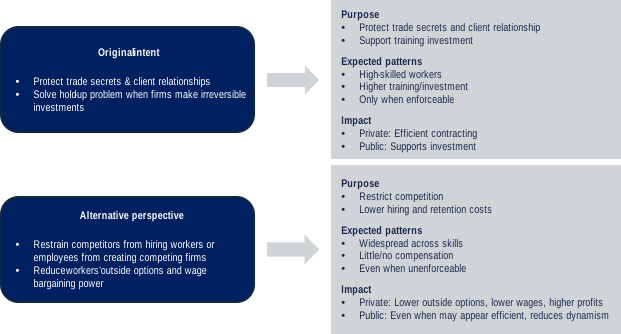
In most OECD countries, non-compete and related clauses are permitted under statutory law or case law and were originally justified as instruments to protect legitimate employer interests, such as trade secrets, confidential information,1 client relationships, or firm-specific investments in training (Starr, Prescott and Bishara, 2021[10]). From this perspective, such clauses are intended to address a “hold-up problem” that can arise when firms make costly and partially irreversible investments in workers (e.g. specialised training or the sharing of proprietary knowledge) that departing employees may otherwise expropriate absent contractual protections.2 Thus, by limiting post-employment job mobility for a defined period after separation, non-compete clauses may allow firms to internalise a larger share of the returns to such investments, thereby incentivising investments in training, knowledge sharing, and innovation. In principle, if these clauses improve joint surplus, firms would be expected to compensate workers for the associated restrictions, for example through higher wages or training opportunities. According to this original “efficient contracting” perspective, non-compete clauses are potentially welfare‑enhancing arrangements that emerge from voluntary agreement between informed parties and operate primarily to protect specific assets rather than to suppress competition (Rubin and Shedd, 1981[11]).3
The literature typically distinguishes between six clauses included in individual employment contracts which are usually permitted and regulated in most OECD jurisdictions (see Section 5.2 below):
Non-compete clause: a stand-alone agreement or a clause of a contract which prevents an employee from working for a competitor or starting a new company after they separate from their employer for a predetermined period of time.
Non-disclosure agreement: a contract (or stand-alone agreements) or clause that prohibits an employee from sharing or using confidential or proprietary information obtained during the employment relationship.
Non-poaching of co-workers or non-recruitment/non-solicitation of colleagues: a contract or clause that prevents a former employee from soliciting or hiring former colleagues.
Non-solicitation of clients: a contract or clause that prohibits a former employee from soliciting business from the employer’s clients or customers.
Repayment of training costs clause: a contract or clause that requires an employee to repay employer-provided training costs upon departure from the firm.
Repayment of benefits and bonuses clause: a contract or clause that requires an employee to repay certain benefits or bonuses, such as a signing bonus, if the employee ceases employment within a certain period of time.
A second type of agreements consists of firm-to-firm practices that restrict competition for labour:
No-poaching agreements: agreements between employers not to recruit each other’s employees. These may take the form of (i) no-hire agreements, where employers agree not to hire workers from other parties to the agreement, either actively or passively; or (ii) non-solicitation (or no-cold-calling) agreements, where employers commit not to actively approach another firm’s employees with job offers.
Wage‑fixing agreements: agreements between employers to set wages or other forms of compensation or benefits at specified levels. These should not be confused with collective bargaining agreements signed between employers and trade unions.
Wage‑fixing agreements constitute a violation of antitrust law in most OECD countries. No-poaching agreements are also generally regarded as anticompetitive practices but, in some cases, a distinction must be made as to the purpose for which they are concluded. For example, in the case of mergers, they are permissible for a certain period of time among merging employers. These practices have only recently come under closer scrutiny by competition authorities in OECD countries, as awareness has grown that labour market competition can also be restricted through co‑ordination among employers.
At the same time, to the extent that they restrict job-to-job mobility (see Figure 5.1), non-compete clauses can impose substantial economy-wide costs, even in the case when the clauses are used in line with the original intent and are privately efficient. First, since job mobility is a key driver of aggregate wage growth – both for workers who move and for those who remain with their employer – restrictions on mobility can weaken workers’ bargaining power, even for those not subject to non-compete clauses (Moscarini and Postel-Vinay, 2016[12]; Johnson, Lavetti and Lipsitz, 2025[13]). Second, job mobility supports aggregate productivity growth (OECD, 2025[3]) by fuelling knowledge diffusion across firms and the reallocation of scarce resources to their most productive use. From this perspective, non-compete clauses may not only work to shift surplus from workers to firms but also raise an efficiency concern, which would be reinforced if such clauses dampen product market competition (Lipsitz and Tremblay, 2024[14]) by discouraging spin-offs and the formation of new firms.4 This product market dimension extends to commercial relationships more broadly: Patault and Lenoir (2024[15]) show that competition between firms in recruiting a sales manager is not a zero-sum game but expands the total number of buyer-supplier connections rather than merely redistributing them.
Some scholars have begun to question the primary purpose of non-compete clauses themselves. Greenwood, Kobayashi and Starr (forthcoming[16]) show that bans on non-compete clauses in US states have not led to an increase in trade‑secrets litigation, and Cowgill, Freiberg and Starr (2024[17]) show, in a randomised control trial, that removing non-compete clauses does not result in a greater disclosure of sensitive professional information.
Related clauses (see Box 5.1) are sometimes viewed as less distortive substitutes but also carry risks, prompting growing policy scrutiny in recent years.5 For example:
Non-disclosure agreements (NDAs) are often considered more benign than non-compete clauses because they aim to protect specific information rather than restrict job mobility. But broadly drafted NDAs may act as de facto non-compete clauses, discouraging worker mobility by creating legal uncertainty about what constitutes prohibited disclosure (Hrdy and Seaman, 2024[18]).
Non-solicitation of co-worker clauses have come under increased scrutiny given that there is little evidence to support the notion that they protect trade secrets, customer goodwill or investments in training (Graves, 2022[19]).
Repayment of training agreements are often portrayed as a more targeted alternative than non-compete clauses, as they apply only when a worker leaves before the employer has recouped its training investment. Yet, since firms can inflate training costs or workers may not fully understand repayment obligations, such clauses can impose high exit costs that deter job changes even when no competitive harm is involved (Harris, 2021[20]).
The tension around non-compete clauses between the original intent and the alternative economic perspective and between private and public interest has long been reflected in evolving legal doctrines and a patchwork of policy approaches across OECD countries. Since the first known case in the United Kingdom in 1414 which saw the employee winning, later jurisprudence adopted a more permissive stance, allowing non-compete clauses when deemed “reasonable” and necessary to protect legitimate interests – see Box 5.2 for a brief history of non-compete clauses. What constitutes “reasonableness,” however, has varied widely across countries and over time (Bishara, 2011[21]). Jurisdictions differ, for example, in whether non-compete clauses are valid also after dismissal, whether courts may modify overly broad clauses, and whether additional compensation is required when restrictions are introduced during employment. Notably, a small number of states in the United States, such as California, North Dakota and Oklahoma, prohibited employee non-compete clauses altogether in the late nineteenth century, while others have pursued more recent reforms, including Minnesota’s comprehensive ban adopted in 2023.
These two perspectives generate distinct empirical predictions. If non-compete and related clauses primarily serve to protect trade secrets or to support investment in training, their use should be concentrated among workers with access to confidential information or in occupations where firm-specific or industry-specific human capital is particularly important. If, instead, non-compete and related clauses are used at least in part to limit worker mobility and bargaining power, they are likely to be more pervasive across occupations, including among lower-skilled workers with limited access to trade secrets. Under this scenario, such clauses may be introduced without meaningful negotiation, offer little or no compensation, and sometimes be used even when they are unlikely to be upheld in court, yet deter job mobility through their chilling effect.
Although non-compete and related clauses have attracted renewed attention in recent years – particularly following numerous state and federal initiatives in the United States – their origins stretch back several centuries (Blake, 1960[22]). Figure 5.2 summarises key legal and policy milestones.
The earliest recorded dispute dates to 1414, when an English apprentice, John Dyer, was sued for breaching a promise not to practise his trade in the town where he had been trained. The court refused to uphold the restriction, considering it incompatible with common law principles of economic freedom. Over time, however, attitudes began to shift. In 1621, the English courts upheld a restraint in Broad v. Jollyffe, and the landmark judgement in Mitchel v. Reynolds (1711) established the foundational principle that only “reasonable” clauses can be considered legally valid. This reasoning shaped the evolution of non-compete doctrine in many jurisdictions and still underpins contemporary approaches.
During the nineteenth century, courts continued to refine the criteria for assessing the legitimacy of non-compete clauses, and US states began introducing statutory rules. Some jurisdictions chose to prohibit such clauses altogether – California (since 1872), North Dakota (since 1865), and Oklahoma (since 1 890) remain notable examples.

Note: The chart does not provide a comprehensive overview of policy initiatives in OECD countries. In particular, several countries introduced or updated their civil or labour codes during the 20th century, thereby introducing or formalising statutory rules regarding non-compete clauses and this is not represented in the chart.
Source: Building on and extending the information available at https://faircompetitionlaw.com/2021/10/11/a-brief-history-of-noncompete-regulation/ (accessed on 8 December 2025).
In the early 2000s, several OECD countries and US states revisited the regulation of non-compete agreements, introducing new limits or procedural safeguards. The debate intensified around 2014, sparked by high-profile cases – such as fast-food workers in the United States being required to sign non-compete clauses – and by emerging evidence showing that these clauses were far more prevalent than previously understood (Starr, Prescott and Bishara, 2021[10]). As policy momentum grew, reforms proliferated across multiple US states and in several European countries (Bishara and Luisetto, 2025[23]).
The regulation of non-compete clauses varies widely across OECD countries, reflecting differences in legal traditions, labour market institutions, and policy priorities. At a broad level, countries can be positioned along a spectrum ranging from those where non-compete clauses are banned (such as Mexico, Colombia, or California in the United States), to those where such clauses are permitted only under strict conditions (including most EU member states and Japan), and finally to those where courts are generally more willing to uphold non-compete agreements (notably Israel, and several US states). National regimes differ not only in their overarching legal stance but also with respect to the scope of protectable employer interests, compensation requirements, maximum duration, the validity of such clauses in case of dismissal, and the role of collective agreements. As a result, workers in similar occupations can face markedly different restrictions on post-employment mobility depending on the country in which they are employed.
To capture these differences in a systematic way, a new OECD regulatory index builds on and extends the methodology originally developed by Bishara (2011[21]) to capture cross-state variation in the United States – see Box 5.3. The resulting OECD non-compete regulation index captures national regimes along nine key dimensions, covering the regulatory level, the role of collective bargaining, the content of the clauses (duration, geographical and sectoral scope, compensation), the possibility of judicial modifications and the presence of sanctions. Figure 5.3 presents the results of the new index, which by construction ranges from 0 to 700 and is increasing in the ability of firms to deploy non-compete clauses. Before proceeding, however, it should be stressed that this metric reflects the state of play in 2025 and thus reforms currently being discussed to restrict the use of non-compete clauses (such as in Australia, Canada, the Netherlands and the United Kingdom) are not included but would impact country scores and rankings if implemented.
The OECD non‑compete index adapts and substantially extends the methodology first introduced by Bishara (2011[21]) to measure the stringency of regulation of non‑compete clauses across US states. Whereas the Bishara index was limited to seven legal dimensions relevant to US jurisdictions, the OECD index expands the framework to capture the broader institutional diversity of OECD countries and to reflect regulatory features not present in the United States when the index was developed.
The OECD index scores nine legal dimensions: (1) Statutory regulation (whether legislation governs non‑competes and, if so, the maximum duration, and geographic and sectoral scope); (2) Collective agreements (whether sectoral or firm‑level agreements add limits or conditions beyond law); (3) Employer’s protectable interest (how broadly “legitimate interests” are defined); (4) Compensation (if monetary compensation is required and any minimum threshold); (5) Changes during employment (whether a new clause after hiring needs fresh consideration); (6) Burden of proof (the elements that an employer needs to bring an employee to court); (7) Judicial modification, also called “blue pencilling” (courts’ power to narrow overbroad clauses); (8) Dismissal (if the clause can be used even in the case of dismissal); (9) Sanctions (whether employers face penalties for using invalid clauses).
Each dimension is scored on a 0‑10 scale, with higher values indicating lower stringency and therefore a more employer‑friendly regime. These scores are weighted (weight 5 or 10), based on their practical importance. The methodology incorporates wage thresholds, halving relevant dimension scores when non‑competes are permitted only for higher‑earning employees. Data collection relied on a three‑step process: (i) detailed review of national statutes, case law, regulatory guidance and academic sources, (ii) validation via questionnaires sent to relevant government bodies in member countries, and (iii) systematic legal coding using an updated and transparent scoring rubric.
The OECD index preserves the conceptual core of Bishara’s original framework but introduces two new dimensions – the role of collective agreements and the presence of sanctions – which are essential in many OECD jurisdictions but absent in the US context. It also refines the scoring rubric to accommodate a wider set of regulatory options, such as statutory compensation thresholds, sector‑specific rules, and the validity in case of dismissal. While the OECD index remains highly correlated with Bishara’s original methodology (rank correlation 0.93), some countries shift rank position due to these added dimensions and the greater granularity of the OECD scoring methodology. Using the same weight for all components also delivers a very similar ranking (rank correlation 0.97). Overall, the OECD index provides a richer, more internationally comparable measure of regulatory strictness, enabling analysis of regimes that differ fundamentally from the US in the design, purpose and regulation of non‑compete clauses. More details are available in Andrews et al. (2026[24]).
With these caveats in mind, there is significant cross-country heterogeneity in national regulatory frameworks, with three broad groups emerging. First, at the lower end of the distribution, Mexico and Colombia stand apart as clear outliers, reflecting constitutional prohibitions of restraints on work combined with the absence of sanctions against employers who nonetheless include non-compete clauses in contracts. A second group of countries, including several EU member states such as Belgium, Germany, Poland and Sweden, cluster at relatively low-to-middle scores. These jurisdictions typically allow non-compete clauses only under strict statutory conditions, frequently mandate minimum compensation, and often limit their use following dismissal. Finally, at the upper end of the distribution, Israel, the United Kingdom, Australia6 and New Zealand adopt a more permissive stance, relying largely on judicial reasonableness tests, limited mandatory compensation requirements, and relatively flexible rules. The figure also reveals significant cross-country dispersion, which has parallels with the variation previously documented across US states by Bishara (2011[21]). Overall, the regulation in most OECD countries is more stringent than in the majority of US states. For example, Indiana, which was the median state in terms of regulation according to Bishara (2011[21]) in 2025 scores higher than most OECD countries.7
Higher values indicate that non‑compete clauses are more likely to be upheld in court (i.e. a regime more favourable to companies)

Note: The index measures the restrictiveness of non-compete clause regulations on a 0‑700 scale, where higher scores indicate more employer-friendly (less restrictive) environments. The OECD index scores nine legal dimensions: (1) Statutory regulation (whether legislation governs non‑compete clauses and, if so, the maximum duration, and geographic and sectoral scope) with weight 10; (2) Collective agreements (whether sectoral or firm‑level CBAs add limits or conditions beyond law) with weight 5; (3) Employer’s protectable interest (how broadly “legitimate interests” are defined) with weight 10; (4) Compensation (if monetary compensation is required and any minimum threshold) with weight 5; (5) Changes during employment (whether a new clause after hiring needs fresh consideration) with weight 5; (6) Burden of proof (the elements that an employer needs to bring an employee to court) with weight 5; (7) Judicial modification, also called “blue pencilling” (courts’ power to narrow overbroad clauses) with weight 10; (8) Dismissal (if the clause can be used even in the case of dismissal) with weight 10; (9) Sanctions (whether employers face penalties for using invalid clauses) with weight 10. The score for Canada excludes the province of Ontario which is evaluated separately.
Source: Andrews et al. (2026[24]), “The regulation of non-compete clauses across OECD countries”, https://doi.org/10.1787/88e3eb6e-en.
Beyond the aggregate scores, Figure 5.3 provides insight into the sources of cross-country variation by disaggregating the index across its nine dimensions. Three broad patterns emerge:
First, there is considerable convergence across countries in terms of the substantive legal standards governing non-compete clauses. In two OECD countries (Colombia and Mexico) and five US states, non-compete clauses are banned. In Austria, Belgium and Luxembourg as well as Ontario in Canada and 11 US states8 non-compete clauses are banned for workers earning less than a given wage threshold or not in top executive positions (Australia has announced a similar ban for 2027 while Canada put forward a proposal to restrict the use of non-compete clauses to executive positions in federally regulated sectors such as banking, telecommunications and transport). Where non-compete clauses are legal, courts and regulators – whether they apply statutory provisions or developing case law alone – tend to rely on similar reasonableness and proportionality tests. There is also relatively little variation in how legitimate employer interests are defined. Similarly, the burden of proof is typically placed on employers and often extends beyond a general reasonableness assessment to include compliance with procedural or substantive requirements. These common features suggest a shared baseline understanding of the need to justify the use of non-compete clauses across OECD countries.
Second, substantial heterogeneity arises in the mechanisms used to protect workers, particularly with respect to compensation, collective bargaining, and dismissal-related rules. Countries with more extensive statutory frameworks – predominantly, but not exclusively civil law jurisdictions – are more likely to require explicit compensation for non-compete clauses and, in several cases, to impose minimum compensation thresholds (some civil law jurisdictions such as the Netherlands, Switzerland and Türkiye do not require separate compensation). By contrast, in common law countries (e.g. Australia, Canada, Ireland, New Zealand and the United Kingdom) the acceptance of employment is generally considered sufficient consideration for the inclusion of a non‑compete clause, meaning that employers are not required to provide separate compensation for such restrictions. Similarly, collective agreements play no role in many countries but substantially limit the use of non-compete clauses in others, most notably France and Sweden, where sectoral bargaining introduces additional limitations beyond statutory or judicial rules.
Third, procedural rules to define when a non-compete clause can be considered as valid are an important driver of divergence. Countries differ sharply in whether courts may modify overbroad non-compete clauses, whether their validity depends on the circumstances of dismissal, and whether employers face any sanctions for using invalid clauses.9 Judicial modification practices range from a strict invalidation approach (Belgium, Chile, Costa Rica, Denmark, Estonia, Finland, Hungary, Japan, Portugal and Slovenia) to broad discretionary adjustment (Australia, Austria, Czechia, France, Greece, Iceland, Ireland, Israel, Korea, Lithuania, Luxembourg, the Netherlands, New Zealand, Norway, Poland, the Slovak Republic, Sweden, Switzerland, Türkiye and the United Kingdom). Likewise, some countries allow non-compete clauses to remain valid regardless of who initiates termination, while others restrict their use following dismissal without good cause. Remarkably, sanctions against employers are almost entirely absent: with the exception of Spain, Ontario (Canada) and some US states, no OECD country penalises employers for attempting to use invalid or overly broad non-compete clauses.
Concerning the other post-employment clauses, countries generally apply similar reasonableness standards, requiring that they be proportionate in scope and duration and protect legitimate business interests – see Andrews et al. (2026[24]) for the details. Gardening leave arrangements – where employees remain on payroll while being excused from duties and prohibited from working for competitors – are permitted in most countries, though several jurisdictions (Belgium, Costa Rica, Italy, Mexico, Portugal and Spain) prohibit requiring employees to abstain from work during notice periods, even with full pay, as this would infringe on the constitutional right to work. Concerning training cost repayment, while most countries allow employers to recoup investments in employee development, some impose specific statutory requirements: Belgium, Czechia, Denmark, Germany, Latvia, Lithuania, the Netherlands, Poland, Portugal, the Slovak Republic and Spain regulate these clauses to ensure they cover only non-mandatory training that provides genuine career advancement, apply reasonable repayment periods, and remain proportionate to the benefit received by the employee.
Taken together, these results show a significant difference in the regulation of non-compete and related clauses, ranging from full bans like in Colombia and Mexico to partial bans in Austria, Belgium, Luxembourg and Ontario (Canada) to more tailored regulations concerning the scope of the clauses, their compensation and procedural rules. This analysis as well as the index specific to non-compete clauses provide a key input for the remainder of the chapter, informing the cross-country benchmarking of non-compete prevalence, and the empirical analysis of whether and how these clauses affect economic outcomes.
This section presents new evidence on the use of non-compete and related clauses in 15 OECD countries – Belgium, Canada, France, Germany, Italy, Japan, Korea, Mexico, New Zealand, Poland, Portugal, Spain, Sweden, Switzerland and the United Kingdom. It draws on two surveys, an employee‑level and a firm-level one, developed by the OECD and Bocconi University and fielded by Ipsos, a professional survey company – see Box 5.4 for more detail. Combining a large, detailed online survey of employees with a complementary phone‑based survey of firms provides a robust empirical framework for analysing the incidence and characteristics of non-compete and related clauses. The use of both employee‑ and firm-level data helps address well-known limitations of online survey instruments and potential measurement error arising from incomplete awareness or recall of contractual terms.
The 15 countries covered span co‑ordinated market economies with strong collective bargaining systems (e.g. Belgium and Sweden), labour markets characterised by limited employment protection (e.g. the United Kingdom and New Zealand), and mixed systems combining statutory protections with varying degrees of social partnership (e.g. France, Italy, Spain). The sample also includes countries with distinct institutional settings in Asia, such as Japan and Korea, where firms and workers often engage in more long-term, structured employment relationships than in many other OECD countries, as well as Poland, which is representative of Central and Eastern European labour markets which have undergone major structural and regulatory adjustment. Federal countries, such as Canada and Mexico, further illustrate how regulatory competencies are shared across levels of government.
It could be expected that different labour market models may influence both the prevalence and the impact of non-compete clauses. In labour markets with strict employment protection, lower labour mobility may reduce employers’ incentives to use non-compete clauses, although stronger hold-up concerns10 around training and job-specific investments may increase their appeal. In systems with high reliance on fixed-term contracts, non-compete clauses may be less common due to shorter employment relationships. The presence of sectoral collective bargaining can limit the unilateral imposition of mobility restrictions, but co‑ordination among employers may also facilitate such practices. In reality, the results below show that, notwithstanding some variation across countries, non-compete and related clauses are present in all types of labour markets with a striking degree of similarity. This cross-country convergence is reflected in five central findings emerging from the survey data.
The OECD and Bocconi University jointly developed two surveys – one for employees and one for employers – to study the prevalence and characteristics of non-compete and related clauses in 15 OECD countries, which represent a variety of labour market and social models. The surveys follow methods used in earlier studies in the United States (Prescott, Bishara and Starr, 2016[25]), Australia (Andrews and Jarvis, 2023[26]; Andrews, Brennan and Buckley, 2024[27]) and Italy (Boeri, Garnero and Luisetto, 2025[28]) and were fielded by Ipsos – see Annex 5.A.
The worker-level survey targeted private‑sector employees aged 18‑64 in Belgium, Canada, France, Germany, Japan, Korea, Mexico, New Zealand, Poland, Portugal, Spain, Sweden, Switzerland and the United Kingdom. It combined: (i) a 2 000 private‑sector employee sample to estimate incidence of non-compete clauses; and (ii) a boost sample to reach 1 000 observations of employees with such clauses, enabling more detailed analysis. Sampling used online panels, with mixed selection methods. Panels applied quality checks to ensure valid, unique responses. The sample was stratified by age, sex and region (following official statistics), and balanced by education and sector. Post-stratification weights were constructed to align the sample with population characteristics. A pilot test preceded fieldwork. Data collection ran from July to mid-September 2025, yielding 31 762 completed interviews – country-specific information is available in Table 5.1.
As with any survey, selection bias may arise from: incomplete internet coverage, self-selection into online panels, and survey non-response. In practice, these risks appear limited. Internet access exceeds 90% in all countries except Mexico (72% in 2023). Panel bias is unlikely as panels are broadly representative and designed for general research. Non-response remains a concern, but the neutral framing of the survey invitation and the very low dropout rates (about 1%) suggest that selective attrition is limited.
The employer-level survey targeted individuals responsible for hiring and contracts in for-profit firms with five or more employees in the aforementioned countries plus Italy. Non-profits, micro‑firms and some sectors (public administration and defence, education, health and social work, household services, and extraterritorial organisations) were excluded. The sampling frame used Dun & Bradstreet, complemented with Orbis, based on NACE Rev 2 codes and firm size. A stratified random sampling design was applied across 16 cells, defined by four firm-size classes (5‑9; 10‑49; 50‑249; 250+) and four top-level NACE sector groups.
Given that most firms are very small, a mixed approach combined employee‑proportional and firm-proportional sampling. The former weights by employment size; the latter treats firms equally. Depending on the size of the available sampling frames (in particular of large firms), a 75% employee‑proportional / 25% firm-proportional allocation was used in Belgium, Canada, France, Germany, Italy, Japan, Korea, Mexico, Poland, Spain and the United Kingdom, while a 33% employee‑proportional / 67% firm-proportional allocation in Portugal, a 20% employee‑proportional / 80% firm-proportional allocation was used in Switzerland, an 18% employee‑proportional / 82% firm-proportional allocation was used in New Zealand and a 15% employee‑proportional / 85% firm-proportional allocation in Sweden.
A pilot test preceded fieldwork, which ran from June to September 2025 yielding 6 112 completed interviews with firms employing over 1.4 million employees in total – country-specific information is available in Table 5.1. Final weights were constructed based on the stratification cells (industry and firm size) to reflect the employee distribution in each country. Since the employer survey took place by telephone based on random sampling, internet and panel biases do not apply. Non-response bias may remain, but the neutral framing of the survey invitation and the low dropout suggest limited impact.
Note: Italy is not covered in the employee‑level survey because the OECD-Bocconi survey has been designed to be comparable to the one run in Italy by Boeri, Garnero and Luisetto (2025[28]), “Noncompete agreements in a rigid labor market: the case of Italy”, https://doi.org/10.1093/jleo/ewae012.
The two surveys were made possible thanks to financial support from Coefficient Giving (formerly Open Philanthropy), Canada, New Zealand, Switzerland and the United Kingdom. Bocconi University, through funding from the European Research Council (ERC-MARKINDOWN, Grant Agreement No. 101 097 687) and the MUR PRIN 2022 programme (Project No. 2022JYY7SA), covered the costs for Belgium, Italy, Poland, Portugal and Sweden.
Figure 5.5 provides new evidence on the average prevalence of six clauses across the 15 countries covered – country specific results are available in Annex 5.B. Based on employers’ responses, four key stylised facts emerge from the employer survey:
Non-disclosure agreements (NDAs) are by far the most prevalent form of clause (Panel A in Figure 5.5).11 Employers report that about 40% of private‑sector employees are (definitely) covered by an NDA, going up to more than a half when including cases where firms report that employees are “probably” covered12 – country specific estimates are available in Annex Figure 5.B.4.
Non-compete clauses are the second most used clause with around one‑fifth of private‑sector employees currently bound by a non-compete clause, going up to one‑third when including cases where firms report that employees are “probably” covered.
Other restrictive clauses are also relatively common: 12‑22% of employees are covered by non-solicitation of clients clauses, 10‑17% by repayment of bonuses clauses, 9‑16% by training-cost repayment clauses, and 9‑15% by non-solicitation of colleagues clauses. Employee‑reported prevalence is generally higher, though accompanied by greater uncertainty, but shows a similar ranking across clause types (Annex Figure 5.B.5 to Annex Figure 5.B.8 display the prevalence of other clauses by country).
Non-compete and related clauses also appear to be on the rise (Panel B in Figure 5.5). In all countries, a larger share of employers report having increased their use of post-employment clauses over the past five years than report a decrease, suggesting a growing reliance on contractual restrictions.

Note: For the employer-level survey, respondents were asked whether selected clauses were included in any employment contracts in their company (non-disclosure, non-compete, non-solicitation of colleagues and clients, training repayment, and reimbursement clauses). Interviewers could provide explanations if needed. In the employee‑level survey, workers were asked whether, to their knowledge, they had agreed to similar restrictions in their current job (covering confidentiality, non-compete, non-solicitation of clients and colleagues, training repayment, and reimbursement clauses). Both employees and employers were offered graded response options (“definitely yes” / “probably yes” / “probably no” / “definitely no”) alongside a distinct “don’t know” category, allowing respondents to express uncertainty. Employee‑level incidence is estimated by weighting firm-level responses by employment and sampling weights. Firm size brackets are converted into point estimates using midpoints (e.g. 5‑9 employees: 7; 10‑49: 29.5; 50‑249: 149.5; 250‑999; 1 000+: 2 000). The share of employees covered is similarly estimated using midpoint values of percentage ranges (e.g. 1‑10%: 5.5%; …; 76‑99%: 87.5%; 100%). Within each firm, the estimated share covered is multiplied by employment and the sector-size weight. The national incidence rate is then computed as a weighted average of these within-firm shares, ensuring representativeness of the workforce rather than firms. As a conservative assumption, “don’t know” responses on coverage are treated as zero.
Source: OECD-Bocconi employer surveys on non-compete and related clauses.
Post-employment restraint clauses are rarely used in isolation. Figure 5.5 shows that among private‑sector employees, 25% of employees report not being covered by any clause, while 19% are covered by a single clause only, typically an NDA (20% for those definitely bound by a clause). By contrast, 12% report being covered by two clauses (10% for those definitely bound by a clause), and a striking 44% report being covered by three or more clauses (17% for those definitely bound by a clause). Firm-level evidence reinforces this finding. Only around 4% of firms report using no clause at all, while 15% rely exclusively on NDAs. The majority of firms combine several types of clauses.
This pattern closely mirrors previous evidence from Australia, Italy and the United States, where bundling of contractual clauses is also common. In Australia, for example, 21% of the workforce is covered by a non-compete clause, 58% by an NDA, 29% by a non-solicitation of clients clause and 23% by a non-solicitation of co-workers clause (Andrews, Brennan and Buckley, 2024[27]). In Italy, 16% of private‑sector employees are bound by a non-compete clause, compared to 39% by an NDA and smaller but non-negligible shares by non-solicitation and repayment clauses (Boeri, Garnero and Luisetto, 2025[28]). In the United States, 57% of employees are covered by an NDA, 28% by a non-solicitation of clients clause, 24% by a non-recruitment of co-workers clause and 22% by a non-compete clause, with similar bundling patterns reported by firms (Balasubramanian, Starr and Yamaguchi, 2024[29]).
Share of employees and firms bound by or using post-employment restraint clauses (probably and definitely yes), by number of clauses, average across countries

Note: Dark blue bars show the share of employees bound by post-employment restraint clauses (probably and definitely yes), by number of clauses, average across countries. See note in Figure 5.4 for more information on how the incidence is calculated. The light blue bars show the proportion of firms by number of clauses used, weighted by number of employees.
Source: OECD-Bocconi employee and employer surveys on non-compete and related clauses.
Overall, firms appear to deploy a portfolio of contractual tools to protect perceived business interests, with substantial heterogeneity in the number and combination of clauses used. Among these various restrictive clauses, non-compete clauses are those that have attracted the most attention in economic and policy debates because they directly limit workers’ ability to join or start competing firms.
According to the employer survey (Panel A in Figure 5.6), the prevalence of non-compete clause varies, across countries but is relatively common in all, ranging from around 11‑15% in Poland and 7‑18% in Italy, to close to 30% in Canada and between 29% and 41% in Sweden. Results from the employee survey corroborate this picture: overall, 15% of employees report being definitely bound by a non-compete clause, with an additional 21% reporting that they are “probably” bound (Panel B in Figure 5.6). While levels of uncertainty are (unsurprisingly) significantly higher among employees than employers, the overall prevalence implied by the two surveys is remarkably similar.13
Comparing the two sources, prevalence estimates are closely aligned in Belgium, Canada, Germany, Mexico, Portugal, Spain, Sweden and the United Kingdom, despite differences in respondents (CEOs, HR or legal officers for employers, all employees for the employee‑level one) and survey modes (online for employees and telephone for employers). In France, Japan, Korea, New Zealand, Poland and Switzerland, employee‑reported prevalence is higher, driven mainly by a larger share of respondents indicating that they are “probably” covered. This greater uncertainty on the employee side may reflect differences in survey design, limited recall of contract details, some degree of employer under-reporting or unclear contract-terms – either from employees lacking the knowledge to understand, or deliberate vagueness in the contract. Notably, uncertainty persists even among recent hires: among employees who joined their employer within the past two years, on average across the 14 countries, 15% report being bound by a non-compete and a further 17% report that they are probably bound (Annex Figure 5.B.2).
Even when focussing on the most conservative estimates – employees who state with certainty that they are subject to a non-compete – the prevalence observed in the OECD-Bocconi surveys is fully consistent with findings from other OECD countries using comparable data sources.14
Interestingly, cross-country differences in non-compete prevalence do not clearly reflect differences in legal frameworks (see Annex Figure 5.B.3).15 Despite non-compete clauses being unconstitutional (i.e. effectively banned) in Mexico, reported prevalence remains relatively high, suggesting that such clauses may still exert a chilling effect on worker mobility even when the probability that they would be upheld in court is weak. More generally, the prevalence patterns observed do not map neatly onto differences in labour market institutions. Non-compete clauses are widespread not only in flexible labour markets characterised by employment-at-will, limited employment protection (see Chapter 6) and low collective bargaining coverage, but also in more regulated labour markets where job mobility is typically lower. But as discussed below, prevalence alone is not sufficient to assess the economic effects of non-compete clauses for a few reasons. First, the scope and breadth of such clauses – such as their duration, geographic reach, and occupational coverage – can differ significantly across countries. Second, the economic “bite” of non-compete clauses will be partly shaped by how easily they can be used in practice – including the availability of remedies, procedural costs, and the degree of judicial scrutiny – even if the regulatory framework does not influence overall levels of prevalence.

Note: See note in Figure 5.4 for more information on how the incidence is calculated. Estimated incidence rates are similar across many countries, and differences between countries with comparable estimates fall well within the associated margins of error. As a result, the precise country ranking should not be interpreted as definitive. Nevertheless, meaningful cross‑country variation does emerge: using 95% confidence intervals, the estimated incidence in the top three countries is significantly higher than in the bottom three, indicating robust differences at the extremes of the distribution. * For Italy, employee‑level incidence is based on Boeri, Garnero and Luisetto (2025[28]).
Source: OECD-Bocconi employer and employee surveys on non-compete and related clauses.
Finally, in all surveyed countries, firms report that the use of non-compete clauses has been increasing over time (Figure 5.7). On average across countries, over 30% of firms surveyed report having increased their use of non-compete clauses over the past five years, compared to just 6% reporting that they have decreased their use. This points to a growing reliance on contractual restrictions on worker mobility across OECD labour markets.
Share of companies declaring that the use of non-compete clauses has increased or decreased over the last 5 years

Note: Answer to the question “Has your company’s use of these conditions in employment contracts increased, remained the same or decreased over the past 5 years?”. Reply options given included: “It has increased” / “It has remained about the same” / “It has decreased” / “I don’t know” / “I prefer not to answer”.
Source: OECD-Bocconi employer survey on non-compete and related clauses.
The breadth at which non-compete clauses have diffused across OECD labour markets is notable. Figure 5.8 shows that, in line with the original intent, non-compete clauses are indeed more prevalent among managers, professionals, highly educated and higher-earning employees. But they are also widespread among groups for whom the standard justifications based on the protection of trade secrets or high-value investments appear substantially weaker. Across OECD countries, 14‑35% of employees with less than secondary education report being currently bound by a non-compete clause (Figure 5.8, Panel B). Prevalence ranges between 12% and 26% among employees in the bottom decile of the labour income distribution (Figure 5.8, Panel D), 13‑31% among non-managerial and non-professional employees (Figure 5.8, Panel C), and 18‑42% among employees on fixed-term contracts, higher than for open-ended contracts16 (Figure 5.8, Panel E). These patterns suggest that non-compete clauses are not confined to highly skilled or strategically sensitive roles. Higher incidence amongst young employees (Figure 5.8, Panel A) is also consistent with rising prevalence over time.
Share of employees bound by non-compete clauses, average across countries

Note: See notes in Figure 5.4 for more information on how the incidence in the employee‑level survey is calculated. Panel B, education: low (ISCED 2011 levels 0‑2), mid (ISCED 2011 levels 3‑4), high (ISCED 2011 levels 5‑8). Panel C, occupation: managers (ISCO‑08 group 1), professional (ISCO‑08 groups 2 and 3), others (remaining ISCO‑08 groups).
Source: OECD-Bocconi employee surveys on non-compete and related clauses.
The diffusion of non-compete clauses beyond knowledge‑intensive occupations is further illustrated by employees’ reported access to confidential information. While non-compete clauses are more common among employees who report access to trade secrets or commercially sensitive information such as strategic plans, new product development, or key client and supplier lists, a substantial share of employees without such access are nevertheless covered. Between 11% and 27% of employees who report no access to confidential information are bound by a non-compete clause (Figure 5.8, Panel F).
These findings are consistent with previous evidence from other countries. In the United States, non-compete clauses have been found among entry-level employees in fast-food restaurants, and fewer than half of all employees with a non-compete report access to trade secrets (O’Connor, 2014[30]; Starr, Prescott and Bishara, 2021[10]). In Australia, a substantial share of low-wage workers with limited bargaining power are bound by non-compete clauses, including community and personal service workers and clerical and administrative workers, with such clauses increasingly applied to outward-facing roles such as childcare workers, yoga instructors and health-related occupations (Andrews and Jarvis, 2023[26]). In Italy, non-compete clauses are frequently observed among employees in manual and unskilled occupations and among low-educated and lower-earning employees, including employees without access to any form of confidential information (Boeri, Garnero and Luisetto, 2025[28]). In Austria, survey evidence suggests that prior to the 2006 reforms, around one‑third of low-wage employees had a non-compete clause in their employment contract (Klein and Leutner, 2006[31]). In Denmark, despite the 2016 reforms that restricted the use of non-compete clauses, still 20.8% of unskilled workers in companies that use non-compete clauses were covered by a non-compete clause in 2025 (VIVE, 2025[32]).
The use of non-compete clauses also varies systematically across employers. Incidence is higher in firms with more than 1 000 employees than in small firms, and higher in multinational enterprises than in domestically owned firms (Figure 5.9, Panels A and B). As to be expected, non-compete clauses are most prevalent in knowledge‑intensive services such as information and communication, finance and insurance, real estate, and professional and administrative services, but they can also be found in lower-paying service sectors including retail trade, transport, and hotels and restaurants (Figure 5.9, Panel D).
Share of employees bound by non-compete clauses, average across countries

Note: See notes in Figure 5.4 for more information on how the incidence in the employer-level survey is calculated.
Source: OECD-Bocconi employer surveys on non-compete and related clauses.
These patterns indicate that in OECD countries non-compete clauses have spread into parts of the labour market where the original justification of protecting sensitive information or safeguarding large firm-specific investments appears weak or absent. One explanation is that non-compete clauses are frequently applied indiscriminately across the workforce. Among firms that use non-compete clauses, 31% report applying them to all employees regardless of role or seniority. The corresponding share is even higher for non-disclosure agreements, while other restraint clauses are somewhat more targeted but still widely applied on a uniform basis (Figure 5.10). Evidence from the United States and Australia shows that while larger firms are more likely to use non-compete and related clauses, they tend to apply them more selectively, whereas smaller firms that use such clauses often apply them to a much larger share of their workforce (Colvin and Shierholz, 2019[33]; Andrews, Brennan and Buckley, 2024[27]). Similar findings emerge for the Netherlands, where around one‑third of employers use non-compete clauses almost universally as standard contract terms, including for employees without access to knowledge or relationships that could plausibly harm the employer’s competitive position (Bartsch, Grijpstra and Houweling, 2021[34]).
Share of clause‑using firms that apply the respective clause to all their employees, average across countries

Note: See notes in Figure 5.4 for more information on how the use and incidence of the various clauses are calculated in the employer-level survey.
Source: OECD-Bocconi employer surveys on non-compete and related clauses.
Beyond their breadth of application, the way non-compete clauses are introduced and agreed upon also raises questions about their consistency with efficient contracting. Based on the original intent, such clauses would be expected to emerge from negotiated employment arrangements and to be accompanied by compensation, training opportunities, or higher expected earnings. The survey evidence suggests this is often not the case. Using the boosted sample to increase statistical precision (see Box 5.4 on methodology), Figure 5.11 shows that 21% of employees bound by a non-compete became aware of the clause only at the moment of signing the contract, when meaningful negotiation is typically limited and their outside employment options have been extinguished. A further 18% of employees found out about the non-compete clause before signing the contract but after accepting the job, potentially reducing their negotiation position. In some cases, the non-compete was introduced after the employment contract had already been signed, without any change in role or responsibilities.
Engagement with the content of the clause also appears far from perfect. Among employees with a non-compete, 44% report having read the clause carefully, while 23% skimmed it and 9% signed it without reading it. Even among those who read the clause, 47% report that they did not fully understand it, often citing legal or technical complexity.
Consistent with this, only 25% of employees attempted to negotiate their non-compete clause (Figure 5.11). Among those who did not negotiate, the most common reasons were perceiving the clause as reasonable, believing it was non-negotiable, or being explicitly told by the employer that negotiation was not possible. Others refrained from negotiating out of concern that doing so might create tensions with the employer. A smaller share reported not negotiating because they believed the clause would not be really used by the employer or upheld by a court, or because they lacked alternative job offers or expected to face similar clauses elsewhere. Similar patterns have been documented in the literature for the United States, Italy and Sweden (Starr, Prescott and Bishara, 2020[35]; Boeri, Garnero and Luisetto, 2025[28]; Akavia, 2021[36]).
Share of the employees bound by a non-compete clause, average across countries

Note: The charts in the figures are based on the “boost” sample, i.e. the sample which includes only employees with a non-compete clause – see Box 5.4. See notes in Figure 5.4 for more information on how the incidence in the employee‑level survey is calculated.
Source: OECD-Bocconi employee surveys on non-compete and related clauses.
While, as discussed in Section 5.2, regulatory frameworks governing non-compete clauses vary significantly across OECD countries, a common legal principle is that such clauses must be reasonable in their duration, geographic and sectoral scope, and, in many jurisdictions, accompanied by financial compensation.
According to employees’ reports, when the duration is specified, non-compete clauses most frequently last one year or less and apply to the area where the firm operates. However, a non-trivial share of clauses can last for more than one year (or do not have a specified duration) and apply to very broad geographic areas, including the entire country or even international territories. Similarly, a sizeable number of clauses extend beyond the employer’s main sector of activity. Although not all countries require employers to provide financial compensation for a non-compete clause, compensation is generally one of the elements considered by courts when assessing the reasonableness and validity of the restriction. In this context, it is noteworthy that almost one‑half of employees report receiving no compensation at all, despite the breadth of the restrictions imposed (Figure 5.12).
Share of non-compete clauses specifying duration, compensation, geographical area and sector scope, average across countries

Note: This figure is based on the “boost” sample, i.e. the sample which includes only employees with a non-compete clause – see Box 5.4. See notes in Figure 5.4 for more information on how the incidence in the employee‑level survey is calculated.
Source: OECD-Bocconi employee surveys on non-compete and related clauses.
The breadth of these non-compete clauses raises concerns regarding their alignment with national legal frameworks and, consequently, the actual probability that they will be upheld in court. As discussed in Section 5.2 and summarised in Table 5.2, non-compete clauses must satisfy a number of conditions relating to duration, sectoral and geographic scope, compensation and other criteria in order to be upheld by courts. When these conditions are not met, clauses may be deemed null and void. In some countries, courts may rewrite overly broad clauses under so-called blue‑pencil or judicial modification rules (OECD, 2019[7]), although such practices are not uniformly available across jurisdictions (Andrews et al., 2026[24]).

Note: For the employee survey, lower/upper bound differ in how an employee saying “don’t know” or “prefer not to answer” on questions on the duration/compensation/scope is considered. For the lower bound, answering “don’t know” or “prefer not to answer” does not make the clause invalid, while it does for the upper bound. For employers, the figures reflect lower bound estimates, classifying all clauses used by a firm as likely to be upheld by courts if the firm “sometimes” includes the required conditions. These estimates should be interpreted with caution: not only may employees not fully recall the precise terms of the non-compete clauses they have signed, but also the scope for such measurement error is likely to be correlated with the complexity of the legal framework. Therefore, cross-country differences in the share of apparently non-compliant clauses also reflect differences in regulatory complexity as well as reporting noise. The country-specific requirements to be upheld in court are listed in Table 5.2.
Source: OECD-Bocconi employee and employer surveys on non-compete and related clauses.
Figure 5.12 shows that many clauses fail to specify a duration or do not clearly define their geographic or sectoral scope, omissions that substantially reduce the likelihood that the clause would be upheld in court.17 The presence of potentially non-compliant clauses is not limited to countries with particularly complex regulatory frameworks. Even in jurisdictions where the legal requirements governing non-compete clauses are relatively few and clearly defined, a non-negligible share of clauses appears misaligned with statutory or case‑law standards. In addition, even when restricting the sample to workers who report to definitely have a non-compete clause, to have read the clause carefully and have understood it well, the share of clauses that are unlikely to be upheld in court remain very similar (Annex Figure 5.B.10). The results are confirmed by the employer-level survey. Although the measures are not directly comparable due to differences in survey design, the proportion of clauses that are unlikely to be upheld in courts is high and often similar in magnitude to the incidence derived from the employee survey. The high share of clauses that do not meet legal requirements is therefore unlikely to be solely driven by poor reporting and awareness of employees.18
Selected OECD countries included in the OECD-Bocconi surveys
Source: Based on national laws or case law – see Andrews et al. (2026[24]), “The regulation of non-compete clauses across OECD countries”, https://doi.org/10.1787/88e3eb6e-en.
The incidence of clauses that are unlikely to be upheld in court shows some systematic variation. In particular, such clauses are more common among small firms, low income employees, employees in non-managerial/professional positions and employees with no access to confidential information. This pattern suggests that firms may be less attentive to legal compliance when the clause is unlikely to be needed to protect legitimate business interests. Rather than really intending to ask courts to uphold these clauses, firms may include broad or legally weak non-compete clauses due to limited resources to draft tailored contracts or as a result of limited understanding of the regulation in place. Indeed, Figure 5.14 shows that in countries where compensation for non-compete clauses is a legal requirement, almost one‑half of firms using non-compete clauses do not provide compensation for any of their workers who are bound by such a clause. This could partially reflect lack of awareness: around one‑third of firms are unaware that compensation is required for any workers, and a further one‑third believe it is required only in some cases. At the same time, low-skilled employees may be less aware of their rights or struggle to understand the content and implications of the clauses they have signed.
Proportion of firms (%), average across countries where compensation is required by law

Note: Average across countries where compensation is required by law: France, Germany, Spain, Belgium, Poland, Portugal, Sweden and Italy. The lower bound for meeting compensation requirements classifies firms indicating that they “sometimes include” compensation as complying with compensation requirements; the upper bound only classifies firms that “always” include compensation as meeting the compensation requirements. For awareness, the lower bound classifies firms as unaware if they responded that compensation is not required by law or if they selected that they do not know. The upper bound also includes firms who respond that compensation is required for some workers (instead of “all workers” which would correctly characterise the requirements by national law).
Source: OECD-Bocconi employer survey on non-compete and related clauses.
Previous evidence places these findings in a broader context. In the United States, non-compete clauses are common even in states where they are formally banned, indicating widespread use of clauses with limited legal validity (Starr, Prescott and Bishara, 2021[10]). In Italy, a large share of non-compete clauses appear unlikely to be upheld in court under existing legislation, yet remain prevalent in employment contracts (Boeri, Garnero and Luisetto, 2025[28]).
Crucially, employee behaviour is often shaped more by the perceived validity of non-compete clauses than by their actual validity, giving rise to an in terrorem or chilling effect: even clauses that are unlikely to be upheld in courts can deter employees from changing jobs if they fear legal action or reputational consequences (Starr, Prescott and Bishara, 2020[35]; Prescott and Starr, 2021[37]). Consistent with this, Figure 5.15 shows that, when asked whether they would be willing to accept a job offer violating their non-compete clause, the share of employees who report that they would not do so is even higher among those covered by a clause that is unlikely to be upheld in court than among those covered by a potentially valid one. At the same time, Figure 5.15 shows that employees with valid clauses are much more likely to report having been prevented from moving to another job. As already highlighted in the case of Italy, Sweden and the United States,19 this evidence suggests that the economic impact of non-compete clauses cannot be assessed solely based on their formal validity because employees may interpret them differently and act accordingly. This highlights the need for a closer examination of the practical effects of such clauses on mobility, wages and productivity.
Share of employees bound by a non-compete clause, by the likelihood of the clause to be upheld in court, average across countries

Source: OECD-Bocconi employee surveys on non-compete and related clauses.
Three main mechanisms may help explain why firms continue to use non-compete clauses that are unlikely to be upheld in court:
First, as discussed above, non-compete clauses are frequently applied indiscriminately across the workforce using standardised contract templates not tailored to each specific case.
Second, non-compete clauses are often embedded within broader contractual bundles – including non-disclosure, non-solicitation, confidentiality, or training-related provisions – which may already provide firms with alternative means of protecting business interests. In this context, the marginal benefit of carefully tailoring the scope and legal robustness of non-compete clauses to individual employees may be limited, particularly when drafting costs are non-trivial and the clause is unlikely to be tested in court.
Finally, firms may not need to rely on formal court intervention for such clauses to affect employee behaviour. The chilling effect of non-compete clauses per se – whereby employees refrain from changing jobs due to perceived legal risks, uncertainty, or reputational concerns, even when the clause would not ultimately be upheld in court – may be enough:
Consistent with this interpretation, an empirical review of US state court decisions identifies only 514 cases between 1998 and 2022 in which courts substantively assessed the validity of employee non-compete clauses under the rule of reason, despite the widespread use of such clauses, suggesting that most non-compete clauses exert their effects without judicial adjudication (Crane, 2024[38]). Similarly, evidence from Minnesota shows that only a very small share of non-compete agreements ever result in litigation, despite an estimated one in nine workers being covered by such clauses (Boesch, Narayan and Nunn, 2025[39]).
Empirical evidence from the United States shows that firms place little value on the formal legal validity of non-compete clauses for employees near statutory thresholds (Hiraiwa, Lipsitz and Starr, 2024[40]), indicating that deterrence, rather than litigation, may be the primary channel through which such clauses operate.
In contrast to non-compete clauses which pertain to contractual arrangements between workers and firms, firms may engage in no-poaching and wage‑fixing agreements with other firms to explicitly restrict labour market competition. No-poaching agreements are akin to a buyers’ cartel between employers whereby employers agree not to hire or solicit (including cold-call) each other’s employees, primarily with an aim to reduce wages (OECD, 2022[8]). Wage‑fixing agreements, by contrast, involve co‑ordination between employers on wages, bonuses, or other elements of compensation, typically with the aim of limiting upward wage pressure.20 Both practices operate by weakening outside options for workers, thereby reinforcing employer monopsony power and enabling firms to pay wages below workers’ marginal product, even in the absence of formal mergers or high measured concentration (Gottfries and Jarosch, 2025[41]; OECD, 2022[8]; OECD, 2020[42]). For example, studies (Sharma, 2025[43]; Delabastita and Rubens, 2022[44]; Callaci et al., 2024[45]; Gibson, 2025[46]) have documented substantial wage losses in the range of 5‑15% following the creation of no-poaching or wage‑fixing agreements.
In most OECD countries, no-poaching and wage‑fixing agreements are treated as analogous to price‑fixing or market-sharing arrangements in product markets (Aresu, Erharter and Renner-Loquenz, 2024[47]) and are thus considered per se illegal.21 Indeed, such conduct is viewed as a serious restriction of competition because “collusion is the most detrimental anticompetitive practice in labour markets,” including agreements to fix wages or working conditions (OECD, 2020, p. 28[42]). Because such conduct is illegal, the employer survey asked firms whether they were aware of no-poaching or wage‑fixing agreements occurring in their industry, as opposed to whether they engaged in such practices directly.
The results in Panel A of Figure 5.16 suggest that these practices may be more widespread than often assumed: almost one‑half of surveyed firms report knowledge of either no-poaching, wage‑fixing, or both within their industry.22 This does not imply that one‑half of firms participate in such conduct; however, the pattern is consistent with the idea that labour-market collusion is difficult to detect directly, yet even a small number of well-known cases can influence wage‑setting norms and competitive behaviour across an entire sector (Prager, 2025[48]). The employee survey provides complementary evidence from the employee perspective. Panel B of Figure 5.16 shows that around 15% of employees report having been prevented from moving to another company because of a no-poaching agreement between their employer and another firm, while 26% report having heard of such practices. Taken together, these findings suggest that firm-to-firm agreements may play a non-negligible role in shaping workers’ outside options, even in jurisdictions where individual non-compete clauses are tightly regulated.
While these survey results are suggestive, they help contextualise the growing attention that competition authorities have devoted to labour market conduct over the past decade. Historically, antitrust enforcement focussed almost exclusively on product and service markets, with labour market outcomes regarded as falling outside the remit of competition policy. This view has shifted markedly as economic research has highlighted the prevalence of employer market power in labour markets and its potential role in suppressing wages and degrading working conditions. Since the early 2010s, competition authorities have increasingly treated no-poaching and wage‑fixing agreements as hard-core restrictions of competition (Posner and Volpin, 2023[49]). Early landmark cases in the United States – most notably those involving technology firms in Silicon Valley agreeing not to cold-call each other’s engineers – marked the beginning of a sustained enforcement effort. More recently, several US authorities have pursued cases across healthcare, aerospace, poultry processing and packaging, professional sports, and digital services, with mixed but increasingly precedent-setting outcomes, including the first successful criminal trial conviction for wage‑fixing in April 2025 (“United States v. Eduardo Lopez”).23

Note: Panel A: Responses to the questions “Are you aware of any companies in your industry entering into agreements not to hire each other’s employees?” (interviewer could specify “also known as no-poaching agreements”) and “Are you aware of any companies in your industry entering into agreements to fix employees’ salaries or other employment benefits?” (interviewer could specify “also known as wage-fixing agreements”). Panel B: response to the question “Have you ever been prevented from moving to another company because of a no-poaching agreement between your employer and another company? A no-poaching agreement is when companies agree not to hire each other’s employees” with answer options Yes, I have experienced this / No, but I have heard of such agreements in my industry / No, I have not experienced or heard of such situations.
Source: Panel A: OECD-Bocconi employer survey on non-compete and related clauses. Panel B: OECD-Bocconi employee survey on non-compete and related clauses.
National competition authorities in Europe and elsewhere have launched investigations and imposed fines in a wide range of sectors, including healthcare, professional sports, engineering and consultancy services, construction, fashion and modelling, media, automotive, and digital services. The first EU-level investigation into a concerted practice not to hire or actively approach each other’s employees (no-poaching agreement) between two well-known food-delivery companies, was settled in June 2025.24 These cases underscore that no-poaching and wage‑fixing agreements are not isolated cases or confined to certain types of markets but can arise wherever labour represents a key input and turnover is high. The survey evidence presented here suggests that the renewed enforcement focus of competition authorities is well founded and should be maintained.
Previous sections have shown that non-compete and related clauses are prevalent across OECD countries with very different labour market institutions and regulatory frameworks, and that their incidence does not appear to be strongly correlated with the overall strictness of regulation. In addition, a significant share of non-compete clauses do not appear likely to be upheld in courts. This raises a key question: do these clauses constrain employees’ behaviour and firms’ outcomes in practice, or are they rather obscure and largely neutral contractual provisions? Accordingly, this section explores whether non-compete clauses truly “bite” in terms of economic performance – by affecting job mobility, wages and productivity – and assesses the extent to which regulatory interventions can shape the economic effects of such clauses.
Estimating the economic effects of non-compete clauses is challenging because their use is not random: firms and workers that adopt them differ systematically from those that do not. As a result, simple correlational studies often find that workers with non-compete clauses earn more than workers without them (Starr, Prescott and Bishara, 2021[10]; Rothstein and Starr, 2022[50]; Kodama, Kambayashi and Izumi, 2025[51]), but those studies also reflect unobserved firm, job and worker characteristics.
However, studies exploiting field or natural experiments such as policy reforms or differences across neighbouring jurisdictions consistently find that non-compete clauses are associated with lower job mobility and lower wages (Garmaise, 2009[52]; Marx, Strumsky and Fleming, 2009[53]; US Treasury, 2016[54]; US Treasury, 2022[55]). Recent evidence (Engbom, Baksy and Caratelli, 2026[56]) shows that the long-run decline in job-to-job mobility – linked to reduced outside offers and weaker employer competition – has materially slowed wage growth in the United States (around 0.7 p.p. per year). A back-of-the‑envelope calculation suggests that rising employer concentration and the use of non-compete clauses may account for roughly 60% of the decline in on-the‑job search efficiency between the 1980s and 2010s.
In addition to constraining job-to-job mobility, non-compete clauses directly prohibit employees from starting competing businesses. Babina (2019[57]) finds that new start-up creation of employees in existing companies subject to adverse financial shocks is significantly reduced in states where non-compete clauses are more easily enforced. Samila and Sorenson (2011[58]) show that an increase in the local supply of venture capital results in a significantly stronger increase in the number of new firms in US states where non-compete clause use is restricted. Echoing these findings, non-compete enforceability is linked with fewer within-industry spin-outs (Starr, Balasubramanian and Sakakibara, 2018[59]).
Consistent with these findings, the employee survey demonstrates that non-compete clauses often appear binding, with potentially important implications for job mobility and firm entry. Panel A in Figure 5.17 shows that across survey countries, over 20% of workers who have had a non-compete clause have been stopped from moving jobs; and over 10% have been stopped from opening a business. Around 19% have faced legal action and 41%would not move jobs if the job offer violated their non-compete clause. Expressing these figures as a share of all workers, Panel B of Figure 5.17 shows that a meaningful share of all private‑sector employees surveyed have been directly affected by a non-compete clause at some point during their careers. Over 5% of all workers surveyed report having been stopped from moving jobs by a current or past non-compete clause and almost 3% have been stopped from opening a business, and around 5% have faced legal action. Around 6% of all workers would not accept a competing job offer out of fear of violating a non-compete clause. The magnitude of these figures is meaningful in the context of overall job-to-job transition rates (close to 10% per year25) and new business formation (around 5.7 per 1000 working age people per annum26). These results are supported by the employer surveys: two‑thirds of firms say they would enforce their non-compete clauses if workers tried to join a competitor.

Note: Averages across survey countries. The charts display the proportion of employees who have ever been stopped from moving jobs, from starting a business or have faced legal action due to a current or a past non-compete clause. The fourth column shows the proportion of employees that would not accept a job offer if it violated their current non-compete clause. Panel A displays these statistics as a proportion of workers that definitely have a non-compete clause or have definitely had one in the past, except for the rightmost column that displays the proportion of workers who would not violate their non-compete clause as a proportion of workers that currently have a non-compete clause. Panel B shows the statistics as a proportion of all surveyed workers.
Source: OECD-Bocconi employee survey of non-compete and related clauses.
Importantly, the effects on job mobility, firm entry and wages are observed not only where non-compete clauses are lightly regulated, but also in jurisdictions where they are partially or fully banned, as workers often forgo job offers because of non-compete clauses which would not be upheld in court (see discussion around Figure 5.15 above). This “chilling effect” implies that analyses based solely on the legal framework may understate the economic impact of non-compete clauses.
At the same time, studies exploiting changes in regulation across and within US states find that restricting non-compete clauses for various types of workers increased job mobility and wages (Lipsitz and Starr, 2022[60]; Balasubramanian et al., 2022[61]; Hiraiwa, Lipsitz and Starr, 2024[40]). Studies exploiting the large differences in regulation across US states find that limiting non-compete use increases wages by around 3‑4% on average and substantially raises employee mobility (Greenwood, Kobayashi and Starr, forthcoming[16]; Johnson, Lavetti and Lipsitz, 2025[13]). Beyond the United States, Young (2021[62]) finds that Austria’s 2006 reform banning non-compete clauses for low-wage employees increased transitions to better-paying jobs. More recently, Bartelsman, Dobbelaere and Zona Mattioli (2024[63]) show that reforms introduced in the Netherlands in 2015 were associated with higher wages and increased mobility, particularly in firms intensive in intangible assets.
New descriptive evidence based on the OECD’s employee‑level survey indicates that amongst the pool of employees with NDAs,27 the mobility up the annual earnings distribution over a 25‑year career of employees with a non-compete clause is around 3 percentiles lower than for employees with an NDA only (Figure 5.18). The difference is even larger among lower-educated employees (Panel B). As discussed in Box 5.5, this analysis controls for various confounding factors and the comparison is restricted to employees who currently have an NDA to attenuate selection concerns. This result is aligned with evidence from Australia and the United States, which shows that firms that combine non-compete clauses with non-disclosure agreements tend to pay wages that are 3‑7% lower than similar firms that only employ NDAs (Buckley, Rankin and Andrews, 2024[64]; Balasubramanian, Starr and Yamaguchi, 2024[29]). Similarly, Potter, Kurmann and Hobijn (2026[65]) find that signing a non-compete clause is associated with significantly slower wage growth for low-education workers. In contrast, they find that signing a non-compete clause is associated with faster wage growth for high-education workers suggesting that non-compete clauses potentially support firm-specific investment in higher-skill jobs. A similar finding is reported by Lavetti, Simon and White (2019[66]) for physicians under profit-sharing pay schemes.
Additional analysis reveals that the association between non-compete clauses and weaker earnings growth is particularly strong for workers whose non-compete clauses are likely to be upheld in court, based on the regulatory framework of the worker’s country (Annex Table 5.B.2). This highlights the role that regulation can play in shaping the economic “bite” of non-compete clauses. Again, this result is driven by workers without tertiary education.,28 29
Earnings-experience profiles for employees without a non-compete clause (NCC) in the past, and for employees with a non-compete in a previous job, by level of education

Note: The results are based on an OLS regression of employee earnings quintiles on past non-compete status, work experience (age adjusted for educational attainment), and experience squared. The model is estimated on a sample of employees who currently have NDAs, controlling for employee, job, and firm characteristics, alongside country and industry-occupation fixed effects. Annex Table 5.B.1 shows the regression results, Box 5.5 provides detail on the methodology.
Source: Calculations using the OECD-Bocconi employee‑level survey.
This box summarises the empirical methodology used to estimate the link between non-compete clauses and earnings growth.
The analysis uses the OECD-Bocconi employee‑level survey where workers are asked to report their annual gross earnings in brackets of local currency (split by earnings quintiles1 to ensure country comparability) and if they are currently bound by a non-compete clause and/or a non-disclosure agreement as well as if they have been bound by a non-compete clause in the past. Even though the survey only provides a snapshot of current earnings and past and present non-compete use, this cross-sectional information can be used to study the relationship between earnings and experience, using the following baseline specification:
Earnings is the earnings quintile1 of worker i in industry j, occupation o and country c
Experience is the total work experience in years, computed as age minus 18 for those with “low” education, age – 20 for those with “mid” education, and age – 25 for those with “high” (tertiary) education2
NCCcurrent is a dummy variable, equal to 1 if the worker reports having a non-compete in their current job (they responded yes or probably yes in the survey)3
NCCpast is 1 if the worker has ever had a non-compete in a previous job (yes or probably yes)
Controls include worker-controls (education, sex), job controls (part-time job, tenure, fixed-term contract, short-term contract), firm controls (firm size, multinational firm). Experience squared is also included as a control, to capture decreasing returns to experience. Current non-compete and past non-compete are also included as controls.
is industry x occupation fixed effect
is country fixed effect
In the baseline analysis, the sample of employees is restricted to those with a non-disclosure agreement (NDA) in their current job.4 This approach has previously been used in the literature, as it provides a more reliable comparison when some of the selection into having any post-employment restraints is netted out. For example, if the employee’s employer has something valuable to protect (e.g. trade secrets, IP), then their first response will be to deploy some form of restraint, but they may well be neutral to the exact instrument or combination of instruments used. Nevertheless, the estimation strategy employed can only identify associations between non-compete clauses and earnings growth, and the evidence should not be interpreted as causal.
The baseline results are displayed in Annex Table 5.B.1 and are robust to a wide range of alternative specifications, including additional controls (training, access to confidential information, other post-employment restraints), alternative measures of experience, different fixed effect structures (including interacted occupation x industry x country fixed effects) and clustering strategies, changes in sample composition, and alternative definitions of non-compete status (past or present).5
1. To convert the results from income quintiles into percentiles, the coefficients are simply multiplied by 20, as one quintile equals 20 percentiles.
2. The results are robust to using an alternative experience measure, computed as age minus 16 for those with “low” education, age minus 18 for those with “mid” education, and age minus 22 for those with “high” education.
3. Past and current non-compete status is also allowed to interact with the squared experience term in one of the robustness checks. These interaction terms are not statistically significant, but the precision of the other coefficient estimates is reduced when they are included. Hence, these additional interaction terms are not included in the baseline specification.
4. The estimates are also robust to including all workers in the sample instead of restricting the analysis to those with NDAs only.
5. Results are available upon request from the authors.
Recent field experimental evidence further clarifies the mechanisms through which non-compete clauses affect worker outcomes. Cowgill, Freiberg and Starr (2024[17]) conducted a large‑scale experiment in which the inclusion, salience and duration of non-compete clauses were randomised in approximately 14 000 job offers for short-term contractors in the finance sector. Although many employees did not read the non-compete clause when it appeared deep in the contract, its presence reduced subsequent employment with competing firms by 57%. The experiment shows that including a non-compete clause in a job offer reduces total compensation paid by the original firm and its competitors by around 12%, suggesting that the employer gains leverage while the overall number of job applicants shrinks. Individuals who sign a non-compete receive 4‑8% lower compensation, regardless of their likelihood of being upheld in courts.30
The effects of non-compete clauses also extend beyond workers who are directly bound by them. As discussed in Section 5.1, when non-compete clauses are widely used within a local labour market, they can weaken wage competition and reduce mobility for all workers. Starr, Frake and Agarwal (2019[67]) find that labour markets characterised by widespread non-compete clauses exhibit lower wages and slower mobility, including among workers not subject to such clauses. Johnson, Lavetti and Lipsitz (2025[13]) document spillovers across state borders, showing that making non-compete clauses easier to use in one state suppresses wages in neighbouring states.
An important policy question raised by the evidence on wages and mobility is whether non-compete clauses merely redistribute surplus between firms and workers, or whether they also constrain productivity-enhancing labour reallocation. While a growing literature documents the negative effects of non-compete clauses on job mobility and earnings, their implications for productivity remain largely unexplored. To date, there are only two exceptions: Anand et al. (2017[68]) who show that where non-compete clauses are more likely to be upheld in courts they stifle worker mobility and innovation, ultimately reducing productivity. The second is a recent paper by Chang et al. (2026[69]), which uses newly assembled manufacturing data for the United States and finds that increases in the likelihood of non-compete clauses being upheld in court – creating a legal environment more favourable to firms – are accompanied by reductions in output and productivity.31 This section aims at providing a contribution to fill this gap by showing cross-country evidence on the relationship between non-compete prevalence, regulation and productivity outcomes. While the results are robust to a wide range of controls and specifications, unobserved factors correlated with non-compete prevalence may still play a role. Therefore, the findings should be seen as associations and not causal effects. However, the consistency of the results with established mechanisms in the productivity literature lends support to the findings.
From a conceptual perspective, non-compete clauses may affect productivity through several, potentially offsetting, channels. By limiting worker mobility, non-compete clauses can reduce productivity growth by impeding the reallocation of labour from less productive to more productive firms, thereby weakening allocative efficiency. This mechanism has been highlighted as a key driver of aggregate productivity differences across countries and over time (Bartelsman, Haltiwanger and Scarpetta, 2013[70]; Andrews and Cingano, 2014[71]). Reduced worker mobility may also slow knowledge diffusion across firms, limiting within-firm productivity growth, particularly for laggard firms for which catch-up to the technological frontier is a central source of productivity gains. Mobility restrictions may also worsen the quality of job matching if workers are prevented from moving to jobs that better fit their skills and experience. Against this, stronger clauses limiting what employees can do after they leave their job may encourage firms to invest more in training, research and development, or other intangible assets, and facilitate the sharing of proprietary information within firms.
To examine these issues, this section combines industry-country level measures of non-compete prevalence derived from the OECD – Bocconi employer survey with firm-level productivity and employment data from Orbis.32 Box 5.6 provides a brief overview of the methodology and key results, while Andrews, Garnero and Holttinen (2026[72]) provides a more detailed description.
This box summarises the empirical methodology used to estimate the link between non-compete clauses and productivity via two key mechanisms: productivity-enhancing labour reallocation and knowledge diffusion across firms.1 Full details and results are provided in Andrews, Garnero and Holttinen (2026[72]).
To study the link between non-compete clauses and productivity-enhancing labour reallocation, the analysis builds on established approaches in the productivity literature (Decker et al., 2020[4]) to assess whether employment growth responds less strongly to firm-level productivity in environments where non-compete clauses are more prevalent. Using firm-level panel data where i indexes firms, j industries, c countries, and t years, the baseline specification is:
LP is firm-level log-labour productivity, NCC is the industry-country-level non-compete incidence using the OECD-Bocconi employer survey.2 If the estimated coefficient is positive, then higher productivity firms are more likely to expand and lower productivity firms are more likely to contract, consistent with productivity enhancing labour reallocation. But if the estimated coefficient on the interaction term is negative, then higher prevalence of non-compete clauses at the industry level is associated with weaker productivity-enhancing labour reallocation.
To assess potential links between non-compete clauses and firm-level catch-up growth to the global productivity frontier, the analysis follows a widely used empirical methodology derived from neo-Schumpeterian growth theory (Aghion and Howitt, 1998[73]; Aghion et al., 2005[74]). The baseline specification is:
where LP growth is the growth rate of firm-level labour productivity, frontier growth captures the productivity advances of the global productivity frontier (the top 5% of the productivity distribution in each industry), and gap is the difference between the firm’s productivity and the mean productivity level of the global frontier. The regression is run on firm-level data, excluding frontier firms. A positive indicates catch-up growth: firms further from the frontier have the potential to grow faster, given a larger stock of unexploited technologies at their disposal for adoption. A negative coefficient on the interaction term, , would be consistent with the view that non-compete clauses slow down knowledge diffusion and hence reduce catch-up growth. In both specifications (reallocation and catch-up growth), controls include firm age and size, and industry × country and year fixed effects.
The analysis uses firm-level data from Orbis, a comprehensive global database maintained by Bureau van Dijk (Moody’s Analytics) containing financial statements, ownership structures, and operational information for millions of firms worldwide. These firm-level data are matched with prevalence estimates of non-compete clauses at the country × industry level from the OECD-Bocconi employee surveys. To improve representativeness and firm coverage, the analysis combines data for 2022 and 2023 (latest years available in Orbis). For 2023, full coverage of firms was not yet available at the time of the analysis. For the 2022 period, the coverage of firms is better; however, the gap between the firm-level data and the non-compete survey data is larger, and firm-level outcomes may still partially reflect the impacts of the COVID‑19 pandemic. Combining the two years increases the coverage and representativeness of the sample, while also allowing for time‑fixed effects to capture some of the potential impact of the pandemic, but the results are robust to using a single year of Orbis data.3
While the results are robust to a wide range of specifications and controls – including prevalence of non-disclosure agreements and labour market tightness measures – unobserved factors correlated with non-compete prevalence may still play a role. This includes any lingering effects of the COVID‑19 pandemic which may still be present in the latest available years of the Orbis sample. Therefore, the findings should be seen as associations and not causal effects. However, the consistency of the results with established mechanisms in the productivity literature and across multiple specifications lends support to the findings.
As post-employment restraints are often bundled together, robustness of the results was also tested by controlling for the prevalence of other clauses. However, multiple restraints could have stronger effects than what is revealed when clauses are considered in isolation. Future work could investigate if non-compete and related clauses are more damaging when bundled together.4
1. The analysis presented does not aim to estimate the direct association between non-compete prevalence and other drivers of firm productivity growth, including innovation. This is because of data limitations: firstly, the firm-level data does not capture these investments very reliably, and second, analysing the direct relationship between industry x country -level non-compete prevalence and firm productivity growth would be subject to further confounding factors as it would not be possible to include interacted industry x country fixed effects.
2. The non-compete prevalence is de‑meaned by deducting the average non-compete incidence in the industry-country-level non-compete data. In most specifications, the industry x country interacted fixed effects absorb the non-compete clause prevalence. However, it is included as an additional control in any specification where it is not fully absorbed by the fixed effects, for both the reallocation and catch-up regressions.
3. As catch-up growth and the process of labour reallocation are dynamic relationships, the estimation would ideally be conducted using a longer time series dimension. However, the OECD-Bocconi non-compete survey provides mainly cross-sectional evidence of non-compete use, which is the reason why the analysis is restricted to only using the most recent years in the Orbis database.
4. The analysis undertaken for the chapter briefly explored whether the negative association between non-compete clauses and productivity is exacerbated when awareness of no poach agreements is higher (and vice versa), via a triple interaction term. The results were inconclusive, possibly because of the imperfect nature of the measurement of no-poach agreement prevalence, which captures awareness rather than incidence.
Well-functioning economies are characterised by a process of continuous reallocation whereby high productivity firms are more likely to attract workers and grow, and low productivity firms are more likely to contract (and exit). On average, high productivity firms grow faster than less productive firms, consistent with an efficient reallocation process (see Box 5.6). But this relationship is significantly attenuated in industries where non-compete clauses are more widespread (Panel A in Figure 5.19). A 10 p.p. increase in the prevalence of non-compete clauses – this corresponds closely to the share of workers covered by a non-compete clause despite having no access to confidential information (9.5%) – is associated with a reduction of roughly one‑sixth in the responsiveness of employment growth to productivity differences. In practical terms, a 10 p.p. increase in non-compete prevalence is associated with a decline in the employment growth gap between high- and low-productivity firms from about 7.4 p.p. to around 6.1 p.p.

Note: Panel A: The employment growth gap is the difference in employment growth between firms at one standard deviation below the mean productivity level, compared to firms with a productivity level of one standard deviation above the mean. Panel B: The chart depicts the change in the employment growth gap when the non-compete incidence increases by 10 p.p., relative to the employment growth gap when non-compete incidence is at the average level. Strict regulation refers to countries where the OECD Non-compete regulation index is below the median value, meaning non-compete clauses are less likely to be upheld in courts. Lenient regulation refers to countries where the regulation index is above the median, meaning that non-compete clauses are more likely to be upheld in court.
Source: OECD-Bocconi employer survey on non-compete and related clauses; Orbis firm-level data; Andrews, Garnero and Holttinen (2026[72]), “Non-compete clauses and productivity: New cross-country firm-level evidence”.
Interestingly, while the stringency of the regulation – measured using the index developed in Section 5.2 – does not appear to determine the incidence of non-compete clauses, it seems to shape their economic “bite”. For example, there is suggestive evidence that the dampening effect of non-compete prevalence on labour reallocation is stronger in countries where non-compete clauses are more likely to be upheld in court or subject to fewer legal constraints (Panel B in Figure 5.19). In these countries, a 10‑p.p. increase in non-compete prevalence is associated with a larger drop in productivity-enhancing reallocation.33 Nevertheless, the analysis also shows that regulation does not eliminate the negative association altogether. Even in countries with tighter non-compete regulation, higher prevalence is still linked to weaker labour reallocation. This finding is consistent with earlier evidence in the chapter showing that non-compete clauses may affect employee behaviour even when they are unlikely to be upheld in court, due to information frictions and chilling effects.
Additional analysis in Andrews, Garnero and Holttinen (2026[72]) suggests that these effects are much stronger for non-compete clauses in comparison to less restrictive non-disclosure agreements (NDAs). While there is evidence of a negative association between NDAs and efficient labour reallocation, the effect is smaller and less robust to including broader controls (such as an indicator for product market regulation and employment protection legislation). This pattern is consistent with the idea that non-compete clauses, by directly restricting job mobility, are particularly distortive for labour reallocation, whereas more targeted tools such as NDAs have more limited aggregate effects.
Firm-to-firm no-poach agreements (NPAs) also hinder the efficient reallocation process. Box 5.7 illustrates that a higher awareness of no-poach agreements by firms is associated with weaker productivity-enhancing labour reallocation, supporting the position that many competition authorities have taken regarding their harmful effects on labour markets and the economy.
No-poach agreements may also play a role in slowing down productivity-enhancing labour reallocation. This box replicates the analysis done for non-compete clauses using the share of firms that report being aware of no-poach agreements in their industry, following the specifications described in Box 5.6.
Figure 5.20 presents the regression results. The interaction term between no-poach agreement awareness and lagged labour productivity is negative and significant: no-poach agreements are associated with significantly less productivity-enhancing labour reallocation. When both non-compete clauses and no-poach agreements are included in the same specification (light blue bars), both remain negative and significant, suggesting that these two types of restrictions operate through distinct channels or affect different segments of the labour market.
Results from regression analysis

Note: Relationship between employment growth and labour productivity, by industry x country-level prevalence of non-compete clauses and awareness of no-poach agreements. Dependent variable is employment growth at the firm level. The bars show the regression coefficients, 95% confidence intervals are displayed by the error bars. LP denotes the log of firm-level labour productivity (value‑added to number of employees), lagged by one period. The non-compete incidence (NCC) is de‑meaned by the average non-compete prevalence in the industry-country-level data; hence, NCC=0 corresponds to mean level of non-compete prevalence. NPA is the share of firms that report being aware of no-poach agreements in their industry. All regressions include the following controls: firm employment in year t‑1 and firm age; as well as industry x country and year fixed effects. The regressions pool data from 2023-2022 period and 2022-2021 period. Firms with less than 10 employees are excluded in the baseline analysis. Standard errors are clustered at industry x country level.
Source: OECD-Bocconi employer survey on non-compete and related clauses; Orbis firm-level data; Andrews, Garnero and Holttinen (2026[72]), “Non-compete clauses and productivity: New cross-country firm-level evidence”.
The point estimates for non-compete clauses cannot be directly compared to those for no-poach agreements because the measures have different definitions: the former is the share of workers covered by a non-compete clause, while the latter is the share of firms that are aware of no-poach agreements in their industry. The relative magnitude of the coefficients should therefore not be taken as an indicator of their relative impact on the efficiency of labour allocation.
Non-compete clauses can also affect productivity by stifling knowledge diffusion through reduced job mobility. The empirical results in Andrews, Garnero and Holttinen (2026[72]) illustrate the potential for firms further behind the global productivity frontier to experience higher productivity growth, consistent with the larger stock of unexploited technologies that they have at their disposal for adoption. But a higher prevalence of non-compete clauses weakens this scope for catch-up growth, consistent with the idea that widespread use of non-compete clauses can hinder knowledge diffusion. An increase in non-compete prevalence by 10 p.p. is associated with a slowdown of technological convergence by 5%, which implies a decline in firm-level annual labour productivity growth by 1.8 p.p. for firms at the median productivity gap to the frontier, as displayed by the bar on the left in Figure 5.21.
Fall in firm-level labour productivity growth associated with an increase in non-compete clause incidence by 10 p.p., for the median non-frontier firm

Notes: The bars show the p.p. decline in firm-level labour productivity growth associated with a 10 p.p. increase in the non-compete incidence, at the median productivity gap to the frontier. Labour productivity growth is defined as the difference in the logarithm of labour productivity between the current and the previous year. Gap to the frontier is the difference between the average log labour productivity of the top 5% of firms in each industry and the log labour productivity of the firm. Strict regulation refers to countries where the OECD Non-compete regulation index is below the median value, meaning non-compete clauses are less likely to be upheld in courts. Lenient regulation refers to countries where the regulation index is above the median, meaning that non-compete clauses are more likely to be upheld in courts.
Source: OECD-Bocconi employer survey on non-compete and related clauses; Orbis firm-level data; Andrews, Garnero and Holttinen (2026[72]), “Non-compete clauses and productivity: New cross-country firm-level evidence”.
This mechanism extends beyond technical knowledge to commercial relationships: Patault and Lenoir (2024[15]) show, using matched employer-employee and firm-to-firm trade data for France, that recruiting a sales manager from a competing firm increases the probability of exporting to that firm’s buyers by around 32%, and that these transitions are not zero-sum – they expand the total number of buyer-supplier connections rather than merely redistributing them.
As in the reallocation analysis, there is suggestive evidence that the economic “bite” of non-compete clauses seems to be larger in countries where they are more likely to be upheld in courts. The relative fall in catch-up growth associated with a higher non-compete incidence is almost two‑thirds larger in countries with more lenient non-compete regulation, resulting in a fall in labour productivity growth by 2 p.p. for the median non-frontier firm, compared to 1.5 p.p. in countries where non-compete clauses are more stringently regulated (Figure 5.21, middle and right bars). This suggests that regulation shapes the extent to which non-compete clauses translate into real constraints on knowledge diffusion – nevertheless, the negative association between non-compete clauses and catch-up growth persists even in countries with more stringent non-compete regulation. It should be noted that, compared to the reallocation results, the catch-up growth analysis by regulatory framework is less robust to the addition of further institutional controls. The challenge arises partly from the limited number of countries once the sample is split by non-compete regulation. The results should therefore be interpreted with more care.
Additional analysis, presented in Andrews, Garnero and Holttinen (2026[72]), suggests that the impact of NDAs on knowledge diffusion is more limited. Similar to non-compete clauses, a higher NDA prevalence is associated with slower catch-up growth, however, the relationship is weaker and less robust than the link between non-compete clauses and reduced technological convergence. These results reinforce the view that instruments which directly restrict labour mobility are particularly detrimental to knowledge diffusion.
So far, the analysis has documented that higher non-compete prevalence is associated with weaker productivity-enhancing labour reallocation and slower technological catch-up among non-frontier firms. Taken together, these findings point to potentially non-trivial implications for aggregate productivity. This section uses the empirical estimates to compute the implied effect of non-compete clauses on aggregate labour productivity, isolating the reallocation and catch-up growth channels.34,35
The scenario considered is a 10 p.p. increase in industry-level non-compete incidence.36 To estimate the aggregate productivity impact, changes in aggregate productivity are decomposed following a well-established approach in the literature (Foster, Haltiwanger and Krizan, 2001[75]), which distinguishes between within-firm productivity growth and productivity gains arising from the reallocation of labour across firms. Further details are available in Andrews, Garnero and Holttinen (2026[72]).
Figure 5.22 illustrates the economically material productivity losses associated with the spread of non-compete clauses. Across the sample of countries, a 10‑p.p. increase in non-compete incidence is associated with a 1.9 p.p. decline in aggregate productivity. Most of this effect reflects slower catch-up growth among non-frontier firms (around 1.6 p.p.), while worsening labour allocation across firms contributes a further 0.3 p.p. These results suggest that the productivity costs of non-compete clauses operate primarily through weaker knowledge diffusion and slower convergence, but reduced allocative efficiency also plays a role.37
In line with the previous discussion, the aggregate productivity impact of non-compete clauses is more pronounced in countries where they are less regulated or more likely to be upheld in courts. In these countries, the increase in non-compete incidence is associated with a reduction in aggregate productivity of more than 2 p.p. In relative terms, this loss is over one‑third larger than in countries with more stringent non-compete regulation, highlighting the role of the regulatory framework in shaping the economic bite of these clauses. Nevertheless, even in countries where regulation already places tighter constraints on non-compete use, the implied productivity costs are material – at 1.5 p.p. – suggesting that further restrictions in the use of non-compete clauses could still yield meaningful efficiency benefits.38
p.p. decline in the level of aggregate productivity associated with an increase in non-compete incidence of 10 p.p.

Notes: This figure displays the change in different components of the aggregate productivity index, in p.p., associated with a 10‑p.p. increase in the industry-level non-compete incidence. The aggregate productivity decomposition builds on widely used methodology in the productivity literature (Foster, Haltiwanger and Krizan, 2001[75]), more detail is provided in Andrews, Garnero and Holttinen (2026[72]). As these estimates are obtained excluding the data on frontier firms, the productivity of frontier firms is set to remain the same in the baseline and the counterfactual. The total effect is slightly attenuated by the presence of an interaction term between reallocation and within-firm productivity in the decomposition, hence the total effect is not exactly equal to the sum of the reallocation and within-firm components.
Source: OECD employer-survey on non-compete and related clauses; Orbis firm-level data; Andrews, Garnero and Holttinen (2026[72]), “Non-compete clauses and productivity: New cross-country firm-level evidence”.
Besides their impact on labour reallocation and knowledge diffusion, non-compete clauses could affect aggregate productivity through other channels. For example, the negative impact on within-firm productivity growth could be attenuated by increased investments in training and other intangible assets, which could boost innovation. But the empirical evidence on this point is mixed. Some studies find that a stronger use of non-compete clauses is associated with higher training intensity, particularly in occupations where such clauses are common (Starr, Prescott and Bishara, 2021[10]; Starr, 2019[76]; Kodama, Kambayashi and Izumi, 2025[51]). But there is little evidence that employees benefit from this training in the form of higher long-term earnings (Starr, 2026[77]). Other work suggests that increased training may partly reflect substitution effects: when firms cannot hire experienced workers because mobility is restricted, they hire less experienced workers and train them instead (Starr, Ganco and Campbell, 2018[78]).
When looking into the responses to the OECD-Bocconi employer survey, no significant differences in the use of non-compete clauses appear across firms based on their past innovation activity, growth or training.39 Figure 5.23 shows the average incidence of non-compete clauses based on past innovation activity (proxied by the introduction of new products, services or processes to the market in recent years), firm growth (increase in the number of employees over the last couple of years) and the reported share of firm employees that received training in the previous year. The use of non-compete clauses appears similar along these dimensions. In addition, when looking at the extensive margin only, over 40% of firms do not use non-compete clauses on any of their employees despite having introduced new products, services or processes, or training a large share of their workforce. While the data on innovation, training and use of non-compete clauses is purely descriptive, it does not appear to be the case that non-compete clauses are a pre‑requisite for such activities, at least not in all companies.40
Proportion of employees covered by a non-compete clause, as reported by employers, by firm characteristics

Note: Average firm-level non-compete incidence (workers covered by non-compete clauses), by firm characteristics. Innovator firms are those that have introduced new products, services or processes to the market since 2022. Growing firms are firms that report having increased their number of employees since 2022.Source: OECD-Bocconi employer level survey of non-compete and related clauses.
If anything, evidence supports the view that a regulatory framework that favours the use of non-compete clauses actually hinders aggregate innovation. By restricting mobility, stronger non-compete use is associated with lower entrepreneurship (Marx, 2022[79]; Starr, Balasubramanian and Sakakibara, 2018[59]; Jeffers, 2023[80]), lower aggregate innovation (Samila and Sorenson, 2011[58]), misallocation of inventive talent across firms (Johnson, Lipsitz and Pei, 2023[81]), and adverse effects on consumers (Lipsitz and Tremblay, 2024[14]).41 Reinmuth and Rockall (forthcoming[82]) provide further evidence for this, finding that making non-compete clauses easier to use significantly reduces innovation – particularly for the most novel patents – by restricting the flow of knowledge between firms. By analysing the trade‑off between reduced worker mobility and increased firm investment, Shi (2023[83]) finds that the costs imposed by non‑compete clauses are socially excessive and that regulatory approaches close to a full ban would deliver outcomes closest to the social optimum.
From a policy perspective, narrower instruments – such as non-disclosure agreements, non-solicitation clauses and trade secret protections – appear sufficient in many cases. Field experimental evidence shows that while non-compete clauses reduce mobility, they do not reduce unauthorised information sharing beyond what non-disclosure agreements already prevent (Cowgill, Freiberg and Starr, 2024[17]). Consistent with this, Greenwood, Kobayashi and Starr (forthcoming[16]) find that non-compete bans increase mobility while trade secret litigation remains flat in the short run and declines in the long run. Firms do not appear to raise wages following reforms introducing wage threshold suggesting that they do not value the ability to actually activate the clause (Hiraiwa, Lipsitz and Starr, 2024[40]). Surveys of legal practitioners indicate that alternative tools are generally viewed as adequate (Hiraiwa, Lipsitz and Starr, 2024[40]). Reflecting this assessment, one big tech company announced in 2022 that it would eliminate the use of non-compete clauses for most employees.42
Countries have taken a number of measures to restrict the use of non-compete clauses over the last decade. The most far-reaching initiative was the proposed federal ban adopted by the Federal Trade Commission (FTC) in the United States in 2024, which was subsequently challenged in court and ultimately abandoned. While the blanket ban has been vacated, the US FTC is still actively targeting anticompetitive non-compete clauses that constitute “unfair methods of competition” under Section 5 of the FTC Act. The current stance is that non-compete clauses will be challenged if they are anticompetitive; such clauses that are overly broad, apply to low-level workers, or are used by a dominant firm to stifle competition will face particular scrutiny. For instance, in September 2025, the FTC filed a major enforcement action against a large pet cremation company, alleging their use of non-compete clauses for nearly all employees (including low-wage workers) was anticompetitive. The same month, the FTC Chairman sent a series of warning letters to major healthcare employers and staffing companies, urging them to review any non-compete clauses or other restrictive employment-related agreements for compliance with the antitrust laws. At subnational level, the state of Minnesota in the United States enacted a near-total ban in 2023 joining California, North Dakota and Oklahoma where non-compete clauses have been banned for over a century. From 30 June 2026, a ban is also in force in the state of Washington.
While outright bans represent one policy extreme, they are far from the only option available. Most OECD countries have instead adopted more tailored approaches, combining restrictions on scope and procedural requirements with safeguards aimed at protecting workers while preserving legitimate business interests – see Andrews et al. (2026[24]) for an overview of OECD countries and Bishara and Luisetto (2025[23]) for an overview of state initiatives in the United States. These approaches can be grouped into six broad categories:
Earnings thresholds and income‑based exemptions: An increasing number of jurisdictions include earnings thresholds below which non-compete clauses are banned. For instance, since 2006, and reinforced by another reform in 2015, Austria has banned non-compete clauses for employees with below EUR 4 300 gross monthly earnings (which corresponds, broadly, to the 75th percentile of the wage distribution). Before that, Belgium and Luxembourg introduced similar thresholds in 1978 and 1989. In the United States, 11 states (see Section 5.2) have adopted income‑based bans, with thresholds that have been progressively increased over time. In Australia, the Federal Government announced in March 2025 a ban on non-compete clauses for employees earning less than the high-income threshold, currently AUD 183 100 per year, to take effect from 2027.43 The rationale for earnings thresholds is twofold. Lower-paid employees are less likely to have access to sensitive information, weakening – or even lifting – the justification for restricting their post-employment mobility. At the same time, these employees tend to have less bargaining power and fewer resources to negotiate contractual terms, making them more vulnerable to employer monopsony power.44
Industry- and occupation-specific carve‑outs: Another approach consists of banning non-compete clauses for specific industries or occupations. In many US states, non-compete clauses are prohibited for physicians, reflecting public policy concerns about patient access to healthcare providers. Similar long-standing bans apply to lawyers in many jurisdictions.45 While occupation- or contract-based exemptions can be effective in addressing clear misalignments between contractual restrictions and legitimate business needs, they also raise concerns about their overall coherence. Similar arguments regarding worker choice, mobility and public interest could apply across a wide range of professions, making narrowly defined carve‑outs difficult to justify on economic grounds alone. Beyond individual occupations, some jurisdictions have focussed on particular segments of the workforce. In the Netherlands, non-compete clauses were banned for employees on temporary contracts in 2015, following evidence that such clauses were disproportionately used in fixed-term employment relationships. In Canada, the province of Ontario in 2021 has limited the use of non-compete clauses to senior executives (defined as individuals holding “Chief” titles – CEO, CFO, COO, etc. – or the title of President).46 A similar rule is now being proposed by the Canadian Federal Government for federally regulated sectors such as banking, transport and telecommunications.
Compensation and consideration requirements: Many OECD countries require employers to compensate employees for the duration of a non-compete clause. Some have gone further by introducing minimum compensation rates. In Denmark, for example, compensation must amount to at least 40% of prior remuneration for clauses lasting up to six months and 60% for longer clauses, with stricter rules when multiple clauses apply. Finland introduced similar requirements in 2022. In Norway, the minimum compensation goes up to 100% if the employee does not get re‑employed. Minimum requirements exist also in Belgium, Germany, Poland and Sweden. Mandatory compensation internalises part of the cost of restricting mobility, discouraging the use of non-compete clauses when their benefits are limited, while providing income protection to affected employees. However, compensation requirements alone may be insufficient if clauses are poorly specified or there is limited compliance. Evidence from Finland shows that while the reform on compensation requirements seems to have resulted in more targeted use of non-compete clauses, significant challenges remain regarding the limited awareness of non-compete clauses amongst workers (Mahonen and Lyly-Yrjanainen, 2024[84]). Moreover, it cannot address the negative spillovers that non-compete clauses may generate for the workers and firms that are not part of the pact but suffer from reduced labour market fluidity.
Duration limits and proportionality: Setting maximum durations for non-compete clauses is another common policy tool. Several OECD countries have duration limits for non-compete clauses, ranging from six months in Spain to three years in Italy and Switzerland, and Denmark capped maximum duration to one year in its 2016 reform. In the United States, several jurisdictions – including Massachusetts, Oregon and Utah – limit the duration of a non-compete clause to 12 months, while others allow longer durations subject to heightened scrutiny. Duration limits offer clarity and predictability for both parties and help align restrictions with the time horizon over which sensitive information or competitive advantage is likely to remain relevant. In many industries, the value of such information depreciates rapidly, making longer restrictions difficult to justify.
Procedural safeguards: An increasing number of jurisdictions have introduced procedural requirements aimed at improving transparency. These include advance notice obligations,47 written disclosure requirements and explicit rights to legal consultation. For example, in the United States, Oregon and Colorado require employers to disclose non-compete clauses before employment begins, while Massachusetts mandates that employees be additionally informed of their right to consult legal counsel. Procedural safeguards are aimed at ensuring that non-compete clauses, where used, reflect genuine agreement rather than default inclusion in standard contracts.
Validity following termination: Finally, several countries condition the validity of non-compete clauses on the circumstances under which employment ends. In Belgium, Germany, Portugal48 and Switzerland, employers are generally prevented from activating non-compete clauses following dismissal without cause. In other jurisdictions, including Sweden, New Zealand and the United Kingdom, courts may take termination circumstances into account when assessing reasonableness. Such rules help prevent non-compete clauses from compounding the economic costs of involuntary job loss.
Policy approaches that focus only on the formal regulatory framework of non-compete and related clauses are unlikely to fully address their economic effects. As discussed in the chapter, even clauses that do not meet legal standards – because they are overly broad, lack compensation, or fail to satisfy procedural requirements – may nonetheless influence employee and firm behaviour. Therefore, enforcement institutions play a critical role. This includes competition authorities, which are responsible for detecting and sanctioning anticompetitive agreements between employers, such as wage‑fixing and no poaching arrangements, that restrict labour market competition independently of contractual non-compete clauses. In fact, for such agreements, the issue is not one of additional regulation but essentially one of detection and enforcement, as such practices are generally illegal per se. Strong involvement of competition authorities, credible sanctions and clear guidance have been central to recent enforcement efforts in this area.
For non-compete and related clauses, enforcement challenges are more diffuse. Labour inspectorates, courts and administrative bodies typically act only when disputes arise, leaving many potentially abusive clauses unchallenged. Moreover, the costs, delays and uncertainty associated with litigation may deter workers from contesting restrictions, further amplifying chilling effects. However, in the United States, Attorney Generals of a number of states have acted in the absence of disputes between private parties, threatening sanctions against companies using overbroad non-compete clauses, forcing companies to abandon their policies (e.g. in the case of People of the State of Illinois v. Check Into Cash of Illinois, LLC49). Yet, sanctions for excessively broad non-compete clauses are very rare. Spain is the only OECD country which requires employers to pay a fine if a non-compete agreement fails to meet minimum legal requirements.50 Some US states as well as Ontario in Canada also introduced financial penalties for employers who knowingly use overbroad non-compete clauses51 and questions emerge as to whether other OECD countries should introduce sanctions into their regulatory mix. Sanctions, if sufficiently severe, can help shifting the cost-benefit calculation away from routine inclusion of overly broad restrictions and foster a stronger compliance with existing regulations.
Beyond more effective legal enforcement, higher transparency and clarity are essential complements. Where legal frameworks are complex, fragmented or poorly communicated, employees may overestimate the strength and scope of contractual clauses. Conversely, clear rules, accessible information and visible enforcement can reduce uncertainty and weaken the deterrent effect of unenforceable clauses. This suggests that policy effectiveness depends not only on the content of regulation, but also on how rules are communicated, interpreted and enforced.52 Several policy options can help strengthen transparency and reduce behavioural distortions:
One approach is to require that any non-compete clause be accompanied by a clear statement of the applicable legal framework, including the minimum conditions that make a clause valid and the circumstances under which the clause would be void. Such requirements are common in consumer protection law and aim to counteract unfair or misleading contractual practices. By explicitly referencing the law, these measures can both inform workers and encourage employers to ensure higher compliance.
Plain-language and salience requirements can also play a role. Presenting the geographic and temporal scope of non-compete clauses in simple, standardised formats – such as tables or maps – can reduce misunderstandings and prevent inadvertent violations. Such measures help ensure that workers understand not only that a restriction exists, but also its practical implications.
Public information and advisory services provide an additional layer of support. Government-run websites explaining non-compete clauses in accessible language,53 helplines offering confidential advice, and mediation services54 can lower barriers to information and dispute resolution. Tools such as the “employment agreement builder”55 in New Zealand that assists employers in drafting compliant and proportionate contracts can also reduce reliance on boilerplate clauses and minimise unintentional non-compliance.
Employer organisations and trade unions can play an important complementary role by informing and educating their members about the legal framework, promoting good contractual practices, and helping to raise awareness and understanding of workers’ rights and employers’ obligations in this area. Research evidence from France shows that sectoral collective agreements have been important in shaping how non-compete clauses are used in practice – see Box 5.8.
France is, alongside Sweden, one of the few OECD countries where collective bargaining actively regulates non-compete clauses. Drawing on a dataset covering nearly a thousand sectoral collective bargaining agreements, Boeri et al. (forthcoming[85]) examine how social partners limit non-compete clause use and firms’ monopsony power.
Using a staggered difference‑in-differences approach on firm-level data from the French manufacturing sector (1996‑2023), the study finds that sectors covered by a collective agreement that goes beyond national case law in regulating non-compete clauses (e.g. by setting a minimum compensation, duration caps, or geographic scope) experience a reduction in firm-level markdowns (the ratio of the marginal revenue product of labour to the wage, a standard measure of monopsony power) of 1.3%‑2.2%. This effect strengthens over time, reaching 7‑10%, equivalent to an annual wage gain of EUR 1 305‑1 860. Effects are concentrated in smaller, lower-productivity, lower-wage firms, where workers are most exposed to non-compete misuse.
A complementary analysis exploits a 2002 ruling by the French Court of Cassation, which made financial compensation a universal condition for enforceability. The evidence shows that this national-level reform led to a significant reduction in monopsony power only in sectors where collective agreements already regulated non-compete clauses to some degree. In sectors with no prior regulation, the court ruling had no measurable effect. This finding points to a complementarity between statutory or judge‑made regulation at the national level and sectoral collective bargaining: social partners both set rules and support enforcement, without which national reforms may remain ineffective.
This chapter has documented substantial cross-country variation in the scope, stringency and enforcement of regulatory frameworks governing non-compete clauses. The empirical analysis finds some suggestive evidence that existing regulatory frameworks can partly mitigate the adverse effects of non-compete clauses on job mobility, allocative efficiency and productivity. However, regulation alone is unlikely to eliminate these effects. Even in countries with relatively strict legal requirements, non-compete clauses remain prevalent, and their economic impact often depends less on formal regulation than on how clauses are perceived, communicated and used in practice. This underscores both the importance and the limits of regulation as currently designed.
Effective policy on non-compete clauses cannot rely solely on defining when such clauses are allowed. It must also account for how workers and firms interpret, respond to and act upon contractual restrictions in practice. Improving transparency, reducing uncertainty and strengthening enforcement are key to ensuring that regulation translates into meaningful protection for workers and into more dynamic, competitive and productive labour markets. In parallel, competition policy can play a complementary role by addressing anticompetitive agreements between employers, which can suppress wages and job mobility independently of contractual clauses. Effective detection and enforcement of such practices help preserve competitive labour market conditions and reinforce the effectiveness of regulatory frameworks governing non-compete and related clauses.
Finally, any initiative to better regulate non-compete clauses should be considered in the broader context of post-employment clauses. Non-compete clauses do not operate in isolation. Firms may respond to tighter regulation by relying more heavily on alternative tools, such as non-solicitation clauses or training repayment agreements, potentially reproducing similar chilling effects on mobility. Experiences in countries such as Austria and Denmark, which have reformed multiple types of post-employment clauses in parallel, highlight the importance of addressing the broader contractual ecosystem to avoid regulatory substitution.
[94] Abrahams, S. and L. Fesko (2025), Noncompete Agreements and Firm Competition: Lessons from Women’s College Basketball, Elsevier BV, https://doi.org/10.2139/ssrn.5329971.
[86] ABS (2024), Restraint Clauses, Australia, 2023, Australian Bureau of Statistics, https://www.abs.gov.au/articles/restraint-clauses-australia-2023.
[74] Aghion, P. et al. (2005), “Competition and Innovation: an Inverted-U Relationship”, The Quarterly Journal of Economics, Vol. 120/2, pp. 701-728, https://doi.org/10.1093/qje/120.2.701.
[73] Aghion, P. and P. Howitt (1998), Endogenous Growth Theory, MIT Press.
[5] Aghion, P. and P. Howitt (1992), “A Model of Growth Through Creative Destruction”, Econometrica, Vol. 60/2, p. 323, https://doi.org/10.2307/2951599.
[36] Akavia (2021), Konkurrensklausuler –Används de för frekvent?, Akavia, Stockholm.
[89] Alves, J. et al. (2024), “Labour market power: New evidence on non-compete agreements and the effects of M&A in the UK”, CEP Discussion Paper, No. 1976.
[68] Anand, S. et al. (2017), “State enforceability of noncompete agreements: Regulations that stifle productivity!”, Human Resource Management, Vol. 57/1, pp. 341-354, https://doi.org/10.1002/hrm.21840.
[24] Andrews, D. et al. (2026), “The regulation of non-compete clauses across OECD countries”, OECD Social, Employment and Migration Working Papers, OECD Publishing, Paris, https://doi.org/10.1787/88e3eb6e-en.
[27] Andrews, D., M. Brennan and J. Buckley (2024), The ties that bind: five facts on post-employment restraints, e61 Research Note No. 12.
[71] Andrews, D. and F. Cingano (2014), “Public policy and resource allocation: evidence from firms in OECD countries”, Economic Policy, Vol. 29/78, pp. 253-296, https://doi.org/10.1111/1468-0327.12028.
[87] Andrews, D. and A. Garnero (2025), “Five facts on non-compete and related clauses in OECD countries”, OECD Economics Department Working Papers, No. 1833, OECD Publishing, Paris, https://doi.org/10.1787/727da13e-en.
[72] Andrews, D., A. Garnero and S. Holttinen (2026), “Non-compete clauses and productivity: New cross-country firm-level evidence”, OECD Publishing, Paris.
[26] Andrews, D. and B. Jarvis (2023), The Ghosts of Employers past: How Prevalent Are Non-Compete Clauses in Australia?, e61 Micro Note.
[47] Aresu, A., D. Erharter and B. Renner-Loquenz (2024), Antitrust in Labour Markets, European Commission, Brussels.
[6] Azar and Marinescu (2024), “Monopsony power in the labor market”, in Handbook of Labor Economics, Elsevier, https://doi.org/10.1016/bs.heslab.2024.11.007.
[61] Balasubramanian, N. et al. (2022), “Locked In? The Enforceability of Covenants Not to Compete and the Careers of High-Tech Workers”, Journal of Human Resources, Vol. 57/S, pp. S349-S396, https://doi.org/10.3368/jhr.monopsony.1218-9931r1.
[29] Balasubramanian, N., E. Starr and S. Yamaguchi (2024), “Employment Restrictions on Resource Transferability and Value Appropriation from Employees”, Strategic Management Journal, https://doi.org/10.1002/smj.3634.
[63] Bartelsman, E., S. Dobbelaere and A. Zona Mattioli (2024), “Non-compete Agreements, Tacit Knowledge and Market Imperfections”, DP, No. 17260, IZA.
[70] Bartelsman, E., J. Haltiwanger and S. Scarpetta (2013), “Cross-Country Differences in Productivity: The Role of Allocation and Selection”, American Economic Review, Vol. 103/1, pp. 305-334, https://doi.org/10.1257/aer.103.1.305.
[34] Bartsch, M., D. Grijpstra and R. Houweling (2021), De werking van het concurrentiebeding, Panteia.
[95] Beck Reed Riden (2026), 50 State Noncompete Chart, https://beckreedriden.com/50-state-noncompete-chart-2/.
[21] Bishara, N. (2011), “Fifty ways to leave your employer: relative enforcement of covenants not to compete, trends, and implications for employee mobility policy”, University of Pennsylvania Journal of Business Law, Vol. 13/3, pp. 751-795.
[23] Bishara, N. and L. Luisetto (2025), Goodbye, Noncompetes? Why Now and Policy Convergence, Elsevier BV, https://doi.org/10.2139/ssrn.5345981.
[22] Blake, H. (1960), “Employee Agreements Not to Compete.”, Harvard Law Review, Vol. 73, pp. 625-691.
[85] Boeri, T. et al. (forthcoming), “Collective bargaining and monopsony: The regulation of noncompete agreements in France”, Industrial Relations.
[28] Boeri, T., A. Garnero and L. Luisetto (2025), “Noncompete agreements in a rigid labor market: the case of Italy”, The Journal of Law, Economics, and Organization, Vol. 41/3, pp. 930-958, https://doi.org/10.1093/jleo/ewae012.
[39] Boesch, T., A. Narayan and R. Nunn (2025), How litigation shapes non-compete contracts’ effects on workers, Federal Reserve Bank of Minneapolis, Minneapolis.
[64] Buckley, J., E. Rankin and D. Andrews (2024), Non-compete clauses, job mobility and wages in Australia, e61 Research Note.
[45] Callaci, B. et al. (2024), “The Effect of Franchise No-Poaching Restrictions on Worker Earnings”, Review of Economics and Statistics, pp. 1-35, https://doi.org/10.1162/rest_a_01544.
[97] Causa, O., N. Luu and M. Abendschein (2021), “Labour market transitions across OECD countries: Stylised facts”, OECD Economics Department Working Papers, No. 1692, OECD Publishing, Paris, https://doi.org/10.1787/62c85872-en.
[69] Chang, K. et al. (2026), “The Effect of Noncompete Enforceability on Productivity: Evidence from a New State-Level Manufacturing Dataset”, AEA Papers and Proceedings, Vol. 116, pp. 256-261, https://doi.org/10.1257/pandp.20261075.
[75] Charles R. Hulten, E. (ed.) (2001), Aggregate Productivity Growth. Lessons from Microeconomic Evidence, University of Chicago Press, http://www.nber.org/chapters/c10129.
[93] CMA (2024), Competition and market power in UK labour markets, Competition and Markets Authority, London.
[91] Cohen, L., U. Gurun and N. Ozel (2023), Too Many Managers: The Strategic Use of Titles to Avoid Overtime Payments, National Bureau of Economic Research, Cambridge, MA, https://doi.org/10.3386/w30826.
[33] Colvin, A. and H. Shierholz (2019), Noncompete Agreements., Economic Policy Institute, Washington D.C.
[17] Cowgill, B., B. Freiberg and E. Starr (2024), “Clause and Effect: Theory and Field Experimental Evidence on Noncompete Clauses”, No. 5012370, SSRN.
[38] Crane, D. (2024), “Scrutiny of Employee Covenants Not to Compete Under the Rule of Reason: An Empirical Inquiry”, Notre Dame Law Review Reflection, Vol. 100/1, pp. 1-12.
[4] Decker, R. et al. (2020), “Changing Business Dynamism and Productivity: Shocks versus Responsiveness”, American Economic Review, Vol. 110/12, pp. 3952-3990, https://doi.org/10.1257/aer.20190680.
[44] Delabastita, V. and M. Rubens (2022), “Monopsony and Industrialization”, SSRN Electronic Journal, https://doi.org/10.2139/ssrn.4208173.
[56] Engbom, N., A. Baksy and D. Caratelli (2026), The Long-Term Decline of the U.S. Job Ladder, National Bureau of Economic Research, Cambridge, MA, https://doi.org/10.3386/w34981.
[96] Fair Competition Law (2026), Updated restrictive covenant “low-wage” threshold/criteria chart, https://faircompetitionlaw.com/2026/01/21/updated-restrictive-covenant-low-wage-threshold-criteria-chart-january-21-2026/.
[92] Ganco, M. et al. (2022), “Strategic Restraint: Why Companies Do Not Use Noncompete Agreements When They Can?”, SSRN Electronic Journal, https://doi.org/10.2139/ssrn.4055701.
[52] Garmaise, M. (2009), “Ties that Truly Bind: Noncompetition Agreements, Executive Compensation, and Firm Investment”, Journal of Law, Economics, and Organization, Vol. 27/2, pp. 376-425, https://doi.org/10.1093/jleo/ewp033.
[46] Gibson, M. (2025), “Employer market power in Silicon Valley”, The Economic Journal, https://doi.org/10.1093/ej/ueaf109.
[99] Gottfries, A. and G. Jarosch (2026), “Dynamic Monopsony with Large Firms”, mimeo.
[41] Gottfries, A. and G. Jarosch (2025), Wage Fixing, National Bureau of Economic Research, Cambridge, MA, https://doi.org/10.3386/w33501.
[19] Graves, C. (2022), “Questioning the Employee Non-solicitation Covenant”, Loyola of Los Angeles Law Review, Vol. 55/4, pp. 959-1004.
[16] Greenwood, B., B. Kobayashi and E. Starr (forthcoming), “Can You Keep a Secret? Banning Noncompetes Does Not Increase Trade Secret Litigation”, Journal of Law, Economics, and Organization.
[20] Harris, J. (2021), “Unconscionability in Contracting for Worker Training”, Alabama Law Review, Vol. 72/4, pp. 723-783.
[88] Hart, O. (1995), Firms, Contracts, and Financial Structure, Clarendon Press.
[40] Hiraiwa, T., M. Lipsitz and E. Starr (2024), “Do Firms Value Court Enforceability of Noncompete Agreements? A Revealed Preference Approach”, Review of Economics and Statistics, pp. 1-47, https://doi.org/10.1162/rest_a_01505.
[18] Hrdy, C. and C. Seaman (2024), “Beyond Trade Secrecy: Confidentiality Agreements That Act Like Noncompetes”, 133 Yale Law Journal.
[13] Johnson, M., K. Lavetti and M. Lipsitz (2025), “The Labor Market Effects of Legal Restrictions on Worker Mobility”, Journal of Political Economy, Vol. 133/9, pp. 2735-2793, https://doi.org/10.1086/736217.
[81] Johnson, M., M. Lipsitz and A. Pei (2023), Innovation, Inventor Mobility, and the Enforceability of Noncompete Agreements, National Bureau of Economic Research, Cambridge, MA, https://doi.org/10.3386/w31487.
[57] Karolyi, A. (ed.) (2019), “Destructive Creation at Work: How Financial Distress Spurs Entrepreneurship”, The Review of Financial Studies, Vol. 33/9, pp. 4061-4101, https://doi.org/10.1093/rfs/hhz110.
[31] Klein, C. and R. Leutner (2006), AK/ÖGB-Studie belegt: Unfaire Arbeitsvertragsklauseln sind Massenphänomen, Pressekonferenz am 25. Jänner 2006.
[51] Kodama, N., R. Kambayashi and A. Izumi (2025), “Non-compete Agreements: Human Capital Investments or Compensated Wages?”, DP, No. 17685, IZA.
[98] Lafontaine, F., L. Luisetto and J. Prescott (2025), Mobility-Restricting Covenants in Business Contracts: The Case of Franchising, Elsevier BV, https://doi.org/10.2139/ssrn.5870142.
[66] Lavetti, K., C. Simon and W. White (2019), “The Impacts of Restricting Mobility of Skilled Service Workers”, Journal of Human Resources, Vol. 55/3, pp. 1025-1067, https://doi.org/10.3368/jhr.55.3.0617-8840r5.
[60] Lipsitz, M. and E. Starr (2022), “Low-Wage Workers and the Enforceability of Noncompete Agreements”, Management Science, Vol. 68/1, pp. 143-170, https://doi.org/10.1287/mnsc.2020.3918.
[14] Lipsitz, M. and M. Tremblay (2024), “Noncompete Agreements and the Welfare of Consumers”, American Economic Journal: Microeconomics, Vol. 16/4, pp. 112-153, https://doi.org/10.1257/mic.20210426.
[84] Mahonen, E. and M. Lyly-Yrjanainen (2024), Selvitys eduskunnalle kilpailukieltosopimusten kaytosta vuonna 2023, https://julkaisut.valtioneuvosto.fi/server/api/core/bitstreams/c4fa47f1-e633-4e95-a186-db4e952fec48/content.
[79] Marx, M. (2022), “Employee Non-compete Agreements, Gender, and Entrepreneurship”, Organization Science, Vol. 33/5, pp. 1756-1772, https://doi.org/10.1287/orsc.2021.1506.
[53] Marx, M., D. Strumsky and L. Fleming (2009), “Mobility, Skills, and the Michigan Non-Compete Experiment”, Management Science, Vol. 55/6, pp. 875-889, https://doi.org/10.1287/mnsc.1080.0985.
[12] Moscarini, G. and F. Postel-Vinay (2016), “Wage Posting and Business Cycles”, American Economic Review, Vol. 106/5, pp. 208-213, https://doi.org/10.1257/aer.p20161051.
[30] O’Connor, C. (2014), Does Jimmy John’s Non-Compete Clause For Sandwich Makers Have Legal Legs?, https://www.forbes.com/sites/clareoconnor/2014/10/15/does-jimmy-johns-non-compete-clause-for-sandwich-makers-have-legal-legs/.
[1] OECD (2025), OECD Economic Outlook, Volume 2025 Issue 2: Resilient Growth but with Increasing Fragilities, OECD Publishing, Paris, https://doi.org/10.1787/9f653ca1-en.
[3] OECD (2025), “Reviving growth in a time of workforce ageing: The role of job mobility”, in OECD Employment Outlook 2025: Can We Get Through the Demographic Crunch?, OECD Publishing, Paris, https://doi.org/10.1787/194a947b-en.
[9] OECD (2022), “Monopsony and concentration in the labour market”, in OECD Employment Outlook 2022: Building Back More Inclusive Labour Markets, OECD Publishing, Paris, https://doi.org/10.1787/1bb305a6-en.
[8] OECD (2022), “Purchasing Power and Buyers’ Cartels”, OECD Roundtables on Competition Policy Papers, No. 280, OECD Publishing, Paris, https://doi.org/10.1787/3fab0781-en.
[42] OECD (2020), Competition in Labour Markets, https://www.oecd.org/en/publications/competition-issues-in-labour-markets_66980788-en.html.
[7] OECD (2019), “Labour market regulation 4.0: Protecting workers in a changing world of work”, in OECD Employment Outlook 2019: The Future of Work, OECD Publishing, Paris, https://doi.org/10.1787/9ee00155-en.
[15] Patault, B. and C. Lenoir (2024), “Customer Capital Spillovers: Evidence from Sales Managers in International Markets”, American Economic Journal: Applied Economics, Vol. 16/4, pp. 404-443, https://doi.org/10.1257/app.20220572.
[49] Posner, E. and C. Volpin (2023), “No-poach Agreements: An Overview of EU and National Case Law”, SSRN Electronic Journal, https://doi.org/10.2139/ssrn.4447709.
[65] Potter, T., A. Kurmann and B. Hobijn (2026), “The Impact of Noncompetes on Wages and Job Tenure: New Evidence from NLSY Data”, AEA Papers and Proceedings, Vol. 116, pp. 273-277, https://doi.org/10.1257/pandp.20261078.
[48] Prager, E. (2025), Antitrust Enforcement in Labor Markets, National Bureau of Economic Research, Cambridge, MA, https://doi.org/10.3386/w34572.
[25] Prescott, J., N. Bishara and E. Starr (2016), “Understanding Noncompetition Agreements: The 2014 Noncompete Survey Project”, Michigan State Law Review, Vol. 2, pp. 369-464.
[37] Prescott, J. and E. Starr (2021), “Subjective Beliefs about Contract Enforceability”, SSRN Electronic Journal, https://doi.org/10.2139/ssrn.3873638.
[80] Puri, M. (ed.) (2023), “The Impact of Restricting Labor Mobility on Corporate Investment and Entrepreneurship”, The Review of Financial Studies, Vol. 37/1, pp. 1-44, https://doi.org/10.1093/rfs/hhad054.
[82] Rockall, E. and K. Reinmuth (forthcoming), “Protect or Prevent? Non-Compete Agreements and Innovation”, American Economic Journal: Applied Economics.
[50] Rothstein, D. and E. Starr (2022), “Noncompete agreements, bargaining, and wages: evidence from the National Longitudinal Survey of Youth 1997”, BLS Monthly Labor Review.
[11] Rubin, P. and P. Shedd (1981), “Human Capital and Covenants Not to Compete”, The Journal of Legal Studies, Vol. 10/1, pp. 93-110, https://doi.org/10.1086/467672.
[58] Samila, S. and O. Sorenson (2011), “Noncompete Covenants: Incentives to Innovate or Impediments to Growth”, Management Science, Vol. 57/3, pp. 425-438, https://doi.org/10.1287/mnsc.1100.1280.
[2] Shambaugh, J., R. Nunn and P. Liu (2018), How Declining Dynamism Affects Wages, Brookings Institution.
[43] Sharma, G. (2025), “Collusion Among Employers in India”, https://garimasharma.com/files/collusion_gs.pdf.
[83] Shi, L. (2023), “Optimal Regulation of Noncompete Contracts”, Econometrica, Vol. 91/2, pp. 425-463, https://doi.org/10.3982/ecta18128.
[77] Starr, E. (2026), “The Economics of Noncompete Clauses”, Journal of Economic Perspectives, Vol. 40/1.
[76] Starr, E. (2019), “Consider This: Training, Wages, and the Enforceability of Covenants Not to Compete”, ILR Review, Vol. 72/4, pp. 783-817, https://doi.org/10.1177/0019793919826060.
[59] Starr, E., N. Balasubramanian and M. Sakakibara (2018), “Screening Spinouts? How Noncompete Enforceability Affects the Creation, Growth, and Survival of New Firms”, Management Science, Vol. 64/2, pp. 552-572, https://doi.org/10.1287/mnsc.2016.2614.
[67] Starr, E., J. Frake and R. Agarwal (2019), “Mobility Constraint Externalities”, Organization Science, Vol. 30/5, pp. 961-980, https://doi.org/10.1287/orsc.2018.1252.
[78] Starr, E., M. Ganco and B. Campbell (2018), “Strategic human capital management in the context of cross‐industry and within‐industry mobility frictions”, Strategic Management Journal, Vol. 39/8, pp. 2226-2254, https://doi.org/10.1002/smj.2906.
[10] Starr, E., J. Prescott and N. Bishara (2021), “Noncompete Agreements in the US Labor Force”, The Journal of Law and Economics, Vol. 64/1, pp. 53-84, https://doi.org/10.1086/712206.
[35] Starr, E., J. Prescott and N. Bishara (2020), “The Behavioral Effects of (Unenforceable) Contracts”, The Journal of Law, Economics, and Organization, Vol. 36/3, pp. 633-687, https://doi.org/10.1093/jleo/ewaa018.
[90] Streefkerk M., Elshout S. and Cuelenaere B. (2015), Concurrentiebeding. Dataverzameling Bij Het LISS Pane, CentER Data, Tilburg.
[55] US Treasury (2022), The State of Labor Market Competition, https://home.treasury.gov/system/files/136/State-of-Labor-Market-Competition-2022.pdf.
[54] US Treasury (2016), Non-compete Contracts: Economic Effects and Policy Implications., Office of Economic Policy, Washington, DC.
[32] VIVE (2025), Ansættelsesklausuler på det danske arbejdsmarked.
[62] Young, S. (2021), “Noncompete Clauses, Job Mobility, and Job Quality: Evidence from a Low-Earning Noncompete Ban in Austria”, SSRN Electronic Journal, https://doi.org/10.2139/ssrn.3811459.
The target population consists of private‑sector employees aged 18 to 64 who were in paid employment at the time of the survey. The following groups were excluded through screening questions: self-employed workers and independent contractors; public-sector and non-profit employees; unemployed individuals, students and retirees. This definition ensures that respondents are subject to private employment contracts and potentially exposed to non-compete clauses and related restrictions.
The survey was implemented by Ipsos NV in 14 OECD countries: Belgium, Canada, France, Germany, Japan, Korea, Mexico, New Zealand, Poland, Portugal, Spain, Sweden, Switzerland and the United Kingdom. A common core questionnaire and methodological framework were applied in all countries, with limited country-specific adaptations where required by national legal contexts.
Data were collected using Computer-Assisted Web Interviewing (CAWI). Respondents were recruited from Ipsos’ proprietary online panels and selected partner panels. The sample comprised two components: (i) a general population sample of private‑sector employees used to estimate the prevalence of non-compete clauses; and (ii) a boost sample of employees reporting a non-compete clause in their current job, designed to ensure sufficient observations for detailed analysis of clause content, use and perceived effects.
The questionnaire was developed jointly by the OECD, Bocconi University and Ipsos, drawing on previous employee‑level surveys on non-compete clauses (Starr, Prescott and Bishara, 2021[10]; Andrews and Jarvis, 2023[26]; Boeri, Garnero and Luisetto, 2025[28]) and adapting them for cross-country use.
The final questionnaire includes modules covering: survey introduction and consent; socio-demographic characteristics; information on the current job and employer; features of the employment relationship; presence and content of non-compete and related clauses; circumstances under which clauses were agreed; and experiences with non-compete clauses over the career.
The final English master questionnaire was translated by professional translators into French, Dutch, German, Japanese, Korean, Polish, Portuguese, Spanish and Swedish, and all translations were proofread by local native speakers as well as by native speakers at the OECD.
A pilot survey was conducted prior to main fieldwork. Following the pilot, only minor adjustments were introduced, primarily to improve clarity and reduce item non-response (including converting selected open-ended questions into closed-ended formats and clarifying country-specific legal references).
The survey relies on non-probability online access panels. Respondents were selected using a combination of random allocation and targeted recruitment within pre‑defined quotas. Sampling was conducted consistently across countries using Ipsos’ standard procedures.
Ipsos panels consist of individuals who have voluntarily agreed to participate in survey research and are recruited through multiple high-quality sources (including online advertising, co-registration, social media and search engine marketing). A double opt-in process is used for all panellists, requiring explicit confirmation of participation at registration. Panel members are regularly profiled to allow efficient targeting by socio-demographic and employment characteristics. Respondents receive incentive points for participation, with rewards calibrated to survey length and complexity.
All respondents provided informed consent prior to participation. Data were processed in accordance with applicable data-protection regulations, including the GDPR. Personal identifiers were never shared with the research team, and all datasets delivered were anonymised or pseudonymised.
Ipsos applies extensive quality assurance procedures to ensure that respondents are real, unique and engaged. These include geo-IP validation, duplicate device detection, proxy detection and monitoring of response patterns. Panel usage rules are applied to limit respondent burden and avoid conditioning effects, including rest periods between surveys, category exclusions for recently surveyed topics, and exclusion of respondents who participated in the pilot survey from the main fieldwork.
Country-specific quotas were applied to approximate the structure of the employee population. Hard quotas were enforced for sex, age group and region, ensuring alignment with official employment statistics. Soft quotas were monitored for education level (based on ISCED groupings) and industry sector (grouped NACE categories). Quotas were defined separately by country using the most recent available national or international labour force statistics. While best efforts were made to achieve all quota targets during fieldwork, some deviations – particularly for lower-educated groups – remained and were addressed through post-stratification weighting.
A pilot survey was conducted between 30 June and 4 July 2025, with approximately 20 interviews per participating country. The pilot tested questionnaire flow, survey length and data-quality procedures. It confirmed overall questionnaire suitability but identified challenges in reaching younger and lower-educated respondents and highlighted the need for stricter minimum duration thresholds, which were subsequently implemented.
Main fieldwork took place between 28 July and mid-September 2025. After data-quality checks, a total of 31 762 completed interviews were retained across the ten countries.
Median completion times were consistent with the planned interview length and varied depending on whether respondents reported a non-compete clause.
Minutes
Because quota sampling and survey routers were used, conventional response rates cannot be computed. Indicative response rates, defined as the ratio of completed interviews to all survey terminations (including screen-outs, drop-outs and over-quota cases), are reported below.
Note: Response rates are calculated as the total number of completes (ahead of quality checks), divided by the number of completed interviews + respondents that were screened out (i.e. refusing to accept the survey conditions, or below the age of 18 or above the age of 64, or refusing to answer the region question or the employment status question or the current employer question or the sector question, or working in certain sectors, or not being employed, or working for the non-profit or public sectors) + over-quota (i.e. terminated because the quotas in place were full) + respondents that dropped out (i.e. respondents who started the survey but did not complete all questions, i.e. partially completed questionnaires).
Partial interviews and break-offs were more frequent among respondents aged 25‑54, women, higher-educated respondents, and employees in service‑sector industries. Missing information limits precise inference, but these patterns are consistent with known non-response dynamics in online surveys.
Multiple data-quality checks were applied, including detection of speeding, straight-lining and high item non-response. Minimum duration thresholds (3 minutes for respondents without a non-compete clause and 4 minutes for those with a clause) were enforced. Interviews failing quality criteria were removed prior to analysis. The share of interviews excluded for low quality ranged between approximately 5% and 13% across countries.
Post-stratification weights were computed separately for each country using raking procedures. Weighting variables included sex, age group, region, education level and industry sector. Weight trimming was applied where necessary to preserve weighting efficiency.
Note: Weighting efficiency measures the extent to which variation in survey weights – typically arising from raking to population margins – reduces the effective sample size and increases the variance of survey estimates relative to an unweighted sample.
Lower efficiency in Mexico reflects persistent under-representation of lower-educated respondents, which weighting could not fully correct.
The target population consists of for-profit firms with five or more employees operating in the private sector. Firms with fewer than five employees were excluded, as were non-profit organisations. The survey also excluded firms operating primarily in public administration and defence, education, health and social work activities, activities of households as employers, and extraterritorial organisations. Within each eligible firm, the target respondent was the person responsible for, or with in-depth knowledge of, employment contracts, personnel retention and hiring practices (typically owner-managers, CEOs, senior managers or HR managers).
The employer-level survey was implemented in 15 OECD countries: Belgium, Canada, France, Germany, Italy, Japan, Korea, Mexico, New Zealand, Poland, Portugal, Spain, Sweden, Switzerland and the United Kingdom. A common core questionnaire and methodological framework were applied in all countries, with limited country-specific adaptations where required by national legal contexts.
Data were collected using Computer-Assisted Telephone Interviewing (CATI) using probabilistic sampling frames. All respondents provided informed consent prior to participation. Data were processed in compliance with applicable data-protection regulations, including the GDPR. Personal identifiers were separated from survey responses, and only anonymised or pseudonymised datasets were shared with the OECD.
The master questionnaire was developed jointly by the OECD, Bocconi University and Ipsos. It drew inspiration from a prior statistical survey on non-compete clauses conducted in Australia (ABS, 2024[86]) and was adapted for cross-country use and CATI administration. The adaptation included detailed interviewer instructions, definitions of contractual clauses and probing guidance to ensure consistent interpretation across countries.
The questionnaire comprises the following main sections:
survey introduction and screening;
firm characteristics (sector, size, business environment);
use of non-compete clauses and related contractual provisions;
coverage of clauses across employees and employee types;
enforcement practices and perceived effectiveness;
industry-wide practices and awareness of anti-competitive labour market agreements.
The final English master questionnaire was translated by professional translators into Dutch, French, German, Italian, Japanese, Korean, Polish, Portuguese, Spanish and Swedish, and all translations were proofread by local native speakers as well as by native speakers at the OECD.
A pilot survey was conducted prior to main fieldwork. Following the pilot, only a minor clarification was introduced to the definition of non-compete clauses. No additional questions were added during main fieldwork.
The survey universe includes all eligible for-profit firms with five or more employees operating in the following grouped NACE sectors:
Agriculture, manufacturing and mining (A, B, C);
Construction, engineering, waste collection and treatment (D, E, F);
Trade, transport, accommodation, food, arts and entertainment (G, H, I, R);
Information and communication, financial and insurance activities, real estate, professional and administrative services, and other services (J, K, L, M, N, S).
Sampling frames were sourced primarily from Dun & Bradstreet business registers, complemented by Orbis data in Portugal, Sweden, Switzerland and the United Kingdom to improve coverage of larger firms. These registers provide recent, high-coverage information on firm size, sector and contact details.
A stratified random sampling design was employed. Firms were stratified by:
company size (5‑9, 10‑49, 50‑249, and 250+ employees);
industry sector (four grouped NACE categories).
This resulted in 16 stratification cells per country. A minimum of 400 completed interviews per country was targeted. Sampling was implemented disproportionately across size classes to ensure adequate representation of larger firms, which employ a substantial share of employees but are relatively few in number. To better reflect the distribution of employees across firms, a hybrid allocation strategy was adopted, combining employee‑proportional and firm-proportional approaches. The balance between these approaches varied by country, reflecting differences in sample availability and firm-size distributions. In particular, a 75% employee‑proportional design in Belgium, Canada, France, Germany, Italy, Japan, Korea, Mexico, Poland, Spain and the United Kingdom, while, due to a lack of enough observations for large firms, a 33% employee‑proportional design was used in Portugal, a 20% employee‑proportional design in Switzerland, an 18% employee‑proportional design in New Zealand and a 15% employee‑proportional design in Sweden, with the remainder being firm-proportional.
Eligible respondents were identified through screening questions and, where necessary, interviewers requested referral to a more appropriate colleague within the firm. A structured contact protocol was applied:
at least five contact attempts per telephone number;
contact attempts spread over different days and times during business hours;
a minimum fieldwork window of 14 days before classifying a case as non-contact;
appointments scheduled at respondents’ convenience.
This protocol was designed to maximise the likelihood of reaching senior decision makers, particularly in larger firms.
A pilot survey was conducted in June – July 2025, with approximately 10‑11 interviews per country. The pilot tested questionnaire comprehension, interview length, and fieldwork procedures. Median interview durations exceeded initial expectations, particularly for firms using non-compete clauses. Pilot feedback informed interviewer guidance and a minor clarification of the non-compete definition but did not lead to substantive questionnaire changes.
Main fieldwork was conducted between June and September 2025. In total, more than 6 112 employer interviews were completed across the OECD and Bocconi country groups.
Dedicated interviewer teams were used in each country, ranging from 8 to 9 interviewers. All interviewers received project-specific training, including detailed briefings on survey objectives, key concepts, interviewer instructions and quality control requirements. Supervisors monitored fieldwork continuously.
Survey duration differed systematically between firms using non-compete clauses and those not using them, reflecting the routing structure of the questionnaire.
Minutes
Durations were broadly similar across countries and consistent with expectations for CATI business surveys covering complex contractual practices.
Across both the OECD and Bocconi country groups, a large number of call attempts were required to reach eligible respondents, reflecting the seniority of the target respondents and the nature of CATI business surveys.
Eligibility rates (i.e. percentage of contacted respondents who met the criteria to participate in the survey) generally ranged between 70% and 85% once contact was established. Combined refusal rates (proportion of contacted individuals or companies who declined to participate in the survey, including immediate refusals and refusals by confirmed eligible respondents) typically ranged between 15% and 20% across countries. The resulting response rate (i.e. number of completed interviews divided by the number of completed and partial interviews (i.e. drop-outs) plus the number of non-interviews (refusals, non-contacts, and cases of unknown eligibility) was low – around 2‑3% – but consistent with international experience for telephone‑based employer surveys.56 Analysis of partial interviews and break-offs indicates that non-response was more frequent among:
firms in manufacturing, construction and engineering sectors;
smaller firms (5‑49 employees);
firms where the appropriate respondent could not be easily identified or reached.
As is common in CATI business surveys, information on non-respondents is limited, and results should be interpreted with this limitation in mind.
Multiple quality checks were implemented, including detection of speeding, straight-lining and high item non-response. Interviews were flagged as low quality if multiple criteria were breached. Only two interviews were removed for low quality across all countries.
Item non-response remained below 10% for all questions, indicating good respondent engagement despite the technical nature of the questionnaire.
Post-stratification weights were calculated separately for each country, using the same sector-by-size stratification cells employed in the sampling design. Weights were constructed to align the achieved samples with the distribution of employees across firms, rather than the distribution of firms alone, reflecting the analytical focus on the number of employees covered by contractual provisions.
Official business statistics were used as reference sources, including Eurostat Structural Business Statistics and Business Demography, with country-specific adjustments where necessary to match survey size‑class definitions.
In the context of this employer survey, weighting efficiency should be interpreted with caution and is not used as a primary measure of data quality. Post-stratification weights were calculated using a single target distribution based on the crossed sector-by-company-size structure, without iterative raking across multiple dimensions. Moreover, the survey deliberately employed a disproportionate sampling design to adequately represent larger firms, which account for a large share of employment but a small share of firms. Consequently, the presence of relatively large or small weights – and lower efficiency scores in some countries – is an expected outcome of the design and reflects differences in sample availability and alignment with employee‑proportional targets, rather than deficiencies in the underlying data.
Note: Weighting efficiency measures the extent to which variation in survey weights – typically arising from raking to population margins -reduces the effective sample size and increases the variance of survey estimates relative to an unweighted sample.
Share of employees bound by non-compete clauses as reported by employees and 95% confidence intervals (CI)

Source: OECD-Bocconi employee‑level survey.

Source: OECD-Bocconi employee survey on non-compete and related clauses.

Note: None of the correlations is statistically significant at conventional levels.
Source: OECD-Bocconi employee and employer surveys and Andrews et al. (2026[24]), “The regulation of non-compete clauses across OECD countries”, https://doi.org/10.1787/88e3eb6e-en.

Source: Panel A: OECD employer survey on non-compete and related clauses. Panel B: OECD employee survey on non-compete and related clauses.

Source: Panel A: OECD-Bocconi employer survey on non-compete and related clauses. Panel B: OECD-Bocconi employee survey on non-compete and related clauses.

Source: Panel A: OECD-Bocconi employer survey on non-compete and related clauses. Panel B: OECD-Bocconi employee survey on non-compete and related clauses.

Source: Panel A: OECD-Bocconi employer survey on non-compete and related clauses. Panel B: OECD-Bocconi employee survey on non-compete and related clauses.

Source: Panel A: OECD-Bocconi employer survey on non-compete and related clauses. Panel B: OECD-Bocconi employee survey on non-compete and related clauses.
Including only firms declaring that they definitely do include post-employment restraint clause in contracts

Source: OECD-Bocconi employer survey on non-compete and related clauses.
Share of non-compete clauses that appear to fall short of legal requirements, including only employees who declare that they definitely have a non-compete clause, to have read it carefully and to have understood it well

Note: Lower/upper bound differ in how an employee saying “don’t know” or “prefer not to answer” on questions on the duration/compensation/scope is considered. For the upper bound, answering “don’t know” or “prefer not to answer” does NOT make the clause invalid, while it does for the lower bound.
Source: OECD-Bocconi employee survey on non-compete and related clauses.
Note: Experience denotes years of total work experience, proxied by age adjusted for years in education. Current NCC is a non-compete clause indicator, taking a value of one for employees with a non-compete clause in their current job. Past NCC is an indicator variable taking a value of one for employees with a non-compete in a previous job. High education refers to employees who have completed tertiary education. Low + mid education refers to employees without tertiary education. The sample is restricted to employees with a non-disclosure agreement in current job. All regressions control for employee, job and firm characteristics and include industry x occupation and country fixed effects. Robust standard errors in parentheses. Stars denote standard significance levels: * p < 0.1, ** p < 0.05, *** p < 0.01.
Source: OECD-Bocconi employee survey on non-compete and related clauses.
Note: Tenure denotes years in current job. NCC is a non-compete clause indicator, taking a value of one for employees with a non-compete clause in their current job. Enforceable is an indicator variable taking a value of one for employees with non-compete clauses that are likely to be upheld in court. High education refers to employees who have completed tertiary education. Low + mid education refers to employees without tertiary education. The sample is restricted to employees with a non-disclosure agreement in their current job. All regressions control for employee, job and firm characteristics and include industry x occupation and country fixed effects. Robust standard errors in parentheses. Stars denote standard significance levels: * p < 0.1, ** p < 0.05, *** p < 0.01.
Source: OECD-Bocconi employee survey on non-compete and related clauses and Andrews et al. (2026[24]), “The regulation of non-compete clauses across OECD countries”, https://doi.org/10.1787/88e3eb6e-en.
← 1. The protection of trade secrets is not limited to contractual instruments such as non-disclosure agreements, but is also regularly ensured through statutory and criminal law. For instance, in Germany, the Trade Secrets Act (Geschäftsgeheimnisgesetz) provides civil remedies and, in serious cases, criminal sanctions; in France, the unlawful acquisition, use or disclosure of trade secrets may give rise to civil liability and criminal sanctions under the Commercial Code; in Switzerland, the unauthorised disclosure of a manufacturing or business secret is punishable under the Swiss Criminal Code, while the Federal Act on Unfair Competition prohibits the exploitation or disclosure of trade secrets obtained through improper means; and in the United Kingdom, trade secrets are protected through a combination of statutory law and criminal offences related to fraud and misuse of confidential information. These regimes provide legal protection of confidential business information independently of non-compete clauses.
← 2. Evidence from commercial contracts in franchising suggests that information-protection rationales for restrictive covenants are real – with covenant use tracking individuals’ access to proprietary information (Lafontaine, Luisetto and Prescott, 2025[98]).
← 3. Although non-compete clauses are generally considered beneficial for firms, Ganco et al. (2022[92]) show that, while such clauses may enhance employee retention, they can also diminish a firm’s attractiveness and ability to recruit staff, in particular amongst firms behind the productivity frontier. This may explain why some firms chose not to use non-compete clauses, even when they are allowed and used by competitors.
← 4. Consistent with this, Babina (2019[57]) shows, using US matched employer-employee data, that employees are significantly more likely to depart financially distressed firms to found new ventures in states where noncompete clauses are less enforceable – suggesting that non-compete clauses suppress a form of productive reallocation that would otherwise occur precisely when incumbent firms are unable to exploit their own growth opportunities.
← 5. The ban proposed in the United States in 2024 by the Federal Trade Commission (FTC), since vacated, applied to non-compete clauses and “functional” equivalents. In addition, in 2024, the General Counsel of the US National Labor Relations Board issued a memorandum declaring training repayment agreements (pejoratively called “TRAPs”) as unlawful. The memorandum was rescinded by the new General Counsel in February 2025. In 2015, Austria made the use of repayment of training clauses more restrictive after liberalising it in 2006. Denmark restricted the use of both non-compete clauses and non-solicitation of customers in 2016.
← 6. The Australian Government has announced that from 2027 it will ban non-compete clauses for low- and middle‑income employees earning less than the high-income threshold in the Fair Work Act 2009 (currently AUD 183 100 and adjusted annually on 1 July). This reform would make Australia one of the OECD countries with the strictest regulations.
← 7. For most countries, the overall ranking produced by the OECD index is consistent with that obtained using the original Bishara (2011[21]) index – see robustness tests in Andrews et al. (2026[24]) – suggesting that cross-country differences are driven primarily by core legal features already identified in the US literature. Austria, France, Luxembourg and Spain constitute the main exceptions. Specifically, in Austria and Luxembourg, given the presence of a wage threshold that restricts the use of non-compete clauses to higher-paid employees, dimensions 2, 3, 4, 5, 6, 7 and 8 are halved. In France, collective agreements play a major role in the regulation of non-compete clauses. In Spain, employers are subject to an obligation to pay damages if a non-compete clause fails to meet minimum requirements.
← 8. In order of effective date, they are: Oregon (2008; updated 2022), Illinois (2016; updated 2022), Massachusetts (2018), Maine (2019), Maryland (2019; updated 2023; refined in 2024), New Hampshire (2019), Rhode Island (2020), Virginia, (2020; updated 2025), Washington (2020), Nevada (2021), Colorado (2022), and Washington, D.C. (2022). Florida also has a wage threshold (as of 1 July 2025) which, differently from all the other US states and OECD countries, does not restrict the use of non-compete clauses but provides enhanced enforcement. For workers earning twice the annual average wage of the county where the worker is based, the burden of the proof is inverted, i.e. a clause is considered valid unless the employee proves otherwise (Fair Competition Law, 2026[96]).
← 9. The validity of non‑compete clauses following dismissal may operate differently when the clause includes a compensation requirement, since such compensation effectively functions as a form of severance pay.
← 10. Under strict employment protection, firms facing changes in production methods or product lines are often compelled to retrain their existing workforce rather than adjust employment along the extensive margin. Such retraining gives rise to a classic “hold-up” problem (Hart, 1995[88]): employers may refrain from investing in workers’ skills if training increases workers’ outside options and bargaining power ex post, limiting firms’ ability to appropriate the returns to human capital investment.
← 11. Employee‑level incidence is estimated by weighting firm-level responses by the number of employees and sampling weights. Specifically, firm size brackets are converted into point estimates using their midpoints (i.e. 5‑9 employees: 7; 10‑49 employees: 29.5; 50‑249 employees: 149.5; 250‑999 employees; 1000+: 2000). The share of employees covered in each firm is also estimated using the midpoints (1‑10% of employees: 5.5%; 11‑20% of employees: 15.5%; 21‑ 30% of employees: 25.5%; 31‑40% of employees: 35.5%; 41‑50% of employees: 45.5%; 51‑75% of employees: 63%; 76‑99% of employees: 87.5%; and 100%). The share of employees covered within each firm is then multiplied by this estimated employee count and the IPSOS sector-size sampling weight. The national incidence rate is calculated as the weighted average of these within-firm shares, ensuring the results reflect the total workforce rather than a simple average of firms. As a conservative measure, “Don’t know” responses regarding the share of covered employees are treated as zero.
← 12. Based on previous survey experiences Australia (Andrews and Jarvis, 2023[26]; Andrews, Brennan and Buckley, 2024[27]), Italy (Boeri, Garnero and Luisetto, 2025[28]) and in the United States (Prescott, Bishara and Starr, 2016[25]), graded response options were offered to both employees and employers (“definitely yes”, “probably yes”, “probably no” and “definitely no”), alongside a distinct “don’t know” category. This allowed respondents to express uncertainty.
← 13. The incidence estimates are close for many countries, and the differences between countries with similar incidence estimates are well within the margin of error, meaning that the exact ranking of countries should not be interpreted as definitive. This is also apparent in the differences when countries are ordered based on the employer versus the worker surveys; or whether the ordering is done based on the combination of “definitely yes” and “probably yes” answers versus “definitely yes” only. However, there is significant variation in non-compete prevalence between countries, with the top 3 countries having an incidence estimate that is significantly higher than that of the bottom three countries, using 95% confidence intervals – see Annex Figure 5.B.1.
← 14. Existing evidence points to similarly “surprisingly high” levels of non-compete use across advanced economies, including 21‑22% in Australia, 16% in Italy, 23‑34% in Japan, and around 18% in the United States – see Andrews and Garnero (2025[87]) for a summary. In fact, where directly comparable surveys are available, estimates are closely aligned: for example, employee‑level prevalence in Italy is 16% in Boeri, Garnero and Luisetto (2025[28]) compared to 18% in the OECD-Bocconi survey; in Japan, employer-reported prevalence is 34% in Kodama, Kambayashi and Izumi (2025[51]) compared to 31%; and in the United Kingdom, estimates are 26% in Alves et al. (2024[89]) and CMA (2024[93]) compared to 28%. Some US results (Colvin and Shierholz, 2019[33]) based on establishment surveys, find an even higher incidence.
← 15. The correlation between the prevalence of non-compete clauses as measured in the employee‑level survey and the index of non-compete regulation is 0.23 and is not statistically significant (even after dropping Mexico, keeping only employees who declare to definitely have a non-compete clause, or controlling for employee and firm level characteristics). The correlation with the prevalence of non-compete clauses as measured in the firm-level survey is ‑0.22 and not statistically significant – see Annex Figure 5.B.3.
← 16. In the Netherlands, the government banned the use of non-compete agreements for workers with a temporary contract in 2015, after evidence emerged suggesting that NCCs were often more prevalent in temporary contracts (24%) than in permanent ones (19%) (Streefkerk M., Elshout S. and Cuelenaere B., 2015[90]).
← 17. These estimates should be interpreted with caution. Survey-based measures are inevitably subject to measurement error, as employees may not fully recall the precise terms of the non-compete clauses they have signed, and employers may report practices in stylised terms. In addition, the scope for such measurement error is likely to be correlated with the complexity of the legal framework: in countries where the validity of the clauses depends on a large number of formal requirements, correctly identifying whether a given clause complies with all legal conditions is inherently more difficult, increasing the risk of misclassification. This implies that cross-country differences in the share of apparently non-compliant clauses partly reflect differences in regulatory complexity as well as reporting noise.
← 18. Annex Figure 5.B.10 shows the proportion of non-compete clauses that are unlikely to meet legal requirements once the sample of workers is restricted to those that definitely have a non-compete clause, and who read and understood the clause well. Even though the incidence of clauses that are unlikely to meet the legal requirements falls marginally, it remains high (55‑65% for the average country). Similar pattern can be seen in the employer survey: the share of likely unenforceable clauses declines slightly when including firms who definitely use non-compete clauses, and when only firms that intend to enforce their non-compete clauses are included, but the lower bound of likely unenforceable clauses remains high, above 55%.
← 19. In the United States, around 40% of employees report turning down a job offer from a competitor because of a non-compete clause, even when they work in states where such clauses are banned (Starr, Prescott and Bishara, 2020[35]; Prescott and Starr, 2021[37]). In Italy, although approximately two‑thirds of non-compete clauses appear to be unlikely to be upheld in court, the share of employees reporting the clause as an obstacle to mobility is similar among employees with likely valid and likely invalid clauses (Boeri, Garnero and Luisetto, 2025[28]). In Sweden, 47% of employees in the legal sector who are members of the Akavia trade union report that they would reject a job offer because of a non-compete clause, even though sectoral codes of conduct prohibit the inclusion of such clauses in employment contracts (Akavia, 2021[36]).
← 20. Wage‑fixing agreements are agreements between companies and should not be confused with collective bargaining agreements signed between employers and trade unions which are expressly excluded from antitrust enforcement.
← 21. In some cases no poaching agreements may be permissible under competition law when they are ancillary to a legitimate, pro-competitive collaboration – such as a joint venture – or when they are narrowly tailored and directly related to the implementation of a merger for a limited transition period. In such cases, the restraint must be objectively necessary and proportionate to the main transaction; stand-alone no poaching agreements or broad, open-ended restraints remain unlawful.
← 22. The results are similar when limiting the sample to firms whose estimate of the use of non-compete clauses in their industry matches the prevalence revealed by the OECD-Bocconi employer-survey, i.e. firms that appear well informed of HR practices in their industry.
← 23. See https://www.justice.gov/opa/pr/jury-convicts-home-health-agency-executive-fixing-wages-and-fraudulently-concealing-criminal (accessed on 28 January 2026).
← 24. See https://ec.europa.eu/commission/presscorner/detail/en/statement_25_1381 (accessed on 28 January 2026).
← 25. For the average OECD-EU country, in 2019 (Causa, Luu and Abendschein, 2021[97]).
← 26. New business density (new registrations per 1000 people ages 15‑64), average across survey countries. Entrepreneurship Database, World Bank (https://www.worldbank.org/en/programs/entrepreneurship).
← 27. The analysis builds on a similar approach applied to Australia by Buckley, Rankin and Andrews (2024[64]) who use linked employer-employee data matched with an employer-level survey on the use of non-compete clauses to show that workers employed in firms using non-compete clauses experience slower wages growth over the first few years of their employment.
← 28. It should be noted that in many countries included in the sample, simply having a non-compete clause that specifies duration and scope is sufficient for it to be classified as likely enforceable, meaning workers without tertiary education can also have non-compete clauses that are likely to be upheld in courts.
← 29. These results are obtained from a regression assessing the association between current non-compete clauses and returns to tenure in current job, following a similar approach to that used to estimate the link between past non-compete clauses and returns to total work experience. The employee‑survey did not ask about the characteristics of past non-compete clauses, and hence it is not possible to determine how likely these clauses would have been to be upheld by courts.
← 30. The difference in these figures reflects two different perspectives: the 12% reduction for requiring a non-compete measures the broad impact on all job vacancies where a clause was included (which can deter high-quality applicants from applying at all), whereas the 4‑8% reduction for signing measures the specific wage penalty experienced by the individual employees who ultimately accepted the restricted offer. This does not mean that the individual wage penalty is smaller than the aggregate penalty as the two add up.
← 31. In addition, Abrahams and Fesko (2025[94]) have studied how relaxing non‑compete‑like restrictions affects the allocation of talent and the resulting productivity dynamics in women college basketball in the United States. They find that greater player mobility intensifies competition by allowing talent to flow to lower‑productivity teams, while simultaneously strengthening elite programmes’ dominance as they retain performance stability and increasingly recruit top players from lower‑tier teams rather than incoming freshmen.
← 32. The employer-level survey is used to compute the industry-country level prevalence of non-compete clauses due to the higher precision of responses compared to the employee‑level survey.
← 33. Due to the small sample of countries included and the relatively limited variation in regulation – for example, the sample does not include any country where non-compete clauses are banned – the estimates are subject to some statistical imprecision. But the pattern is consistent with the idea that non-compete clauses have a stronger negative relationship with productivity in countries where such clauses are less regulated (i.e. are more likely to be upheld in court).
← 34. There are many other channels through which non-compete clauses may influence aggregate productivity, as detailed at the beginning of the section. For example, entry, exit, innovation, and the competitive environment could all be affected. As the empirical estimates zoom in on reallocation and catch-up growth, the analysis is limited to isolating the aggregate effects associated with these mechanisms.
← 35. As the empirical specification capturing catch-up growth is only estimated for non-frontier firms, the computation implicitly assumes that the labour productivity of frontier firms does not change when the non-compete incidence increases.
← 36. In terms of magnitude, this corresponds closely to the share of employees covered by a non-compete clause despite having no access to confidential information (9.5%), making it a policy-relevant benchmark. It should be noted that the empirical estimates are obtained for the overall non-compete incidence and therefore increasing the non-compete incidence for specific groups of employees may have larger or smaller effects than the estimates computed here. Nevertheless, the computation below remains informative of the potential magnitude of productivity costs associated with the spread of non-compete clauses amongst employees for whom they may be less justified.
← 37. The total effect, displayed by the blue diamonds, is slightly attenuated by the presence of an interaction term between reallocation and within-firm productivity in the decomposition. Details of the computation and definitions are presented in Andrews, Garnero and Holttinen (2026[72]).
← 38. The baseline estimates include firm-level controls as well as industry x country and time fixed effects. Even when including additional controls (interactions with NDA and no-poach agreement prevalence, as well as EPL and PMR), the more conservative estimates imply sizeable productivity losses from higher non-compete prevalence: a 10 p.p. increase in non-compete clauses is associated with aggregate productivity losses of 1.7 p.p., stemming from a 0.2 p.p. loss due to less efficient resource allocation and a 1.5 p.p. loss due to slower catch-up growth. In addition, including these controls does not alter the conclusion that the estimated losses are larger in countries with more lenient regulation: the estimated aggregate productivity losses associated with a 10 p.p. increase in the prevalence of non-compete clauses is 1.4 p.p. in countries with stricter regulation, increasing to 1.8 p.p. in countries where non-compete clauses are more likely to be upheld by courts (more lenient regulation). Andrews, Garnero and Holttinen (2026[72]) provides more detail on the robustness of the estimates.
← 39. The survey did not ask employers of current innovation activities and hence recent introduction of new products, services or processes is used as a proxy for innovation. A caveat of this approach is that it is not a perfect measure of current innovation activity, which could show stronger links with non-compete use.
← 40. A regression analysis exploring associations between firm non-compete use, innovation, training and growth that controls for firm characteristics as well as industry fixed effects did also not result in any statistically significant differences in non-compete use along these dimensions.
← 41. Modelling work by Gottfries and Jarosch (2026[99]) suggests that once such spillovers are taken into account, restricting non-compete clauses may be a relatively low-cost way of restoring wage competition, even if it leads to higher turnover.
← 42. See https://blogs.microsoft.com/on-the-issues/2022/06/08/microsoft-announces-four-new-employee-workforce-initiatives/ (accessed on 20 January 2026).
← 43. The Australian Government is finalising detailed policies on matters related to the ban, including penalties for breaches and transitional measures. It is also considering whether additional reforms to non-compete clauses are required for high-income employees and related restraints, such as non-solicitation clauses for clients and co-workers.
← 44. Hiraiwa, Lipsitz and Starr (2024[40]) show that firms do not place significant value on the formal validity of non-compete clauses for workers earning below such thresholds, reinforcing the case for targeted exemptions.
← 45. Other exemptions are more narrowly targeted, such as those for broadcasters in Oregon or automobile sellers in Louisiana, suggesting the influence of sector-specific lobbying rather than consistent economic principles.
← 46. Approaches based on job titles carry the risk of “job title inflation” being used to bypass the law. Cohen, Gurun and Ozel (2023[91]) find that managerial title usage increases fivefold just over the regulatory threshold to avoid overtime payments in the United States.
← 47. Oregon was the first US state to require advance notice (i.e. not permitting a noncompete to be disclosed to a worker for the first time on the first day of the job). Oregon was then followed by Massachusetts (2018), New Hampshire (2019), Maine (2019), Washington (2020), Virginia (2020), Illinois (2021), and Colorado (2022), Washington, D.C. (2022), and Florida (2025) with various types and standards of notice requirements (Beck Reed Riden, 2026[95]).
← 48. There is some uncertainty about the effectiveness of a non-compete clause in cases of unlawful dismissal or employee termination with just cause. Article 136(3) of the Labour Code provides that, in such cases, the compensation may be increased up to the base salary at the date of termination; otherwise, the non-compete clause cannot be enforced.
← 49. See https://www.jdsupra.com/legalnews/payday-lender-ends-non-compete-47106/ (accessed on 19 February 2026).
← 50. In Spain, the use of overly broad or abusive non-compete clauses can trigger both judicial and administrative consequences. Judicially, a clause that fails to meet the requirements of Article 21 of the Workers’ Statute (e.g. lack of adequate compensation or exceeding the 2‑year limit) is typically declared null and void, freeing the worker from the restriction. Administratively, such conduct may be classified as a “grave infraction” under Article 7.10 of the Law on Infractions and Sanctions in the Social Order (LISOS) for imposing working conditions inferior to those established by law. Following the 2021 reform (Law 10/2021), these infractions carry administrative fines ranging from EUR 751 to EUR 7 500, depending on the severity and number of affected workers.
← 51. In Colorado, employers found in violation may be required to pay USD 5 000 per affected worker or prospective worker, while in Maine fines of at least USD 5 000 may be imposed. Virginia provides for penalties of USD 10 000 per violation, and in Illinois courts may impose penalties of up to USD 5 000 per violation, or USD 10 000 for repeated violations within a five‑year period. Similarly, the District of Columbia provides that employers attempting to use a void non-compete clause are liable to each affected employee for relief of no less than USD 1 500.
← 52. In Finland, a 2022 reform to non-compete legislation extended compensation requirements to cover all non-compete clauses. Whilst the reform seems to have reduced the incidence of non-compete clauses somewhat, a large margin of uncertainty amongst workers remain, with many being unaware of whether or not they have a non-compete clause. Raising awareness of non-compete legislation was one of the key policy recommendations that emerged from a post-reform evaluation in 2024 (Mahonen and Lyly-Yrjanainen, 2024[84]).
← 53. See for example the webpage of the French Government https://www.service-public.gouv.fr/particuliers/vosdroits/F1910?lang=en (accessed on 21 January 2026).
← 54. The Advisory, Conciliation and Arbitration Service (Acas) in the United Kingdom can provide a useful example.
← 55. See https://eab.business.govt.nz/employmentagreementbuilder/ (accessed on 21 January 2026).
← 56. Response rates in telephone surveys are generally low, and they have been declining in recent years. In Europe, response rates for telephone surveys typically vary between 5% and 15% for random probability studies, as evidenced by the Flash Eurobarometer series of surveys run by Ipsos since January 2021. Response rates for business surveys are even lower, and it is important to recognise that participation can represent a significant investment for businesses. The response rates observed for this study are consistent with previous findings.